Learn how to ship Redis Logs to ELK and Logz.io in order to optimize its performance...
Cloud migration is more than just a buzzword. According to several reports released at the beginning of...
Prometheus and Grafana are two monitoring tools that, in combination, provide all of the information DevOps and...
At AWS re:Invent recently, we excitedly announced Logz.io Infrastructure Monitoring! This product is the third pillar of...
Microk8s are the easiest way to set up a single node cluster for Kubernetes. We run through...
Yesterday, we announced the beta release of Logz.io Infrastructure Monitoring and the planned release of a Jaeger-based...
Almost every DevOps team out there is currently in the process of creating a proof of concept...
Cloud, microservices, Kubernetes — all these bleeding-edge technologies revolutionizing the way applications are built and deployed are...
Hosted Kubernetes services such as AKS were introduced to help engineers deal with the complexity involved in...
Getting acquainted with the terminology is one of the first things you’re going to have to do...
It’s 3 AM and your phone is ringing. Rubbing your eyes, you take a look at the...
We’re happy to announce a new integration with Google Stackdriver, allowing users to easily ship data from...
At Logz.io we’re always keeping tabs on the latest and greatest in the DevOps world, for the...
Businesses today cannot afford to be hacked. Cyber attacks can result in hefty fines and lawsuits, not...
This article provides the pros and cons of the top 10 open source monitoring tools for Kubernetes...
This article provides a step-by-step guide for deploying the ELK Stack on Kubernetes with Helm charts.
Securing a Kubernetes cluster has become mission-critical for DevOps teams. This article will review the different modules...
Learn how to integrate Vault with Logz.io Security Analytics. See how to install it, enable audit logs,...
The increased complexity of modern IT environments has resulted in changes in logging workflows. Read about these...
This article lists features, tools, and insights into Elasticsearch's data model to make the challenge of managing...
Can there be a compromise in the endless debate of speed vs. quality? Are the two mutually...
What's new in Logz.io this September? We launched many new features like Drop Filters, Archive/Restore, Reports, IAM...
Easily monitor time series data by leveraging Grafana's robust capabilities, community, and leveraging our tips for creating...
Easily create and share reports about your system's performance with Scheduled Reporting, Logz.io's newest feature! Find out...
Elasticsearch Aggregations enable you to group and perform calculations and statistics on your data. Learn how to...
Learn about our enhanced Zeek support in Logz.io Security Analytics, including easy integration, new correlation rules, and...
Use the Nginx web server? Here are some useful tips for monitoring its performance using the ELK...
Ship all the logs you want in a cost-efficient manner with Logz.io Drop Filters! Learn how it...
Cloud monitoring can be a daunting task, but it is an essential part of maintaining your system...
A comparison of Hive vs. Spark examining features, capabilities, integrations, architecture, history and more. Find the best...
Introduction Apache Flume helps organizations stream large log files from various sources to distributed data storage like...
Reduce the complexity of your service mesh by monitoring it with Istio and analyzing and visualizing the...
Difficulty balancing between too many and too few dimensions in metric data is known as the Cardinality...
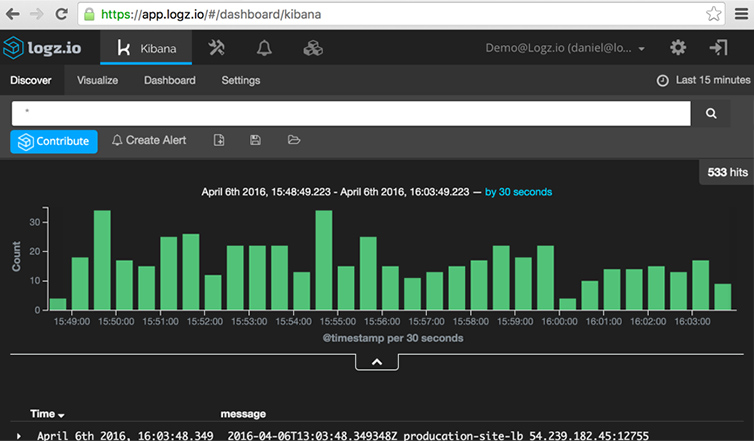
Redis is a buffering layer, giving downstream components better chances of processing and indexing data successfully. Here's...
Learn about the world's most popular open source monitoring tools as well as the pros and cons...
Learn how to to force fields into specific data types and add, copy, and update specific fields...
Jaeger is a popular open source distributing tracing tool. Learn how you can use it with the...
Learn the best practices for Apache Tomcat Monitoring. Easily setup, ship, analyze and visualize your data. Here's...
Want to use ELK on Mac OS? Get started in just a few clicks with our guide...
Easily deploy the ELK Stack on Alibaba cloud with our step-by-step guide. Install Elasticsearch, Logstash, and Kibana...
Our comparison of metricbeat vs. telegraf shows both metric collector's strengths and weaknesses as well as how...
This Complete Guide to Azure Monitoring provides extensive tips and best practices for monitoring Azure with Microsoft...
Our ELK API analysis shows how we used open data from OpenWeatherMap's API in order to analyze...
The ELK Stack, traditionally consisted of three main components -- Elasticsearch, Logstash and Kibana. Now it can...
Learn how to create custom Kibana visualizations with Vega and Vega Lite. Read our guide to for...
Kibana is the visualization layer of the ELK Stack. The first part of this Kibana tutorial shows...
Our new integration with Zipkin allows you to easily ship distributed tracing data into Logz.io for improved...
Protect Logstash and Elasticsearch against such data bursts using Kafka. Find out how to deploy it on...
Log management today is critical for gaining visibility into IT environments. However, modern applications and the infrastructure...
Unlike most NoSQL databases, Elasticsearch focuses on search capabilities and features. The easiest way to get data...
Find out how to increase the availabilty of your applications by keeping tabs on your Azure Application...
Find out how you can speed up your security investigations with Drilldown, a new feature in Logz.io...
Retain the data you need regardless of the timestamp attached with Logz.io's Archive and Restore for historical...
Here's how to leverage Microsoft Azure to install the ELK Stack easily with two different techniques: Azure...
Elasticsearch breaches occur on an almost daily basis. We talked to an expert to see what you...
How is Open Distro for Elasticsearch different from other offerings? We cover the features, benefits, and limitations...
ELK is a great open-source stack for log aggregation and analytics. Here's our guide to the simple...
The Elastic GKE Logging app is a nice way to set up the EFK Stack on Kubernetes....
So you've successfully identified a log management system that fits your organization's needs. Here's how to get...
Learn how to collect and ship logs from a Kubernetes cluster deployed on GKE to Logz.io’s ELK...
Logstash is a key part of the ELK Stack, but its quirks are hard to manage. Here's...
Easily troubleshoot application performance issues by monitoring Java Garbage Collection logs with ELK and Logz.io. Learn how...
Gain full control over cluster management and container orchestration by deploying a Kubernetes cluster with GKE. Here's...
Just in time for RSA, we have added many new exciting features to Logz.io Security Analytics. Read...
There are many requirements you should put on your checklist when searching for a log management solution....
Logz.io has a new integration for Microsoft Azure! Learn how to get insights into your Azure activities...
Deploying Kubernetes is extremely complex, which has lead to the rise of managed Kubernetes services. Here's how...
Secure your ELK Stack by deploying nginx in front of Elasticsearch and Kibana to act as a...
Explore the steps for installing and integrating Suricata with Logz.io and the ELK Stack for network security...
This tutorial features Kafka logging best practices to help you easily monitor your Kafka instances using the...
A real-life example of our team successfully identifying and troubleshooting a Netty memory leak using Logz.io's Cognitive...
Logz.io is now integrated with Azure! Find out how to perform various aspects of Azure monitoring and...
Contemplating using either a SIEM or Security Analytics solution? Find out which one best suits your needs...
As modern IT environments have evolved to become increasingly complex, new challenges in log management have developed....
A deeper dive into retention requirements, challenges, and strategies to help develop and optimize your data retention...
A guide for optimizing Elasticsearch using Rally, Elastic's new benchmarking tool.
Prepare yourself for various compliance standards such as HIPAA and PCI by getting started with these data...
Learn how to track and monitor Jenkins build activities including the build name, number, execution time, result,...
When using seperate tools for monitoring, troubleshooting, security and more, tool sprawl is a common problem. Here's...
A step-by-step guide for monitoring your application performance using Elastic APM and Logz.io
A step-by-step guide for monitoring AWS GuardDuty using Logz.io Security Analytics and the ELK Stack to secure...
DDoS attacks are every business's worst nightmare. Here's advanced DDoS mitigation techniques to prevent these terrible attacks....
Find out how you can use monitoring and logging to fulfill your compliance requirements such as HIPAA,...
A guide for using Logz.io Security Analytics, a simple and powerful ELK-based security application, that suits your...
Audit logs capture events, showing “who” did “what” activity and “how” the system behaved. Here's how to...
What is Jenkins and why is it a leading CI/CD tool? Find out everything you want to...
Learn about our newest update to our Live Tail feature. Now you can see your parsed logs...
Many businesses experience issues while attempting to migrate to the cloud. Here are some cloud migration best...
Learn how to use Kibana advanced queries and searches such wildcards, fuzzy searches, proximity searches, ranges, regex...
Looking into time series monitoring solutions? Here's our comparison of Prometheus vs. Graphite, two of the most...
Kubernetes is the leading container orchestration service. Here's how to hook it up to Fluentd, Elasticsearch, and...
Getting started with tracing? Learn which tool is best for you. Read our side by side...
One of the most intriguing additions in Elasticsearch 6.3 is its Elasticsearch SQL support. Here's our review...
There are many hosted Kubernetes platforms that have been developed due to Kubernetes's explosion in popularity. Here...
Fluentd and Fluent Bit are two popular log aggregators. Find out the similarities and differences between Fluentd...
SIEMs are an important part of security and compliance. But as the leading log analysis platform, can...
Learn about the top 5 commercial SIEM tools (pros, cons, etc.) and find out which one will...
This article explores integrating Google Pub/Sub with the the world’s most popular open source log analysis platform...
DockerCon 2018 is sure to be an event to remember. Here's how the company has evolved over...
Docker and Kubernetes are taking the container ecosystem by storm, but are they competitors? We analyze what...
Fluent Bit is an open source log shipper and processor that collects data from multiple sources and...
Distributed tracing is a tracing methodology that seeks to overcome challenges tracing microservices. Learn how to integrate...
Logz.io's Markers were created to help you connect the dots and understand the underlying story of your...
SIEM is being implemented in a growing number of organizations to protect their environments and to...
Filebeat is the most popular and commonly used member of ELK Stack's Beat family. This article seeks...
Looking to visualize your data in Kibana? Part 2 of our Kibana tutorial will show you how...
Before getting involved in Cryptocurrency, it's important to know how to strategically buy and sell in this...
Kibana is a great visualization tool, but even Kibana pros may have trouble figuring out some the...
You can now log DNS queries routed by AWS Route 53. After sending Route 53 query logs...
In part 2 of our series on Bro Log Analysis with the ELK Stack, we will look...
Bro is a feature-rich, open source network security monitor that tracks network traffic in real time. Read...
What do you call an ELK with a tail? Take a look at Live Tail - for...
Canvas allows Kibana users to visualize their live data in ways that were previously not possible. We...
Here is an overview of the latest features and news from Logz.io: new efficient log management, export/import...
Unless you are using Elasticsearch for development and testing, creating and maintaining an Elasticsearch cluster will be...
The ELK Stack can be installed on a variety of different operating systems and in various different...
The release of Kubernetes on Docker is a real game-changer. We review this new release and take...
Kubernetes handles containers in several computers, and removes the complexity of handling distributed processing. But whats the...
Elasticsearch performance monitoring is as essential as monitoring the performance of any other tool in your stack....
Kibana is a great tool for analyzing your Puppet server log data. In part 2 of our...
The removal of Elasticsearch mapping types is a process that has taken a serious step forward in...
Puppet automates the deployment, configuration and management of infrastructure. Find out how to use the logging features...
Want to track your fitness goals and make your 2018 new year’s resolution a success? Here’s how...
Jenkins is one of the most widely-used open-source continuous integration tools. Here's how to create a logging...
Learn how to monitor AWS Lambda triggers with the ELK Stack using CloudTrail in order to better...
Learn how to configure your Data Center Operating System (DC/OS) setup to collect and report logs to...
Docker monitoring is critical for optimizing Docker performance. Here's how to use Metricbeat to ship Docker metrics...
Slack is an important communication tool for DevOps teams. Here are 5 Slack apps you can use...
Stop paying for data you don't need. Learn how Logz.io's Data Optimizer will provide greater flexibility and...
Using Logstash can be a pain. The Pipeline Viewer helps to identify and resolve potential parsing bottlenecks....
A comprehensive guide on how to measure traffic coming in and out of the Azure Cloud with...
This article will try and provide an overview of the main API calls that you should get...
Storing a large amount of time series data can be tough. Find out the pros and cons...
Find out how AWS users can use distributed data sources from auditing and logging tools to give...
Easily monitor who accessed the system and what activity they performed with our new Audit Trail feature!...
Filebeat is an extremely reliable log shipper, but there are some downfalls. Read on to get insights...
The finalists for our Kibana Dashboard Contest are in! Choose your favorite Kibana dashboard and you could...
Learn how to use Kubernetes for container orchestration along with the ELK Stack for analyzing and visualizing...
Now Logz.io users can manually handle mapping with our new Field Mapping feature. Find out how to...
Discover the new features we have added to the Logz.io ELK Stack to make logging easier and...
Using Kibana is not always easy. Read on to discover the best practices for creating beautiful Kibana...
System auditing is crucial to compliance and security. Learn how Linux users can use Auditbeat and the...
Find out how to reduce the complexities of serverless architecture by using the ELK Stack as a...
Learn how to improve cross-team collaboration by instantly sharing ELK dashboards and visualizations with Logz.io's new Kibana...
A guide to the five most popular Logstash filter plugins to transform your log data for improved...
How to use Ansible to set up ELK (version 5.x) on a remote server in order to...
A step-by-step guide on installing ELK Stack on Windows using Elasticsearch version 5.5 and the new .msi...
Learn about the unique features Logz.io built on top of the popular open source ELK Stack for...
A step-by-step guide on easily developing and deploying applications while maintaining infrastructure using Cloud Foundry and the...
Maintaining a cloud production environment is no easy feat. Here are the pros and cons of managing...
One of Kibana’s weak spots is time series analysis. Timelion was one step forward, but now we...
We are happy to announce a contest open to all ELK Stack users for the best Kibana...
To keep applications running at all times and handle incidents correctly, the right incident management tools are...
People are still confused by the differences. This post sheds light on what makes them alternatives to...
In the previous post, we examined how to set up the integration between Wazuh’s fork of OSSEC...
OSSEC is a comprehensive platform used for monitoring and controlling systems that contains a mixture of HIDS,...
Based on the monitoring solutions at Monitorama this year, we can safely say that the machine learning...
OpsGenie is an incident management platform that helps to manage alerts being triggered in environments. Here's how...
Logz.io, a sponsor of Monitorama again this year, interviews some of the top speakers on why they...
Just like a doctor uses X-rays to see inside your body, Amazon X-Ray can see inside our...
Logz.io supports hooking in any application that accepts data via REST API. Here's one such example using...
There are no lessons teaching YAML syntax. When using Beats shippers, we learn by error. Here are...
The other benefits of Docker containers make it hard to centralize their logs for analysis. Here's the...
Elastic Load Balancers allow AWS users to distribute traffic across EC2 instances. You can use ELK to...
Which Elasticsearch monitoring plugins are compatible with version 5? We've got a full list of what still...
The transiency, distribution, and isolation of Docker containers make it hard to centralize all of their logs...
By adding Grafana to Prometheus as a visualization layer, you can easily set up a monitoring stack...
Logs in CloudWatch can be searched, but there is no easy way to properly visualize and analyze...
Any anti-DDoS strategy must have three elements: log retrieval and parsing, dashboard monitoring, and alerting mechanisms. The...
How to ingest the data from the Oroville Dam incident into the ELK Stack for educational analysis....
If you’re running ELK on Docker, it’s imperative to keep tabs on your containers. Here's how to...
X-Ray grants visibility into the performance of deployed applications by providing traces of requests as they go...
Data in Grafana dashboards can be read and analyzed more easily than with Kibana. Here's how to...
OnPage helps DevOps teams track every triggered alert through a comprehensive alert management platform. Here's how to...
AWS Elastic Beanstalk allows users to deploy and manage apps without worrying about the infrastructure behind the...
Elasticsearch plugins extend the platform's functionality. Here's some basic tips and tricks from how to install them...
The attacks on Elasticsearch clusters are leaving indices empty and demands for bitcoin payments to recover the...
Portainer may not be a logging solution for Docker, but it is an extremely useful and easy-to-use...
We have a new Search API that enables you to safely and securely query the data that...
BigPanda reduces the signal-to-noise ratio in IT monitoring. Logz.io creates advanced alerts on specific log messages. Here's...
How the Docker Datacenter can work with existing cloud platforms when setting up internal containers-as-a-service (CaaS) environments.
It was impossible to visit every single company at re:Invent 2016, but here are some of the...
Where Kibana falls short in time series analysis and visualization, Timelion helps by combining independent data sources...
Why do you need server log analysis? Find out how to use the ELK Stack to extract...
In case you missed the live stream, here's a recap from Las Vegas of the major news...
Built-in alerting is a popular Logz.io feature. Now, we've integrated with PagerDuty and added the ability to...
How to set up the integration between Docker and AWS and then establish a logging pipeline from...
Mapping in Elasticsearch can seem daunting, especially if you’re just starting out with ELK. This article will...
Autumn in Las Vegas means one thing -- it’s time for AWS re:Invent. Here are the top...
Learn about how Cognitive Insights can change the way you do log analysis by analyzing human interaction...
Sysdig monitors Linux systems and containers, but it can generate thousands of log messages per minute. The...
In the prior post, we saw how to log ECS container API actions with CloudTrail and ELK....
Dockbeat uses the docker stats API to push container resource usage metrics to Elasticsearch or Logstash. Here's...
Once collected by Logstash and stored in Elasticsearch, Magento logs can be analyzed in real time and...
NGINX access logs contain a wealth of information that when monitored efficiently, can provide a clear picture...
Kibana is one of the reasons that people opt for using the ELK Stack, but some features...
The biggest challenge facing IT and DevOps teams is finding the needle in the haystack of information....
Windows event logs contain a wealth of information, but it's hard analyze that data because of the...
To analyze Drupal logs, you need to centralize all log data streams, query this data to identify...
How to collect and analyze MongoDB metrics using the ELK Stack so that you can keep a...
Centralized logging is difficult. The ELK Stack can digest large sets of data from numerous sources and...
The Docker community is creating more solutions to monitor Dockerized environments and gain visibility into the health...
There are five specific issues that almost every ELK Stack user has encountered. Here's how to fix...
Topbeat collects system-related infrastructure metrics that the ELK Stack can index and analyze.
The top ten company blogs, online communities, and consultant websites to follow to learn more about the...
PCI-DSS is an IT compliance standard for organizations that process major credit cards. Here's how to build...
It's important to monitor the health of the machine that is hosting Docker. Here's how to do...
Our Docker log collector collects logs and monitoring statistics from Docker environments and streams them into our...
By ingesting Salesforce data into ELK, sales and marketing teams can perform deep analyses of numerous cross-team...
Amazon Web Services log data is an extremely valuable resource that can be used to gain insight...
Fluentd is an open source data collector developed by Treasure Data that acts as a unifying logging...
Analyzing query performance can help to determine causes of database bottlenecks. In the case of MySQL, one...
Run a free health check to uncover performance bottlenecks, config issues, and cost inefficiencies.