
Java garbage collection logging with the ELK Stack and Logz.io
March 15, 2019

Java programs running on JVM create objects on the heap. At some stage, these objects are no longer used and can pile up as “garbage” needlessly taking up memory. Replacing the manual process of explicitly allocating and freeing memory, the Java Garbage Collection process was designed to take care of this problem automatically.
Put simply, Java Garbage Collection is a process for optimizing memory usage by looking at heap memory, identifying which objects are being used (aka referenced objects) and which aren’t (aka unreferenced objects), and removing the unused objects. Removing these unused objects results in freeing up memory for smoother execution of programs. More on the subject:
The Java Garbage Collection process can also generate a log file containing information about each collection performed, its results and duration. Monitoring this log over time can help us understand how our application is performing and optimize the garbage collection process. In this article, I’ll show how to aggregate these logs using the ELK Stack.
Enabling Java garbage collection logging
To use Java Garbage Collection logs, we need to first enable them by passing some arguments when running JVM. By default, the Java Garbage Collection log is written to stdout and should output a line for every collection performed, but we can also output to file.
There are many JVM options related to Garbage Collection logs, but at a minimum, these are the parameters you will want to start out with:
-XX:+PrintGCDetails -XX:+PrintGCDateStamps -Xloggc:/opt/app/gc.log
- -XX:+PrintGCDetails – for enabling detailed logging verbosity
- -XX:+PrintGCDateStamps – for adding date and time timestamps
- –Xloggc:<file-path> – to log to file
Understanding a Java garbage collection log
A typical Garbage Collection log will contain detailed information on memory allocation for the three different heap “generations” — young generation, old generation and permanent generation (to understand the JVM memory model, I recommend reading this informative article).
Below is an example, followed by a brief explanation of the different types of information available for analysis but it’s important to understand that Java Garbage Collection logs come in many different flavors and tastes and the format of your logs will depend on the JVM version you’re using.
2019-03-05T15:33:45.314+0000: 7311.455: [GC (Allocation Failure)
2019-03-05T15:33:45.314+0000: 7311.455: [ParNew: 68303K->118K(76672K),
0.0097455 secs] 165753K->97571K(1040064K), 0.0101806 secs]
[Times: user=0.01 sys=0.00, real=0.01 secs]
Let’s try and understand what we’re looking at:
- 2019-01-18T18:39:17.518-0600 – the timestamp for when Garbage Collection was executed.
- 7311.455 – when the Garbage Collection started (in seconds) relative to the JVM startup time.
- GC – the type of Garbage Collection executed. In this case, a Minor GC but it could be ‘Full GC’ .
- Allocation Failure – the cause of the collection event. In this case, Garbage Collection was triggered due to a data structure not fitting into any region in Young Generation.
- ParNew – the type of collector used. “ParNew” is a stop-the-world, copying collector which uses multiple GC threads.
- 68303K->118K(76672K), 0.0097455 secs – young generation space before -> after collection, (current space) and duration of event.
- 165753K->97571K(1040064K), 0.0101806 secs – the overall heap memory change after the Garbage Collection ran and the total allocated memory space.
- 0.0101806 secs – Garbage Collection execution time.
- [Times: user=0.01 sys=0.00, real=0.01 secs] – duration of the GC event:
- user – total CPU time consumed by the Garbage Collection process
- sys – time spent in system calls or waiting for system events
- real – elapsed time including time slices used by other processes
Collecting Java garbage collection logs with ELK
To be able to effectively analyze Garbage Collection logs you will need a better solution than your preferred text editor. There are some tools available specifically for analyzing these logs such as the GCViewer but if you’re interested in correlation with other logs and data sources, a more centralized approach is required.
The ELK Stack to the rescue! I’ll be demonstrating how to use both Logz.io or your own deployment to collect, process and analyze the Garbage Collection logs.
Shipping to ELK
To collect and ship Garbage Collection logs to your own ELK deployment you’ll need to install Filebeat and Logstash first. If you don’t have these already installed as part of your logging pipelines, please refer to this tutorial.
Configuring Filebeat
Filebeat will simply forward our Garbage Collection logs to Logstash for processing.
sudo vim /etc/filebeat/filebeat.yml
The abbreviated form of the file will look something as followed:
filebeat.inputs:

- type: log
    enabled: true
  paths:
    - /var/log/<pathtofile>

output.logstash:
  hosts: ["localhost:5044"]
Save the file.
Configuring Logstash
Your Logstash configuration file needs to define Filebeat as the input source, apply various filtering and processing to the Garbage Collection logs and then forward the data to Elasticsearch for indexing.
Below is an example of a Logstash configuration file for processing the Garbage Collection logs explained above. Remember – you may encounter other formats and so the filtering might need to be tweaked.
Create a new configuration file:
sudo vim /etc/logstash/conf.d/gc.conf
Paste the following configuration:
input {
  beats {
    port => 5044
  }
}

filter {
    grok {
      match => {"message" => "%{TIMESTAMP_ISO8601:timestamp}: %{NUMBER:jvm_time}: \[%{DATA:gc_type} \(%{DATA:gc_cause}\) %{DATA:gc_time}: \[%{DATA:gc_collector}: %{NUMBER:young_generation_before}\K\-\>%{NUMBER:young_generation_after}\K\(%{NUMBER:young_generation_total}\K\)\, %{NUMBER:collection_time} .*?\] %{NUMBER:heap_before}\K\-\>%{NUMBER:heap_after}\K\(%{NUMBER:heap_total}\K\)\, %{NUMBER:gc_duration} .*?\] \[.*?\: .*?\=%{NUMBER:cpu_time} .*?\=%{NUMBER:system_time}\, .*?\=%{NUMBER:clock_time} .*?\]"}
    }
    mutate {
      convert => {
        "young_generation_before" => "integer"
        "young_generation_after" => "integer"
        "young_generation_total" => "integer"
        "heap_before" => "integer"
        "heap_after" => "integer"
        "heap_total" => "integer"
        "gc_duration" => "integer"
        "cpu_time" => "integer"
        "system_time" => "integer"
        "clock_time" => "integer"
        }
    }
}

output {
  elasticsearch {
    hosts => ["localhost:9200"]
  }
}
Save the file.
Starting the pipeline
All that’s left to do is start Filebeat and Logstash:
sudo service filebeat start
sudo service logstash start
If no problems arise, you should see a new Logstash index created in Elasticsearch:
curl -X GET "localhost:9200/_cat/indices?v"

health status index                       uuid                   pri rep docs.count docs.deleted store.size pri.store.size
green  open   .kibana_1                   LPx5-jcxROO4lzYCDxlDOg   1   0          3            0       12kb           12kb
yellow open   logstash-2019.03.07         9CyfZ_pFRr2oCcVCzJeEdw   5   1         29            0      432kb          432kb
Open up Kibana and define the new index pattern in the Management → Kibana → Index Patterns page:
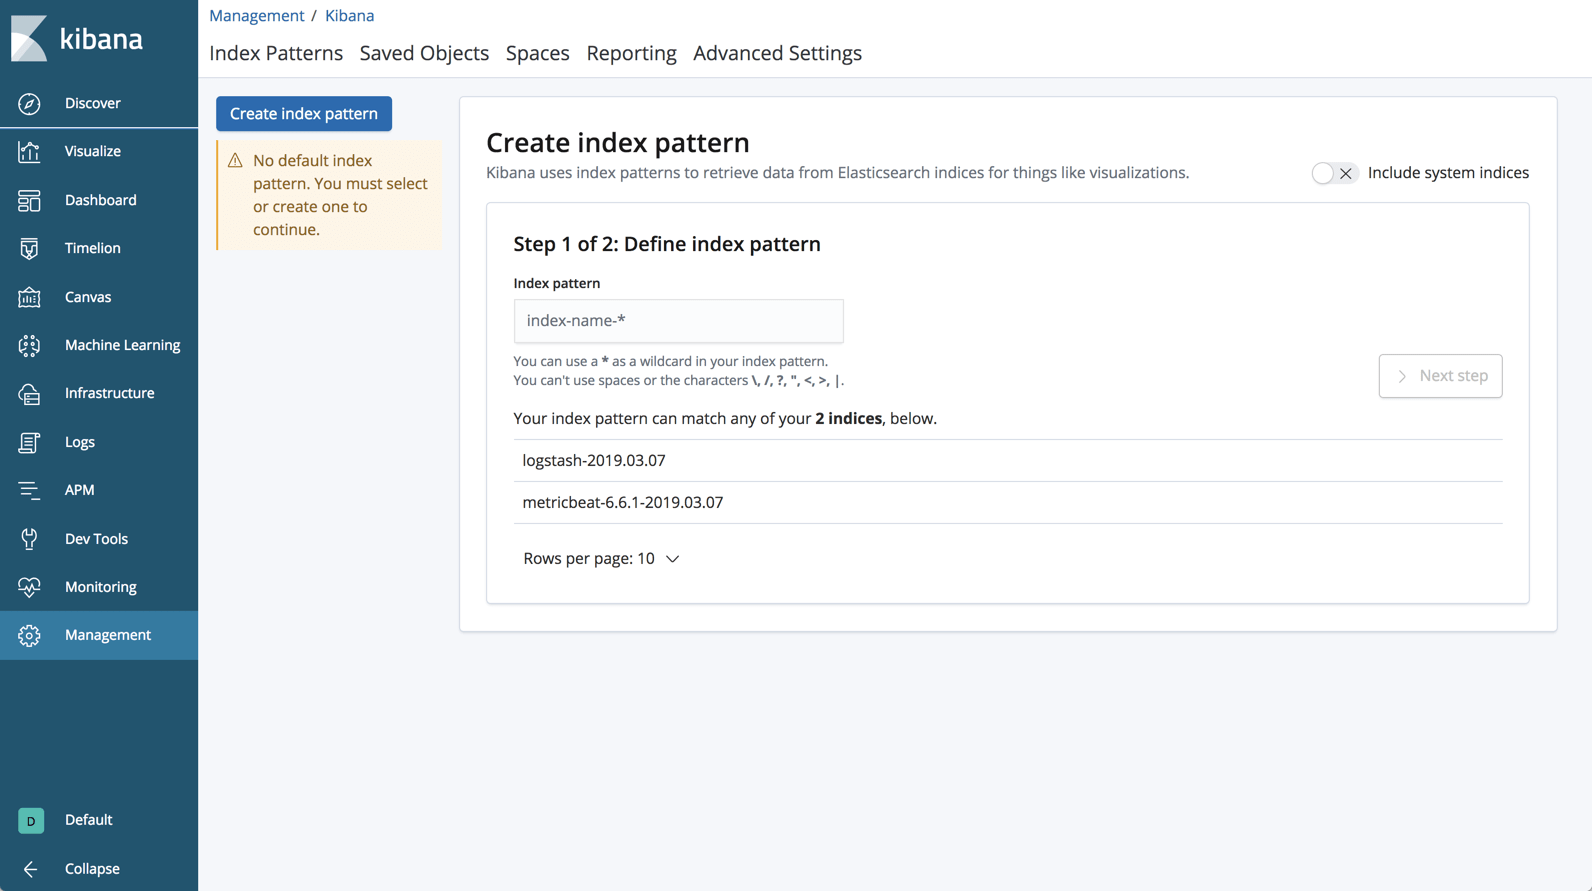
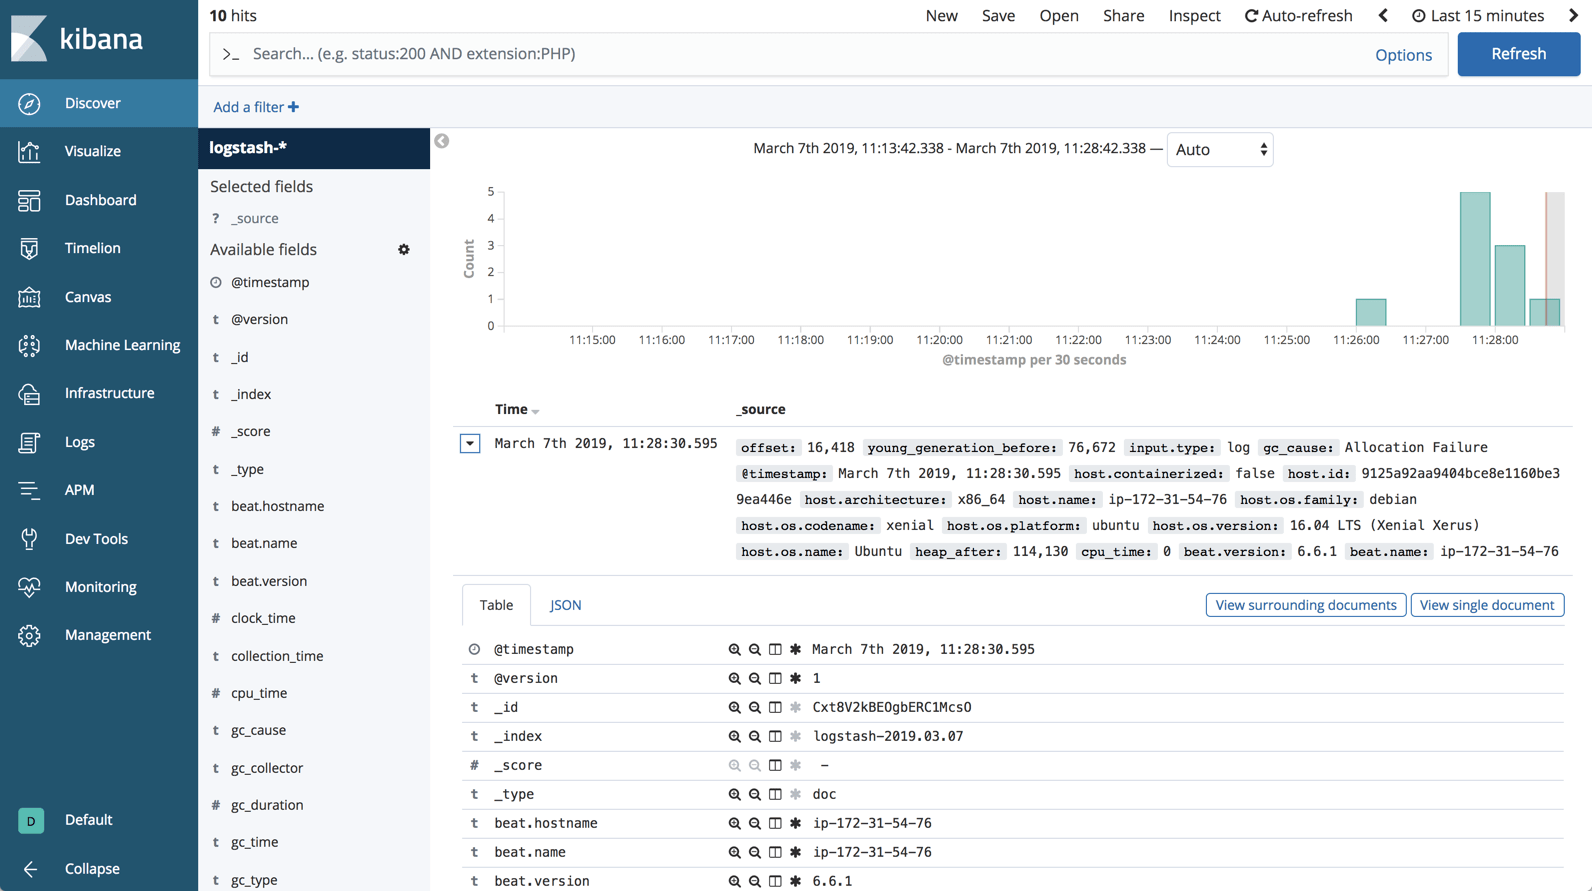
Once defined, you’ll see the Garbage Collection logs displayed and parsed on the Discover page:
Shipping to Logz.io
To ship the data into Logz.io, some tweaks are required in our Logstash configuration file — we need to add a mutate filter for adding the Logz.io account token and we need to change the output to point to Logz.io’s listeners.
Open the configuration file:
sudo vim /etc/logstash/conf.d/gc.conf
Paste the following configuration:
input {
  beats {
    port => 5044
  }
}

filter {
    grok {
      match => {"message" => "%{TIMESTAMP_ISO8601:timestamp}: %{NUMBER:jvm_time}: \[%{DATA:gc_type} \(%{DATA:gc_cause}\) %{DATA:gc_time}: \[%{DATA:gc_collector}: %{NUMBER:young_generation_before}\K\-\>%{NUMBER:young_generation_after}\K\(%{NUMBER:young_generation_total}\K\)\, %{NUMBER:collection_time} .*?\] %{NUMBER:heap_before}\K\-\>%{NUMBER:heap_after}\K\(%{NUMBER:heap_total}\K\)\, %{NUMBER:gc_duration} .*?\] \[.*?\: .*?\=%{NUMBER:cpu_time} .*?\=%{NUMBER:system_time}\, .*?\=%{NUMBER:clock_time} .*?\]"}
    }
    mutate {
      convert => {
        "young_generation_before" => "integer"
        "young_generation_after" => "integer"
        "young_generation_total" => "integer"
        "heap_before" => "integer"
        "heap_after" => "integer"
        "heap_total" => "integer"
        "gc_duration" => "integer"
        "cpu_time" => "integer"
        "system_time" => "integer"
        "clock_time" => "integer"
        }
    }
    mutate {
      add_field => { "token" => "yourAccountToken" }
    }
}

output {
  tcp {
    host => "listener.logz.io"
    port => 5050
    codec => json_lines
    }
}
Your Logz.io account token can be retrieved from the General settings page in Logz.io (click the cogwheel at the top-right corner).
Save the file.
Starting the pipeline
Start Logstash:
sudo service logstash start
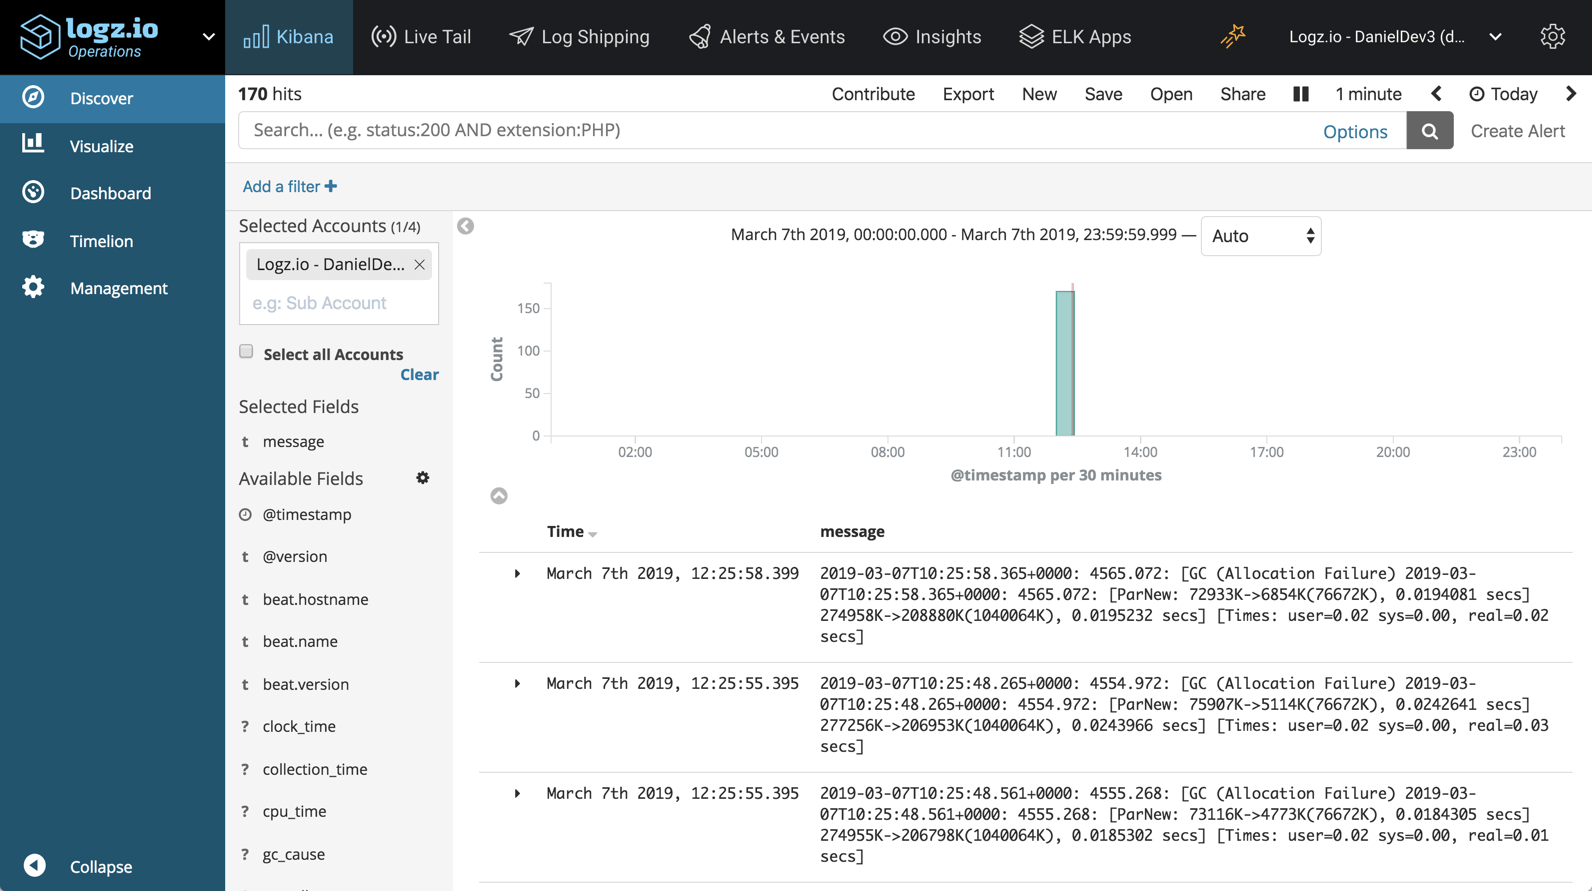
You should begin to see your Garbage Collection logs appearing in Logz.io after a minute or two:
Analyzing the garbage collection logs
Shipping the Garbage Collection logs to the ELK Stack or Logz.io, you’ll be able to use all the analytics tools Kibana has to offer. Most of the fields that we parsed in the logs are numerical fields that we can use to creating visualizations.
Here are a few examples.
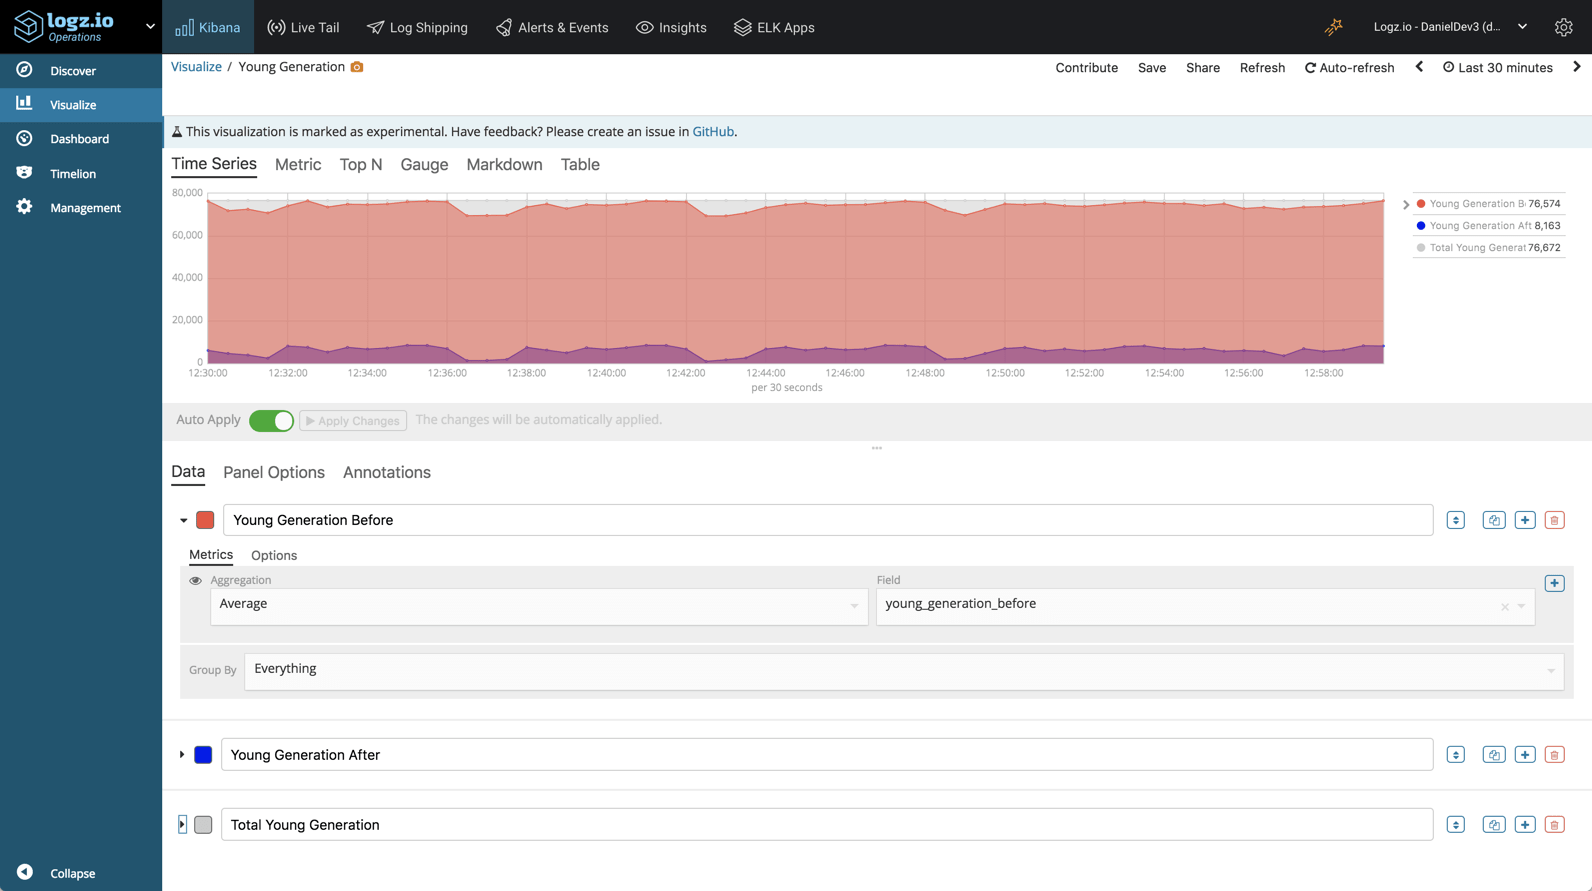
Young generation space
Using the Visual Builder in Kibana, we can monitor the average size of the young generation – before and after garbage collection.
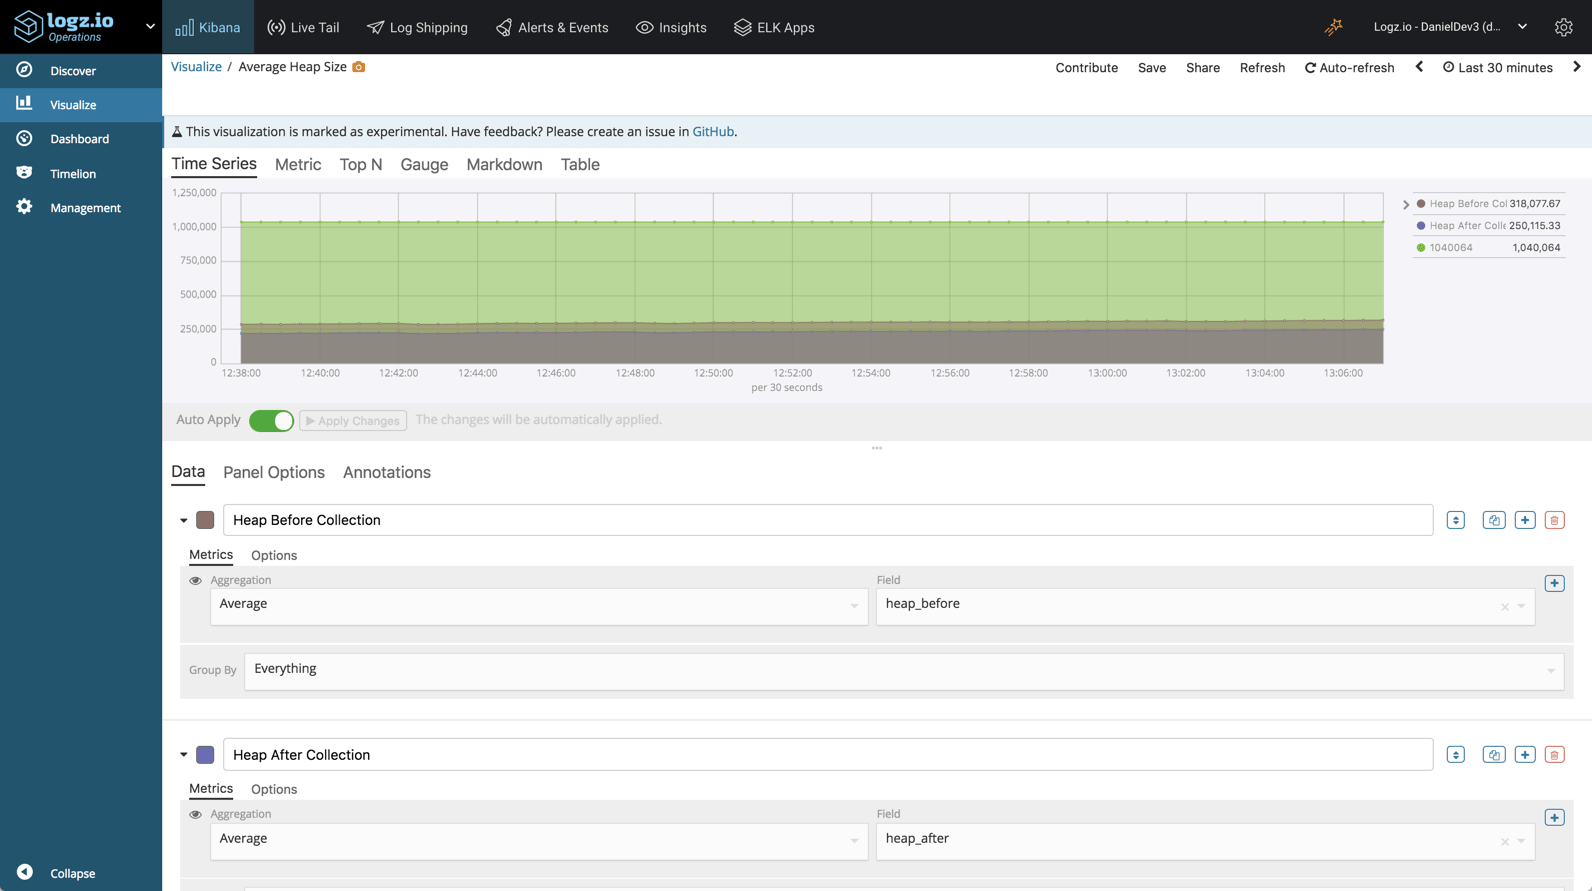
Heap size
In a similar way, we can monitor the heap size, before and after garbage collection:
Endnotes
Monitoring Java Garbage Collection logs can come in handy when troubleshooting application performance issues. The problem is that these logs are somewhat difficult to understand and analyze. The benefit of shipping these logs to the ELK Stack lies in the ability to apply processing to the logs and subsequently use Kibana to slice and dice them.
As explained, Java Garbage Collection logs can come in different colors and shapes and so it’s not always easy to configure the processing of these logs in Logstash and later create visualizations. Still, this article should provide a solid basis from which to explore the art of analyzing this data in Kibana.

You Might Also Like

Beginner’s Guide to Prometheus Metrics

