
Jenkins Log Analysis with the ELK Stack
December 27, 2017

Jenkins is one of the most widely-used open-source continuous integration tools, and is used by us here at Logz.io to run tests, create Docker containers, build code, and push it to staging and production.
Jenkins provides various ways of keeping track of the system, with two main categories of logs: system logs and build logs. While useful for monitoring Jenkins tasks and jobs, build logs can be extremely verbose. Not only that, Jenkins provides some pretty useful in-console capabilities for keeping track of your builds using these logs.
To make the most of the Jenkins system logs on the other hand, especially if you have a few Jenkins servers running, setting up centralized logging can be useful to monitor the general health of your Jenkins setup, especially in a multi-node environment.
Setting up Jenkins
As a first step, I will describe how to install and setup a single Jenkins server. If you already have Jenkins servers running, feel free of course to skip this step.
Jenkins can be installed in a variety of different ways, depending on your operating system and environment. In this case, I’ll be installing Jenkins using Ubuntu packages.
Start by adding the repository key:
wget -q -O - https://pkg.jenkins.io/debian/jenkins-ci.org.key | sudo
apt-key add -
Next, add the package repository address to your ‘sources.list’:
echo deb https://pkg.jenkins.io/debian-stable binary/ | sudo tee
/etc/apt/sources.list.d/jenkins.list
Run update so you can use the new repository:
sudo apt-get update
To install Jenkins and its dependencies (this includes Java 8 also required for running Elasticsearch), use:
sudo apt-get install jenkins
Start the Jenkins server using:
sudo systemctl start jenkins
To open Jenkins, open your browser and enter the following URL:
http://<yourServerIP>:8080
You will then be required to enter an initial admin password available in the default installation directory. For Linux:
cat /var/lib/jenkins/secrets/initialAdminPassword
Follow the rest of the setup steps (installing plugins and creating a new admin user), and you should be all set and ready to go.
Installing Elasticsearch and Kibana
Next, we’re going to install Elasticsearch and Kibana for storing and analyzing our Jenkins system logs.
Start by downloading and installing the Elastic public signing key:
wget -qO - https://artifacts.elastic.co/GPG-KEY-elasticsearch | sudo apt-key
add -
Add the repository definition:
echo "deb https://artifacts.elastic.co/packages/6.x/apt stable main" | sudo
tee -a /etc/apt/sources.list.d/elastic-6.x.list
Update the system, and install Elasticsearch:
sudo apt-get update && sudo apt-get install elasticsearch
Run Elasticsearch using:
sudo service elasticsearch start
You can make sure Elasticsearch is running using the following cURL:
curl “http://localhost:9200”
You should be seeing an output similar to this:
{


  "name" : "iDluzaS",
  "cluster_name" : "elasticsearch",
  "cluster_uuid" : "TBIkNYN9T9WbYuP68dyL4g",
# Kibana is served by a back end server. This setting specifies the port to use.
  "version" : {
    "number" : "6.0.0",
    "build_hash" : "8f0685b",
    "build_date" : "2017-11-10T18:41:22.859Z",
    "build_snapshot" : false,
    "lucene_version" : "7.0.1",
    "minimum_wire_compatibility_version" : "5.6.0",
    "minimum_index_compatibility_version" : "5.0.0"
  },
  "tagline" : "You Know, for Search"
}
Next up, we’re going to install Kibana with:
$ sudo apt-get install kibana
Open up the Kibana configuration file at: /etc/kibana/kibana.yml, and make sure you have the following configuration defined:
server.port: 5601
elasticsearch.url: "http://localhost:9200"
And, start Kibana with:
$ sudo service kibana start
Open up Kibana in your browser with: http://<yourServerIP>:5601

Installing and configuring Filebeat
In Linux, Jenkins system logs are pushed in text format to /var/log/jenkins/jenkins.log. The simplest way in our case of shipping these logs into Elasticsearch is therefore Filebeat.
To install Filebeat, use:
sudo apt install filebeat
Next, open up the Filebeat configuration file at: /etc/filebeat/filebeat.yml:
sudo vim /etc/filebeat/filebeat.yml
Since Jenkins system logs include messages that span multiple lines of text, your configuration needs to include multi-line configurations to inform Filebeat how to combine lines together.
To ship your Jenkins system logs to a local Elasticsearch instance, the configuration would look something like this:
filebeat.prospectors:
- type: log
  enabled: true
  paths:
  - /var/log/jenkins/jenkins.log
  multiline.pattern: '^[A-Z]{1}[a-z]{2} {1,2}[0-9]{1,2}, [0-9]{4} {1,2}[0-9]{1,2}:[0-9]{2}:[0-9]{2}'
  multiline.negate: true
  multiline.match: after

output.elasticsearch:
  hosts: ["localhost:9200"]
Start Filebeat with:
sudo service filebeat start
After a while, a new index will be created and you can define a new index pattern (filebeat-*) in Kibana to begin analyzing the data.

Note, that you might want to use more granular parsing. In that case, you would need to ship the logs to Logstash for further processing.
Shipping to Logz.io
Logz.io supports automatic parsing for Jenkins system logs, and making a few small changes to the Filebeat configuration will make sure the logs are sent to your Logz.io account.
First, you will need to download an SSL certificate to use encryption:
wget https://raw.githubusercontent.com/logzio/public-certificates/master/
COMODORSADomainValidationSecureServerCA.crt

sudo mkdir -p /etc/pki/tls/certs

sudo cp COMODORSADomainValidationSecureServerCA.crt
/etc/pki/tls/certs/
If you like, you can make use of the Logz.io Filebeat wizard to generate the FIlebeat YAML file automatically (available in the Filebeat section, under Log Shipping in the UI).
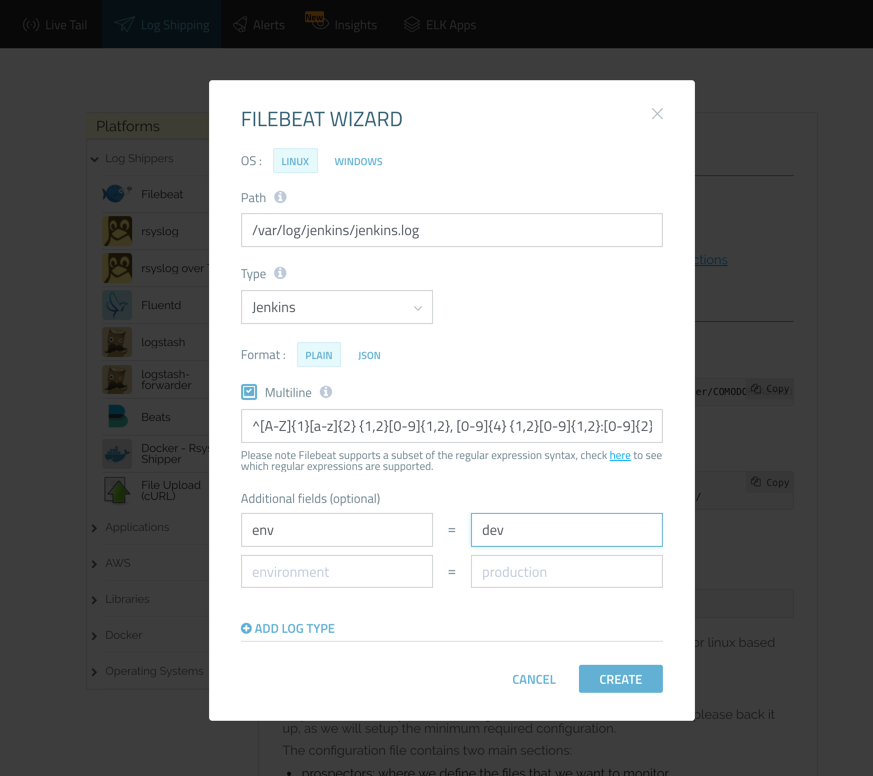
Either way, the configuration file should look as follows:
filebeat:
  prospectors:
    -
      paths:
        - /var/log/jenkins/jenkins.log
      fields:
        logzio_codec: plain
        token: <yourAccessToken>
        type: jenkins
        env: dev
      fields_under_root: true
      encoding: utf-8
      ignore_older: 3h
      multiline:
        pattern: '^[A-Z]{1}[a-z]{2} {1,2}[0-9]{1,2}, [0-9]{4} {1,2}[0-9]{1,2}:[0-9]{2}:[0-9]{2}'
        negate: true
        match: after
  registry_file: /var/lib/filebeat/registry

output:
  logstash:
    hosts: ["listener.logz.io:5015"]

    ssl:
      certificate_authorities: ['/etc/pki/tls/certs/COMODORSADomainValidationSecureServerCA.crt']
Note, if you are not using the wizard to configure Filebeat, your access token can be retrieved from the Settings page in Logz.io.
Once you start/restart Filebeat, you should begin to see your Jenkins logs appearing in Logz.io. Parsing for the logs will be done automatically as long as you defined the type as jenkins.
Analyzing Jenkins logs in Logz.io
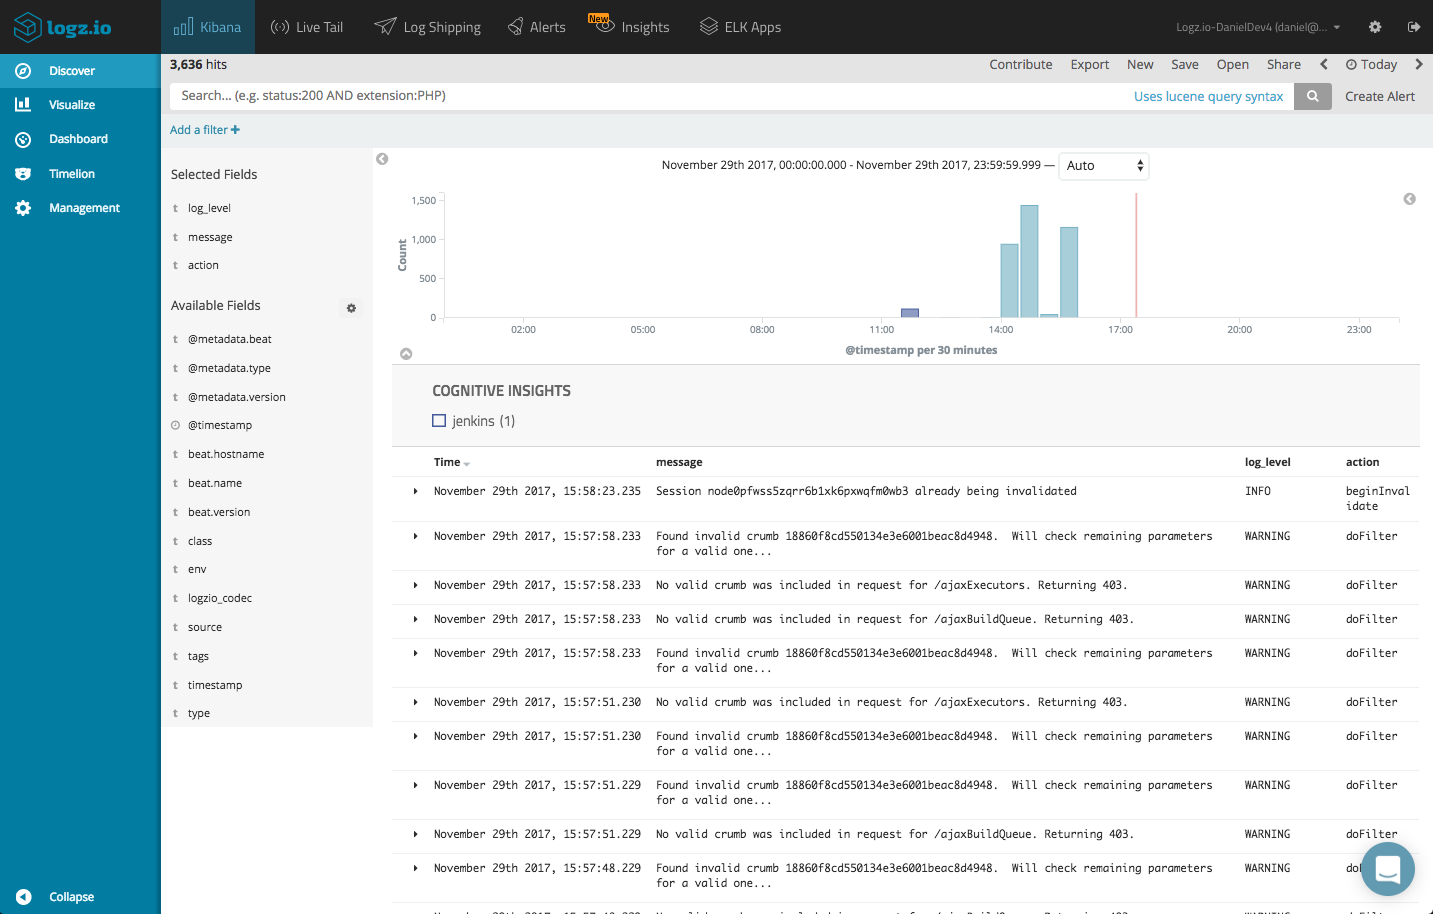
Now that your logging pipeline is up and running, it’s time to look into the data with some simple analysis operations in Kibana.
Some of the fields can be used to get some visibility into the logs. Adding, for example, the ‘log-level’ and ‘action’ fields helps give the logs some context.
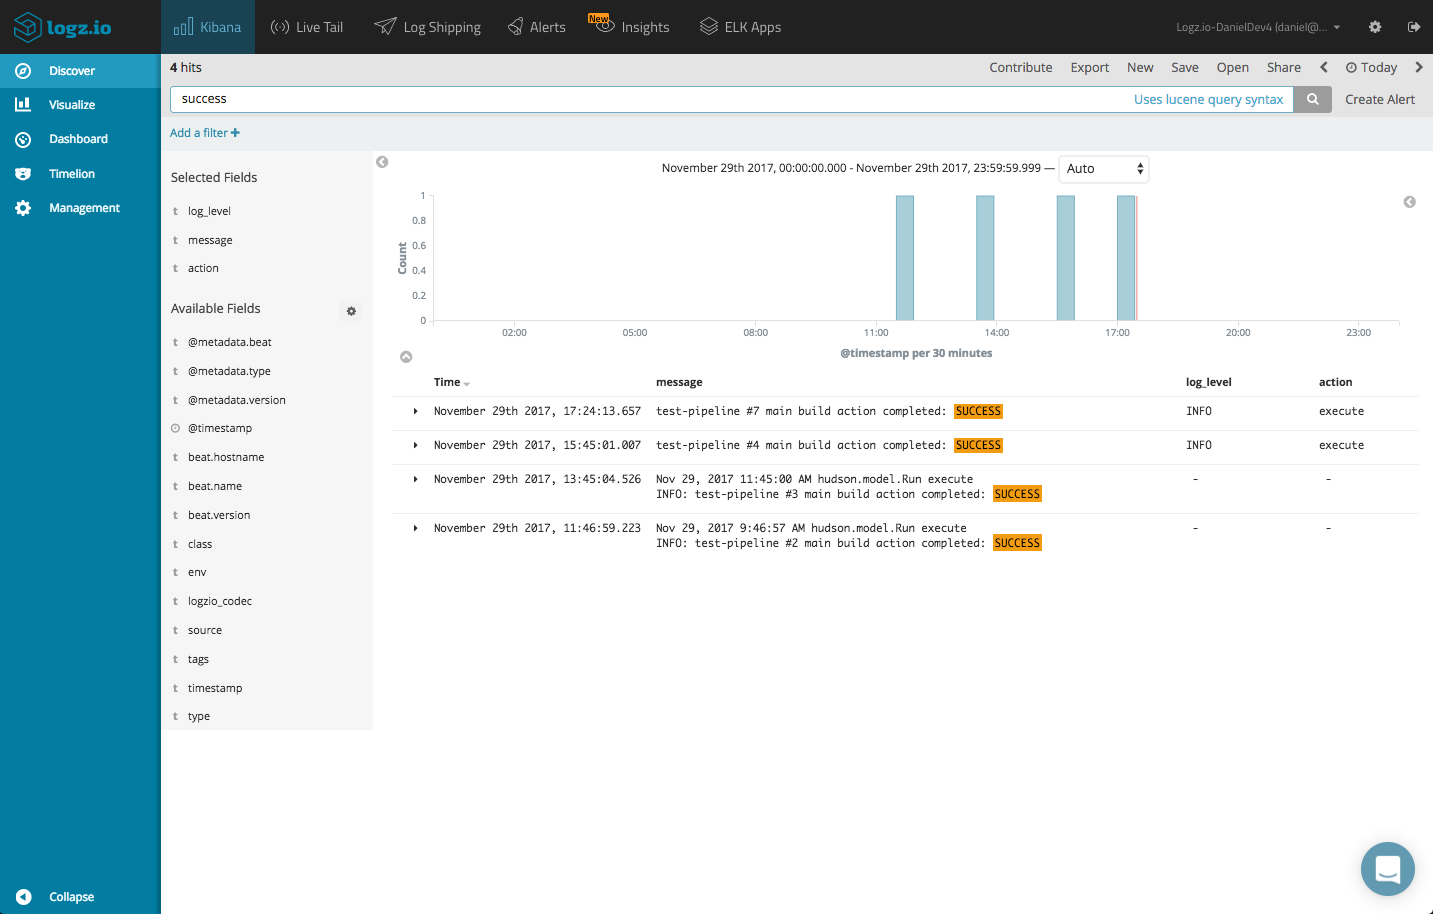
We can use some queries to look for specific log data, say successful builds. Successful builds contain “success” in their logs, while failed builds contain “failure”:
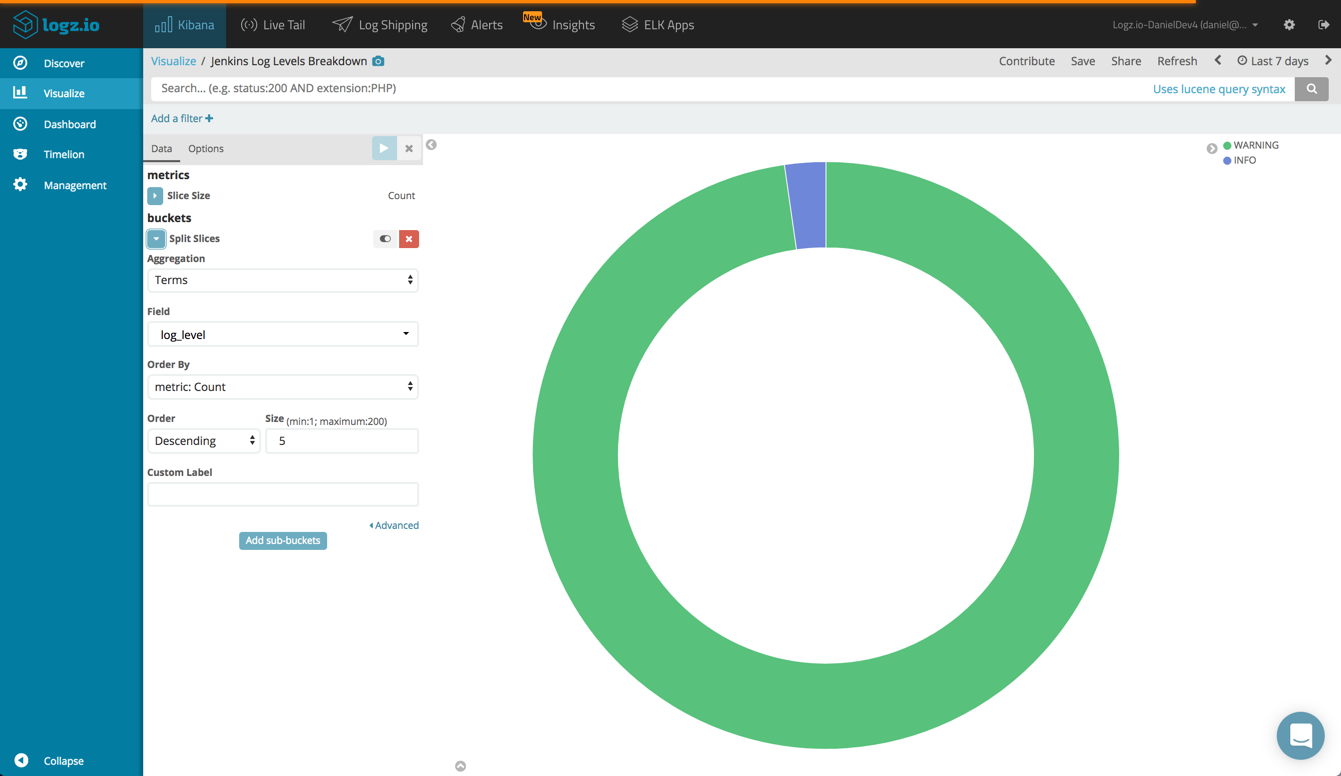
Using Kibana’s visualization capabilities, you can create a series of simple charts and metric visualizations for giving you a nice overview of your Jenkins setup.
For example, you can create a pie chart displaying a breakdown of the different log levels being reported.
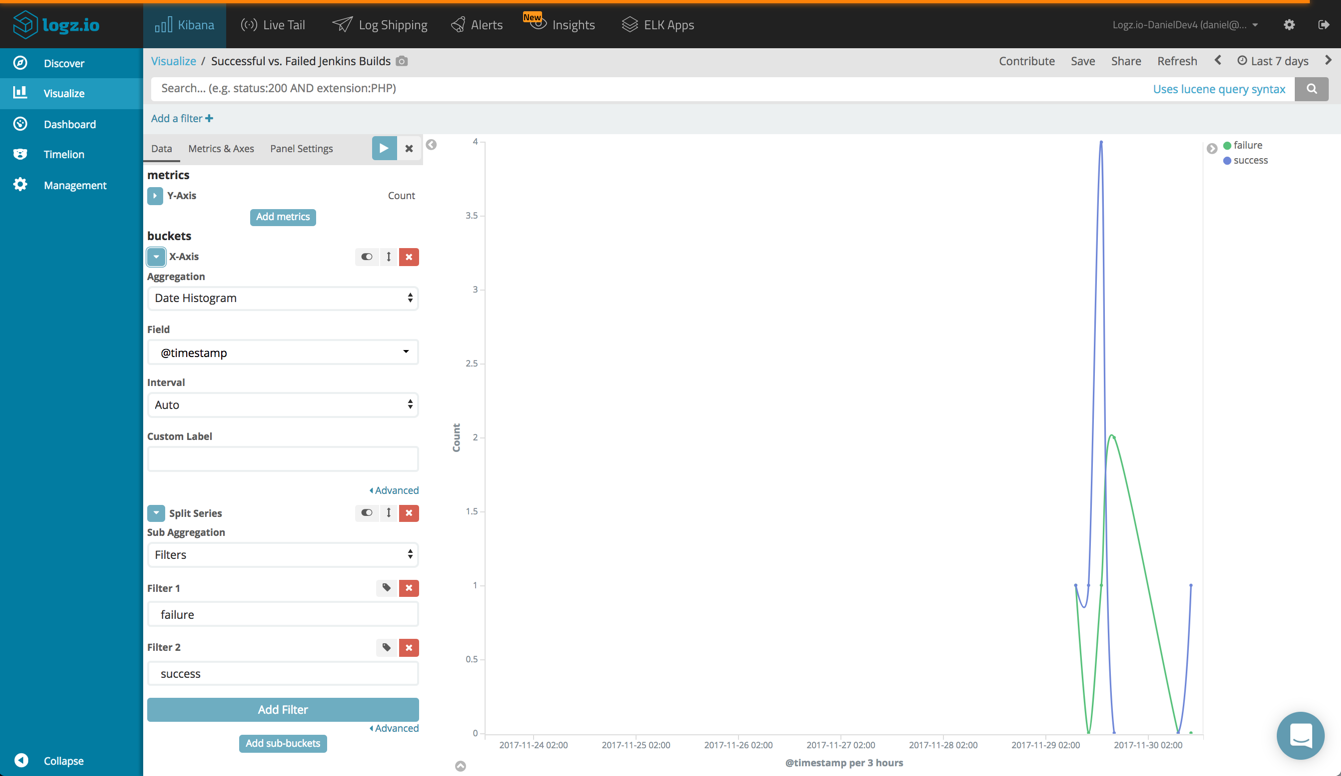
Or, you can create a line chart showing failed and successful build over time.
Once you’ve got your visualizations lined up, you can add them into one comprehensive dashboard.
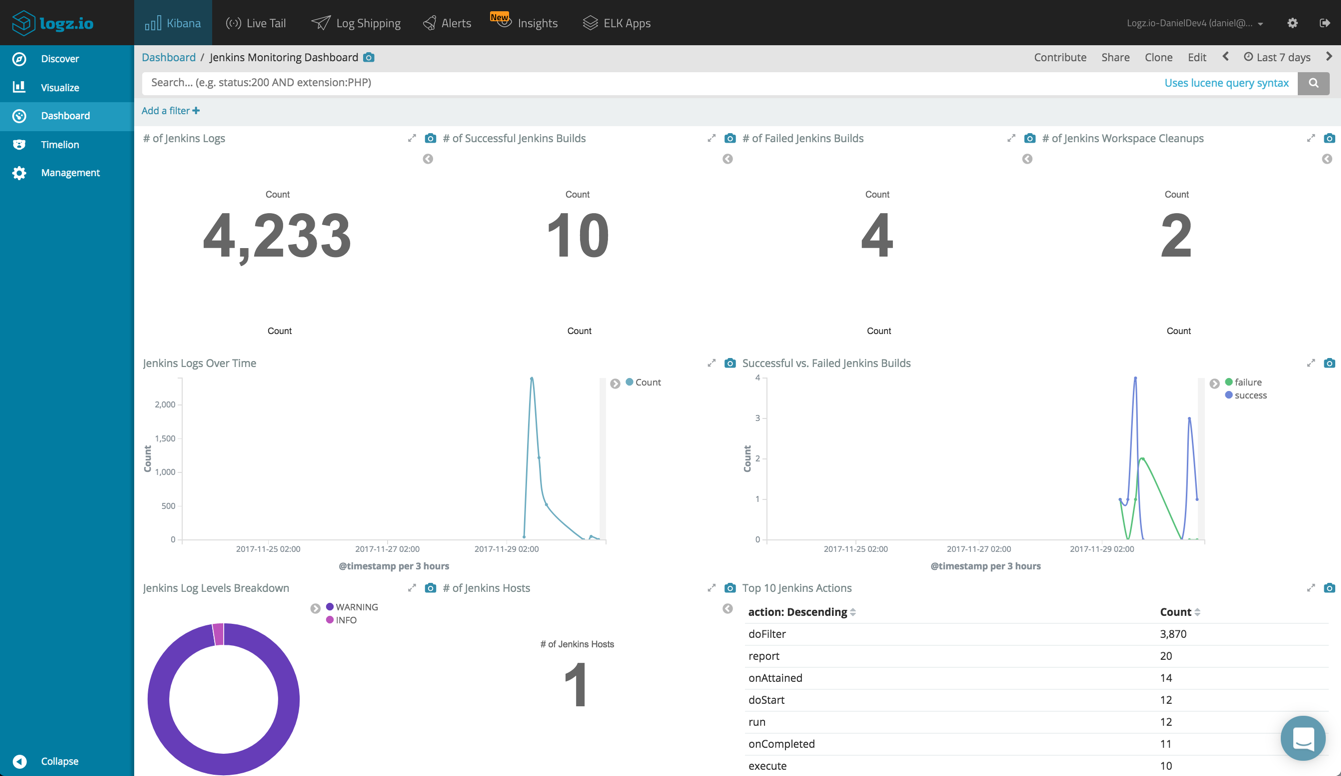
This dashboard is available in Logz.io’s dashboard and visualization library, ELK Apps. So if you’re shipping logs with the ‘jenkins’ log type, you can hit the ground running by installing this dashboard instead of building your own from scratch.
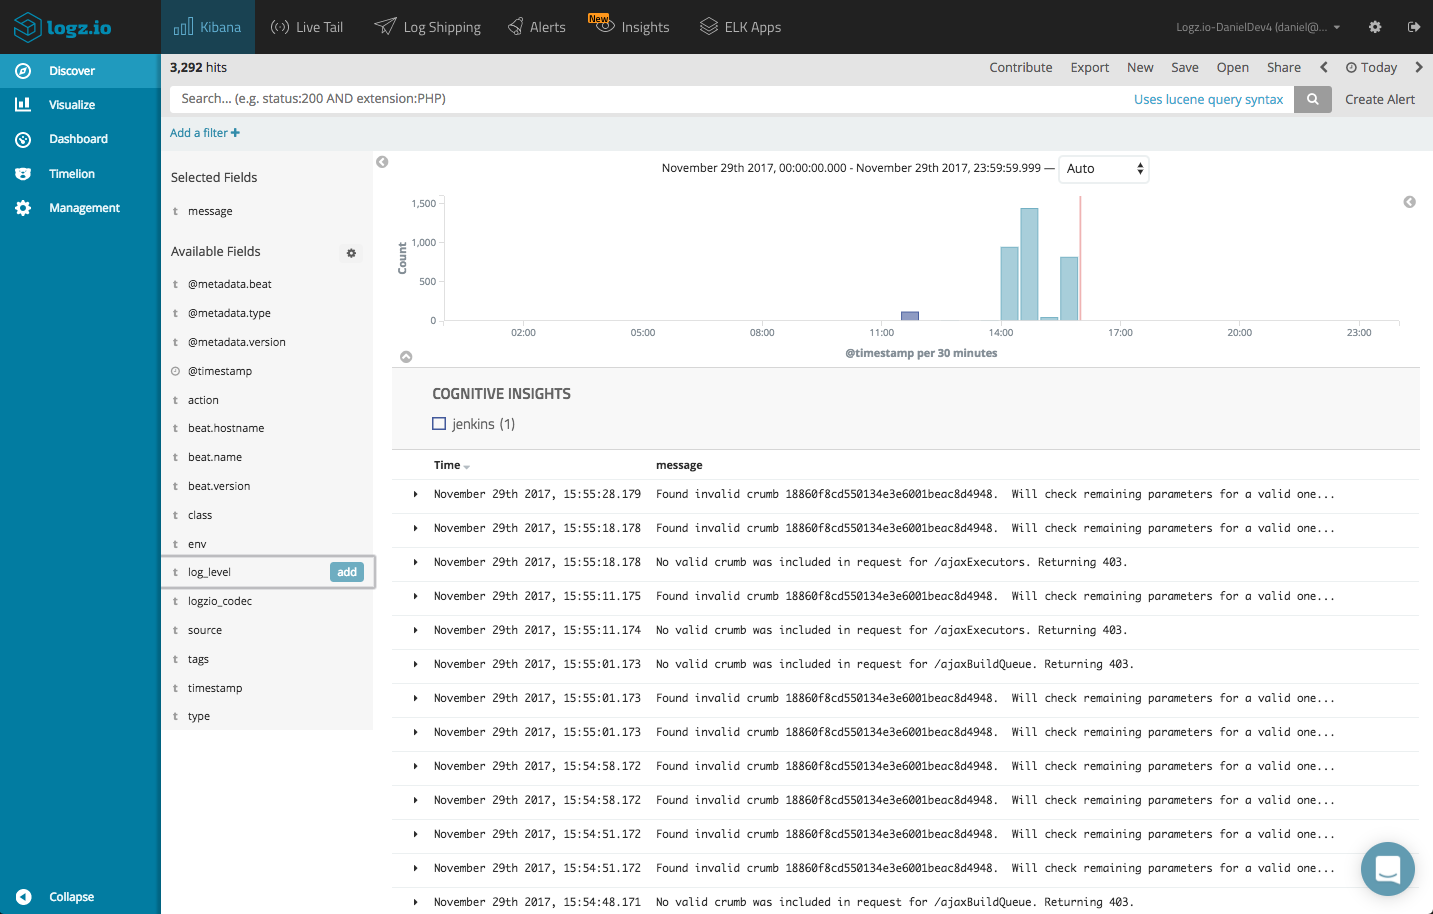
Monitoring Jenkins with machine learning
Logz.io’s Cognitive Insights helps users identify hidden issues within their log data. Using machine learning, Logz.io sifts through your log data and identifies specific log messages that could potentially have a critical impact.
These events are revealed both in the Discover tab in Kibana and the new Insights page in Logz.io. Opening the log message, you can see a list of resources on the web discussing this specific event.
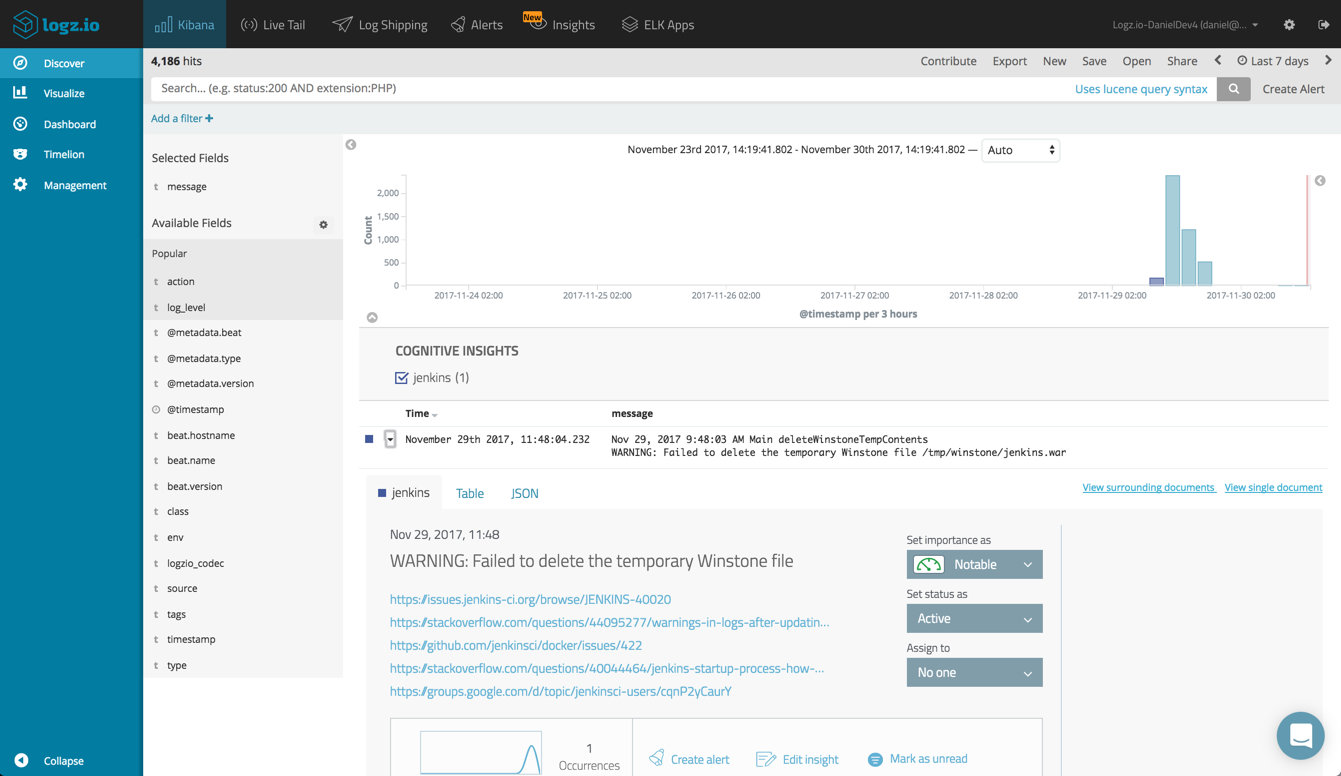
In this case, the “WARNING: Failed to delete the temporary Winstone file” event turned out as being related to a non-critical startup error. You can dismiss the event, assign it to a team member or create an alert to get notified the next time it occurs.
Endnotes
In a few simple steps, you can set up a logging pipeline for monitoring a Jenkins setup. While Jenkins provides in-console capabilities for logging, if you’re running a multi-node environment, you will probably need a more efficient method for aggregating and analyzing the logs.More on the subject:
Whether you chose to use your own ELK deployment or Logz.io, the combination of Filebeat, Elasticsearch and Kibana provide a powerful and easy-to-implement solution.
In a follow-up post, I will explore logging Jenkins build logs.
Enjoy!

You Might Also Like

Observability Into Your Containerized Workloads with AWS and Logz.io

