
Top 13 Open Source Monitoring Tools for Kubernetes
October 4, 2019

With over 58K stars on GitHub and over 2,200 contributors across the globe, Kubernetes is the de facto standard for container orchestration. While solving some of the key challenges involved in running distributed microservices, it has also introduced some new ones.
Not surprisingly, when asked, engineers list monitoring as one of the main obstacles for adopting Kubernetes. After all, monitoring distributed environments has never been easy and Kubernetes adds additional complexity. What isn’t surprising as well is the development of various open source monitoring tools for Kubernetes to help overcome the challenge.
These tools tackle different aspects of the challenge. Some help with logs, others with metrics. Some are data collectors while others provide an interface for operating Kubernetes from a birdseye view. Open source Kubernetes monitoring stacks rarely look identical – how you want to construct it depends on your priorities.
This variety and depth attest to the strength of Kubernetes as an ecosystem and community, and in this article, we’ll take a look at some of the more popular open source tools available for Kubernetes monitoring.
For those who are interested in these technologies, but don’t want to manage the many components of the monitoring data pipeline themselves, we’ll also review Logz.io, which unifies the most popular open source monitoring tools for Kubernetes onto a single SaaS platform. Learn about the way Logz.io unifies and enhances the leading open source observability technologies here. More on the subject:
1. Prometheus
There is a long list of open source time-series databases in the market today — Graphite, InfluxDB, Cassandra, for example, but none are as popular among Kubernetes users as Prometheus is. Initially a SoundCloud project and now part of CNCF (Cloud Native Computing Foundation), Prometheus has emerged as the de-facto open source standard for monitoring Kubernetes.
In a nutshell, what makes Prometheus stand out among other time-series databases, is its multi-dimensional data model, PromQL (the Prometheus querying language), built-in alerting mechanisms, a pull vs. push model, and of course, the ever-growing community. These differentiators make Prometheus a great solution for Kubernetes users, and the two projects are now closely integrated — users can easily run Prometheus on top of Kubernetes using the Prometheus Operator.
Pros: Kubernetes-native, simple to use, huge community
Cons: Challenges at scale, storage
2. Grafana
For slicing and dicing Kubernetes metrics and constructing beautiful monitoring dashboards, Grafana is second to none. When used to monitor Kubernetes, Grafana will usually sit on top of Prometheus, although Grafana together with InfluxDB or Graphite are also common setups.
There are a number of reasons Grafana is so popular, its ability to integrate with a long list of data sources being one of them. Grafana is extremely robust, featuring a long list of capabilities such as alerts, annotations, filtering, data source-specific querying, visualization and dashboarding, authentication/authorization, cross-organizational collaboration, and plenty more.
Grafana is also super easy to set up on Kubernetes — there are numerous deployment specifications that include a Grafana container by default and there are plenty of Kubernetes monitoring dashboards for Grafana available for use.
Pros: Large ecosystem, rich visualization capabilities, alerting
Cons: Not optimized for Kubernetes log management
3. The ELK Stack (no longer open source)
For logging Kubernetes, one of the most popular monitoring tools is, of course, the ELK Stack. Unfortunately, it is no longer technically open source, ever since Elastic decided to replace the open source Apache 2.0 license with dual proprietary licenses. Luckily, AWS has stepped in to launch OpenSearch (next section) – a forked ELK Stack maintained by AWS and under the Apache 2.0 license.
An acronym for Elasticsearch, Logstash and Kibana, ELK also includes a fourth component — Beats, which are lightweight data shippers. Each component in the stack takes care of a different step in the logging pipeline, and together, they all provide a comprehensive and powerful logging solution for Kubernetes.
Logstash is capable of aggregating and processing logs before sending them on for storage. Although nowadays, its usually replaced by lightweight data collectors like Fluentd (coming later). Elasticsearch was designed to be scalable, and will perform well even when storing and searching across millions of documents. Kibana does a great job of providing users with the analysis interface needed to make sense of the data.
All the different components of the stack can be deployed easily into a Kubernetes environment. You can run the components as pods using various deployment configurations or using helm charts. Both Metricbeat and Filebeat can be deployed as daemonsets and will append Kubernetes metadata to the documents.
Pros: Huge community, easy to deploy and use in Kubernetes, rich analysis capabilities
Cons: Difficult to maintain at scale
4. OpenSearch and OpenSearch Dashboards
As mentioned in the previous section, AWS forked Elasticsearch and Kibana, respectively, to create OpenSearch and OpenSearch Dashboards once Elastic decided to close source the ELK Stack.
Since then, OpenSearch and OpenSearch Dashboards have developed a strong open source user base and are widely used open source tools for Kubernetes monitoring. While the ELK Stack and OpenSearch Stack are still relatively similar, there are a number of features available for free with OpenSearch, that are only available in the premium (paid) version of the ELK Stack, including:
- ML Commons makes it easy to add machine learning features. ML tools are premium features in Elasticsearch.
- OpenSearch includes access controls for centralized management. This is a premium feature in Elasticsearch.
- OpenSearch has a full suite of security features, including encryption, authentication, access control, and audit logging and compliance. These are premium features in Elasticsearch.
The ELK and OpenSearch stacks both share similar elasticity qualities that make it ideal for Kubernetes monitoring.
Despite these OpenSearch advantages, it still has the same challenges as the ELK Stack.
As data volumes grow, you’ll likely need to add a queuing system like Kafka to buffer the data. As your stack ages, you may need to upgrade the components. You’ll need to monitor and troubleshoot the data pipeline…and the list of maintenance tasks continues.
To solve this challenge, there are products like AWS OpenSearch Service, Logz.io Log Management, and Aiven’s OpenSearch Service. These logging-as-a-service solutions manage the data infrastructure for you, so that you can focus on other tasks.
Logz.io also builds analytics on top of OpenSearch Dashboards, like K8s 360, which centralizes log, metric, and trace data for a single place to monitor Kubernetes.
Pros: Extra security and analysis features not available with ELK
Cons: Like ELK, it can be time consuming to manage at scale
5. OpenTelemetry
The first step to gaining observability is to instrument your services, the the most promising and exciting open source technology to do so is OpenTelemetry – a unified set of frameworks, libraries, and collectors designed to generate and collect traces, metrics, and eventually, logs.
OpenTelemetry fills a critical gap in the observability space by offering a vendor-agnostic way to instrument services, which generate data that can be stored in most observability back ends, like OpenSearch or Prometheus. Since instrumenting services can be time-consuming, OpenTelemetry promises to limit the work as you migrate across different APM or observability solutions.
OpenTelemetry is a CNCF hosted open source project purpose built for cloud-native applications running on Kubernetes.
Even with automatic instrumentation, instrumenting your services with OpenTelemetry is not always trivial. If you’re looking for an exceptionally easy way to configure and deploy OpenTelemetry , check out Logz.io’s Telemetry Collector – which unifies log, metric, and trace collection with an agent based on OpenTelemetry and Fluentd.
Pros: Vendor agnostic instrumentation, robust ecosystem of integrations
Cons: Difficult to implement
6. Fluentd/Fluent Bit
For log aggregation and processing, another popular solution used by Kubernetes users is Fluentd. Written in Ruby, Fluentd was created to act as a unified logging layer — a one stop component that can aggregate data from multiple sources, unify the differently formatted data into JSON objects, and route it to different output destinations. Fluentd is so widely used that the ELK acronym has been replaced by a new acronym – the EFK Stack.
Fluentd owes its popularity among Kubernetes users to Logstash’s fallacies, especially those performance-related. Design-wise — performance, scalability and reliability are some of Fluentd’s more outstanding features. Adding new inputs or outputs is relatively simple and has little effect on performance. Fluentd uses disk or memory for buffering and queuing to handle transmission failures or data overload and supports multiple configuration options to ensure a more resilient data pipeline.
A more recent spin-off project is Fluent Bit. Similar to ELK’s beats, Fluent Bit is an extremely lightweight data shipper that excels as acting as an agent on edge-hosts, collecting and pushing data down the pipelines. In a Kubernetes cluster, Fluent Bit can be an excellent alternative to Fluentd if you’re limited for CPU and RAM capacity.
Both Fluentd and Fluent Bit are also CNCF projects and Kubernetes-native — they are designed to seamlessly integrate with Kubernetes, enrich data with relevant pod and container metadata, and as mentioned — all this with a low resource footprint.
Pros: Huge plugin ecosystem, performance, reliability
Cons: Difficult to configure
7. Jaeger
Distributed tracing is gradually becoming a monitoring and troubleshooting best practice for Kubernetes environments. Among the various open source tracing tools available, Jaeger seems to be leading the pack.
Developed by Uber and open sourced in 2016, Jaeger was actually inspired by other existing tracing tools, Zipkin and Dapper, enabling users to perform root cause analysis, performance optimization and distributed transaction monitoring.
Jaeger features OpenTelemetry-based instrumentation for Go, Java, Node, Ruby, Python and C++ apps, uses consistent upfront sampling with individual per service/endpoint probabilities, and supports multiple storage backends — Cassandra, Elasticsearch, Kafka and memory.
There are multiple ways of getting started with Jaeger on Kubernetes. Users can either use the new Jaeger Operator or, if they prefer, a daemonset configuration. There is also an all-in-one deployment available for testing and demoing purposes.
Pros: User interface, various instrumentation options, easy to deploy
Cons: Limited backend integration
8. cAdvisor
cAdvisor is an open source agent designed for collecting, processing, and exporting resource usage and performance information about running containers. It’s also built into Kubernetes and integrated into the Kubelet binary.
Unlike other agents, cAdvisor is not deployed per pod but on the node level. It will auto-discover all the containers running on a machine and collects system metrics such as memory, CPU, network, etc.
cAdvisor is one of the more basic open source, Kubernetes-native monitoring tools out there. It’s easy to use (it exposes Prometheus metrics out-of-the-box) but definitely not robust enough to be considered an all-around monitoring solution.
Pros: Built into Kubernetes, easy to use
Cons: Basic, lacks analytical depth, limited functionality
9. kubewatch
As the name implies, kubewatch watches for specific Kubernetes events and pushes notifications on these events to various endpoints such as Slack and PagerDuty. More specifically, kubewatch will look for changes made to specific Kubernetes resources that you ask it to watch — daemon sets, deployments, pods, replica sets, replication controllers, services, secrets, and configuration maps. kubewatch is easy to configure and can be deployed using either helm or a custom deployment.
Pros: Supports multiple endpoints, easy to deploy
Cons: Just a watcher
10. kube-ops-view
Official documentation for this project clearly states that kube-ops-view is not a monitoring tool per se, so why is it listed here? Well, while it can’t be used to monitor and alert on production issues, it can give you a nice operational picture of your Kubernetes clusters — the different nodes deployed and their status, as well as the different pods running on the nodes.. That’s what it was built for, and only that.

Source: GitHub.
Pros: Simple to use, easy to deploy
Cons: Read-only tool, not for managing Kubernetes resources
11. kube-state-metrics
This Kubernetes-native metrics service was designed to listen to the Kubernetes API and generate metrics on the state of various objects such as pod, service, deployment, node, etc. A full list of the metrics generated by kube-state-metrics can be found here.
Extremely easy to use, kube-state-metrics is only a metrics service and as such requires a few more bit and pieces to become part of a complete monitoring solution for Kubernetes. kube-state-metrics exports the metrics on the HTTP endpoint /metrics in plaintext format. Those using Prometheus will be happy to learn that the metrics were designed to be easily consumed/scraped.
Pros: Simple to use, Kubernetes-native, integrates seamlessly with Prometheus
Cons: Only an agent for generating metrics
12. Weave Scope
Last but not least, Weave Scope is a monitoring tool developed by the folks at Weaveworks that allows you to gain operational insights into your Kubernetes cluster.
This might sound a bit like kube-ops-view, but Weave Scope takes it up a few notches by providing a much nicer user interface, but more importantly, by allowing the user to manage containers and run diagnostic commands on them from within this interface.
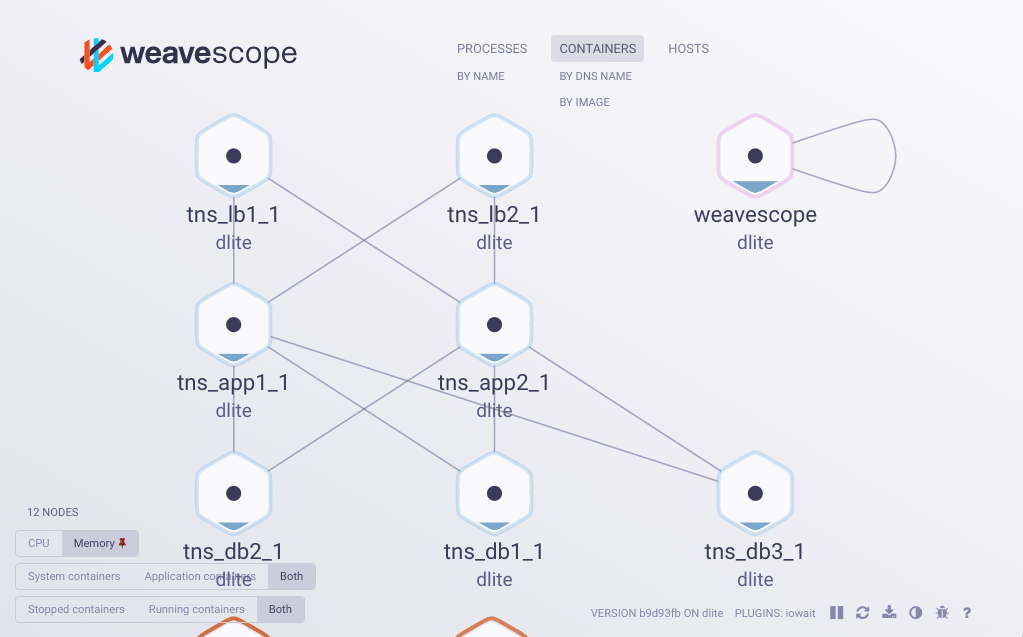
Image: GitHub.
It’s an effective tool for gaining context on your deployment. You’ll be able to see the application, the infrastructure it’s deployed on, and the different connections between the different components.
Pros: User interface, zero-configuration
Cons: Lacks analytical depth
13. Prometheus Operator
Developed by CoreOS, Prometheus Operator is a beta project that covers and monitors the deployment specifically of Prometheus clusters over Kubernetes. The project’s big differentiator is making the Prometheus configuration Kubernetes-native. They also have a community Helm chart for prometheus-operator. Version 0.18 requires at least Kubernetes 1.8.0 to run.
Logz.io
Logz.io can’t officially be apart of the list because it isn’t open source, but it unifies and enhances these open source Kubernetes monitoring technologies to provide a single view of Kubernetes observability (and yes, we actively contribute back to these open source communities).
For those who want to embrace leading open source observability tools without having to manage and scale the infrastructure themselves, Logz.io can offer a lifeline with its open source observability platform – which also adds features like RBAC, data correlation, data filtering, and other capabilities on top of the open source.
Endnotes
This was of course just a partial list of the open source tools available for monitoring Kubernetes, but if you’re just beginning to design your observability stack for Kubernetes, it’s a good place to start.
With the exception of OpenTelemetry and Jaeger, all the other tools should begin providing value without extra instrumentation or too much configuration. All of these tools are easy to test and deploy — set up a small sandbox environment, start small, and try and understand whether these tools are what you need.
Kubernetes is extremely community-driven. The super-active community contributing to the project continues to add and improve built-in and add-on monitoring capabilities and I have little doubt the near future will see some additional developments. We’ll cover these as they are introduced.
For now, the open source ecosystem is a great bet for your Kubernetes monitoring requirements.

You Might Also Like

Tool Consolidation Is Dead. Long Live Agentic AI.

