
Deploying the ELK Stack on Kubernetes with Helm
October 2, 2019
Helm and Kubernetes are quick becoming a standard pairing. ELK and Kubernetes are used in the same sentence usually in the context of describing a monitoring stack. ELK integrates natively with Kubernetes and is a popular open-source solution for collecting, storing and analyzing Kubernetes telemetry data. However, ELK and Kubernetes are increasingly being used in another context—a method for deploying and managing the former. While deploying the ELK Stack using Kubernetes might seem like a complex task, there are more and more best practices around this scenario as well as Kubernetes-native solutions. One of these solutions is using Helm charts.
More on the subject:
What’s Helm?
Maintained by CNCF, Helm is increasingly becoming a standard way for managing applications on Kubernetes. The easiest way to think about Helm is as a package manager for Kubernetes. It’s actually a bit more than just a package manager though as it allows users to create, publish and share applications on Kubernetes.
Each Helm chart contains all the specifications needed to be deployed on Kubernetes in the form of files describing a set of Kubernetes resources and configurations. Charts can be used to deploy very basic applications but also more complex systems such as…the ELK Stack!
Earlier this year, the folks at Elastic published Helm charts for Elasticsearch, Kibana, Filebeat and Metricbeat, making the deployment of these components on Kubernetes extremely simple.
Let’s take a closer look.

Setup
For the sake of this tutorial, I used Minikube installed on my Mac. You’ll also need Kubectl set up and configured.
Step 1: Setting Up Kubernetes for ELK Stack
Obviously, we first need to make sure we have a Kubernetes cluster to install the ELK Stack on.
When starting Minikube, you’ll need to allocate some extra firepower as the plan is to deploy a multi-node Elasticsearch cluster:
minikube start --cpus 4 --memory 8192
You should see output similar to this:
Starting local Kubernetes v1.10.0 cluster...
Starting VM...
Getting VM IP address...
Moving files into cluster...
Setting up certs...
Connecting to cluster...
Setting up kubeconfig...
Starting cluster components...
Kubectl is now configured to use the cluster.
Just to verify your single-node Kubernetes cluster is up and running, use:
kubectl cluster-info

Kubernetes master is running at https://192.168.99.106:8443
KubeDNS is running at https://192.168.99.106:8443/api/v1/namespaces/kube-system/services/kube-dns:dns/proxy
Step 2: Installing Helm on Kubernetes
Your next step is to install Helm. Again, if you’ve got Helm setup and initialized already, great, you can skip to deploying the ELK Stack in the following steps.
To install Helm. execute the following 3 commands:
curl https://raw.githubusercontent.com/kubernetes/Helm/master/scripts/get > get_Helm.sh
chmod 700 get_Helm.sh
./get_Helm.sh
You should see the following output:
Downloading https://get.Helm.sh/Helm-v2.14.3-darwin-amd64.tar.gz
Preparing to install Helm and tiller into /usr/local/bin
Helm installed into /usr/local/bin/Helm
tiller installed into /usr/local/bin/tiller
Run 'Helm init' to configure Helm.
To start Helm, enter:
Helm init
To verify the Tiller server is running properly, use:
kubectl get pods -n kube-system | grep tiller
And the output:
tiller-deploy-77b79fcbfc-hmqj8 1/1 Running 0 50s
Step 3: Deploying an Elasticsearch Cluster with Helm
It’s time to start deploying the different components of the ELK Stack. Let’s start with Elasticsearch.
As mentioned above, we’ll be using Elastic’s Helm repository so let’s start with adding it:
Helm repo add elastic https://Helm.elastic.co
"elastic" has been added to your repositories
Next, download the Helm configuration for installing a multi-node Elasticsearch cluster on Minikube:
curl -O https://raw.githubusercontent.com/elastic/Helm-charts/master/elasticsearch/examples/minikube/values.yaml
Install the Elasticsearch Helm chart using the configuration you just downloaded:
Helm install --name elasticsearch elastic/elasticsearch -f ./values.yaml
The output you should be seeing looks something like this:
NAME:   elasticsearch
LAST DEPLOYED: Mon Sep 16 17:28:20 2019
NAMESPACE: default
STATUS: DEPLOYED

RESOURCES:
==> v1/Pod(related)
NAME                    READY  STATUS   RESTARTS  AGE
elasticsearch-master-0  0/1    Pending  0         0s

==> v1/Service
NAME                           TYPE       CLUSTER-IP     EXTERNAL-IP  PORT(S)            AGE
elasticsearch-master           ClusterIP  10.101.239.94         9200/TCP,9300/TCP  0s
elasticsearch-master-headless  ClusterIP  None                  9200/TCP,9300/TCP  0s

==> v1beta1/PodDisruptionBudget
NAME                      MIN AVAILABLE  MAX UNAVAILABLE  ALLOWED DISRUPTIONS  AGE
elasticsearch-master-pdb  N/A            1                0                    0s

==> v1beta1/StatefulSet
NAME                  READY  AGE
elasticsearch-master  0/3    0s


NOTES:
1. Watch all cluster members come up.
  $ kubectl get pods --namespace=default -l app=elasticsearch-master -w
2. Test cluster health using Helm test.
  $ Helm test elasticsearch
As noted at the end of the output, you can verify your Elasticsearch pods status with:
kubectl get pods --namespace=default -l app=elasticsearch-master -w
It might take a minute or two, but eventually, three Elasticsearch pods will be shown as running:
NAME                     READY     STATUS     RESTARTS   AGE
elasticsearch-master-0   1/1       Running   0         1m
elasticsearch-master-2   1/1       Running   0         1m
elasticsearch-master-1   1/1       Running   0         1m
Our last step for deploying Elasticsearch is to set up port forwarding:
kubectl port-forward svc/elasticsearch-master 9200
Advanced Elasticsearch Configurations with Helm Charts
There is support for loadBalancerSourceRanges, which specifies exceptions of ranges of IP addresses that can access the designated load balancer. This is also available for Kibana.
Step 4: Deploying Kibana with Helm
Next up — Kibana. As before, we’re going to use Elastic’s Helm chart for Kibana:
Helm install --name kibana elastic/kibana
And the output:
NAME:   kibana
LAST DEPLOYED: Wed Sep 18 09:52:21 2019
NAMESPACE: default
STATUS: DEPLOYED

RESOURCES:
==> v1/Deployment
NAME           READY  UP-TO-DATE  AVAILABLE  AGE
kibana-kibana  0/1    1           0          0s

==> v1/Pod(related)
NAME                            READY  STATUS             RESTARTS  AGE
kibana-kibana-6d7466b9b9-fbmsz  0/1    ContainerCreating  0         0s

==> v1/Service
NAME           TYPE       CLUSTER-IP    EXTERNAL-IP  PORT(S)   AGE
kibana-kibana  ClusterIP  10.96.37.129         5601/TCP  0s
Verify your Kibana pod is running (it might take a minute or two until the status turns to “Running”):
kubectl get pods

NAME                             READY     STATUS    RESTARTS   AGE
elasticsearch-master-0           1/1       Running   0          15m
elasticsearch-master-1           1/1       Running   0          15m
elasticsearch-master-2           1/1       Running   0          15m
kibana-kibana-6d7466b9b9-fbmsz   1/1       Running   0          2m
And last but not least, set up port forwarding for Kibana with:
kubectl port-forward deployment/kibana-kibana 5601
You can now access Kibana from your browser at: http://localhost:5601:

Advanced Kibana Configurations with Helm Charts
Customizable labels are available for pods and can be added to services. Pod labeling is also available here for Elasticsearch.
Step 5: Deploying Metricbeat with Helm
To set up a data pipeline, we’re going to end this tutorial with deploying the Metricbeat Helm chart:
Helm install --name metricbeat elastic/metricbeat
Within a minute or two, your Kubernetes cluster will display Metricbeat pods running alongside your Elasticsearch and Kibana pods:
kubectl get pods

NAME                                             READY     STATUS    RESTARTS   AGE
elasticsearch-master-0                           1/1       Running   0          11m
elasticsearch-master-1                           1/1       Running   0          11m
elasticsearch-master-2                           1/1       Running   0          11m
kibana-kibana-6d7466b9b9-bsfd5                   1/1       Running   0          6m
metricbeat-kube-state-metrics-bd55f95cc-8654c    1/1       Running   0          1m
metricbeat-metricbeat-kjj6z                      1/1       Running   0          1m
metricbeat-metricbeat-metrics-699db67c5c-b2fzs   1/1       Running   0          1m
If you curl Elasticsearch, you’ll see that metrics have already begun to be indexed in Elasticsearch:
curl localhost:9200/_cat/indices

green open .kibana_task_manager               QxPJtK5rQtGGguLRv5h9OQ 1 1   2 4 87.7kb  44.8kb
green open metricbeat-7.3.0-2019.09.18-000001 DeXaNAnMTWiwrQKNHSL0FQ 1 1 291 0  1.1mb 544.1kb
green open .kibana_1                          gk0OHIZDQWCNcjgb-uCBeg 1 1   4 0 30.3kb  15.1kb
All that’s left to do now is define the index pattern in Kibana and begin analyzing your data. In Kibana, go to the Management → Kibana → Index Patterns page, and click Create index pattern. Kibana will automatically identify and display the Metricbeat index:

Enter ‘metricbeat-*’ and on the next step select the @timestamp field to finalize the creation of the index pattern in Kibana.

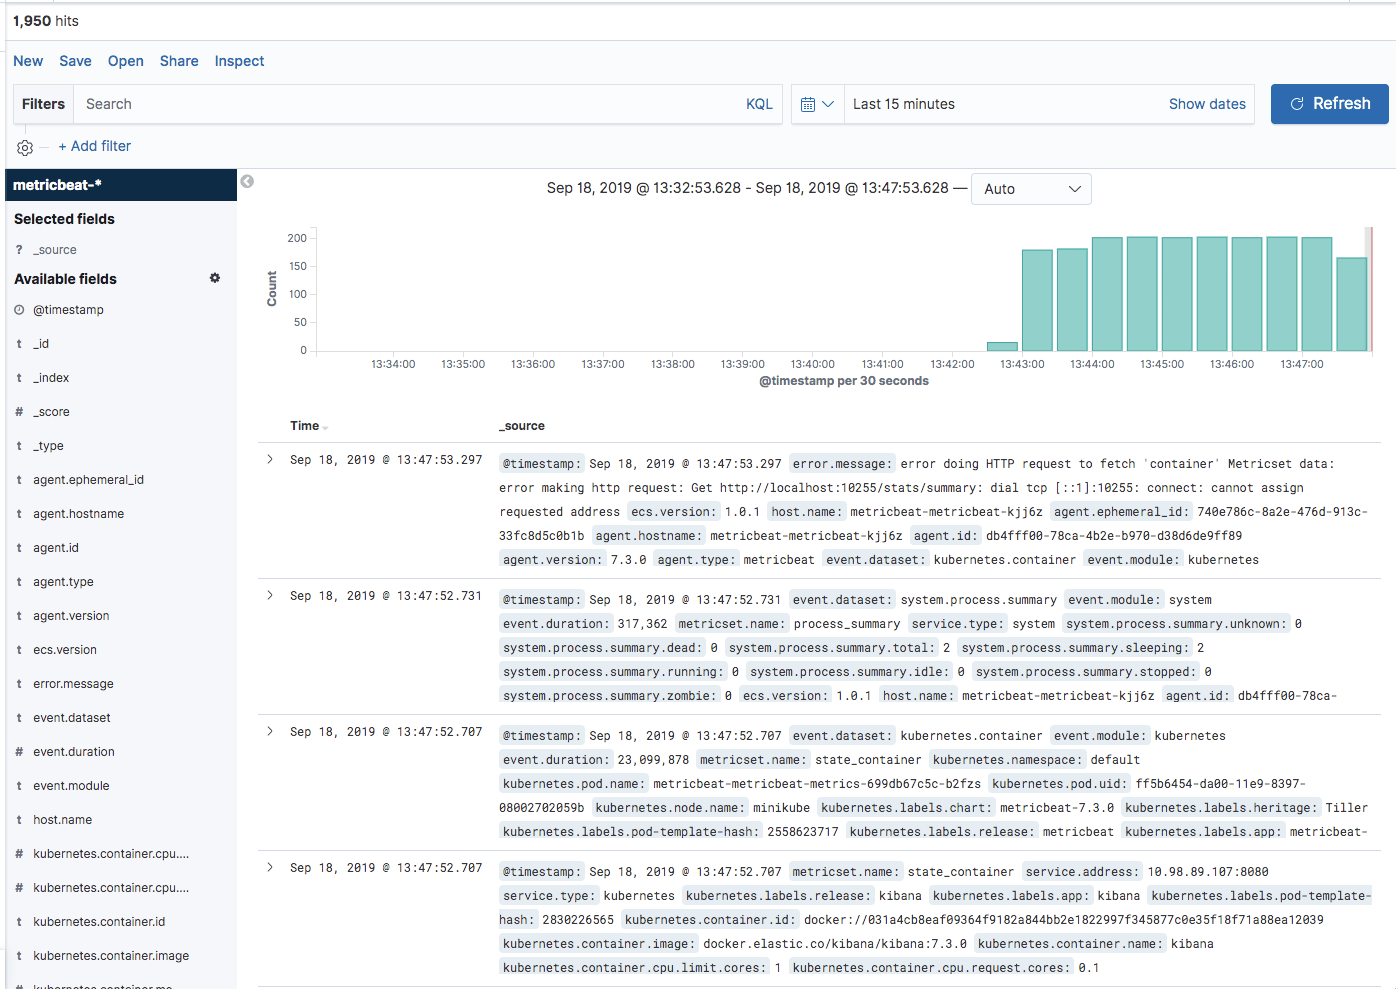
Hop on over to the Discover page. You’ll see all the metrics being collected from your Kubernetes cluster by Metricbeat displayed:
Endnotes
These Helm charts are a great way to get started with ELK on Kubernetes but will require tweaking to be able to handle large payloads. Maintaining an ELK Stack in production is not an easy task to start out with and managing a multi-node, large Elasticsearch cluster on Kubernetes will require both engineering resources and strong infrastructure. I expect that as Helm becomes the standard way to build and deploy applications on Kubernetes, best practices will emerge for handling large scale ELK deployments as well. Looking forward to it!

You Might Also Like

AI for Observability: What Actually Works in Production

