Docker Logging with the ELK Stack – Part Two
April 5, 2017
In the first part of this series, I covered the basic steps of how to set up a pipeline of logs from Docker containers into the ELK Stack (Elasticsearch, Logstash and Kibana). Regardless of which method you end up using to ship Docker logs — whether using a logging driver or a dedicated logging router — the next question we need to address is what to do with the logs once they are indexed in Elasticsearch and displayed in Kibana.
This post will describe the next step in the process of logging Docker with ELK — analyzing and visualizing the logs.
As a side note before we begin: The examples shown here are taken from a Dockerized environment that:
- Consists of ELK, Prometheus, and Grafana containers
- Sends Docker logs to the Logz.io ELK Stack using the Docker log collector.
The concept of how to analyze and visualize the logs remains the same if you are using your own ELK deployment.
Before Analysis … Parsing!
The level of difficulty in analyzing the logs being generated by our containers depends on how we parse them — meaning that the more efficient we are in breaking down the messages into meaningful fields, the easier it will be to create the visualizations for which Kibana is renowned.
Dockerized environments are extremely different from one another, so it’s hard to provide detailed parsing instructions. Each container will produce different log messages containing different building blocks.
Here’s a simple example from two different containers on the same Docker host.
First, a Grafana container:
t=2017-03-22T13:04:47+0000 lvl=info msg="Request Completed" logger=context userId=1 orgId=1 uname=admin method=GET path=/logout status=302 remote_addr=109.67.183.188 time_ms=1ns size=29
Then, an Elasticsearch container:
[2017-03-22T13:05:01,974][INFO ][o.e.c.r.a.DiskThresholdMonitor] [0EUzBd2] rerouting shards: [high disk watermark exceeded on one or more nodes]
Still, some general tips can be provided:
- Timestamp. Try to standardize the timestamp field for the different types of container logs. This will go a long way towards helping you with the analysis later on. Do not change the formatting for every new version of an image.
- Service ID/tag. To be able to differentiate between the different container logs, it’s crucial to add some kind of label to each log type so that the various streams can be differentiated in Kibana. You should be getting the container name and ID in the logs, but the more metadata you can add, the better for future analysis.
- Drop unnecessary data. Why the clutter? If there are any strings of data that can be dropped, get rid of them with Logstash filters. Analysis becomes much easier once you have cleaner messages. Also, be sure not to write logs to
STDOUT/STDERRas well.
Of course, doing all of this on your own is not always easy and dedicated logging containers, such as logspout and the Logz.io log collector, do all of the above for you. It’s definitely something to consider before you start.
Querying Your Docker Logs
Based on the brave assumption that you have managed to get your container logs into ELK, it’s time to pick up from the last step of the previous article.
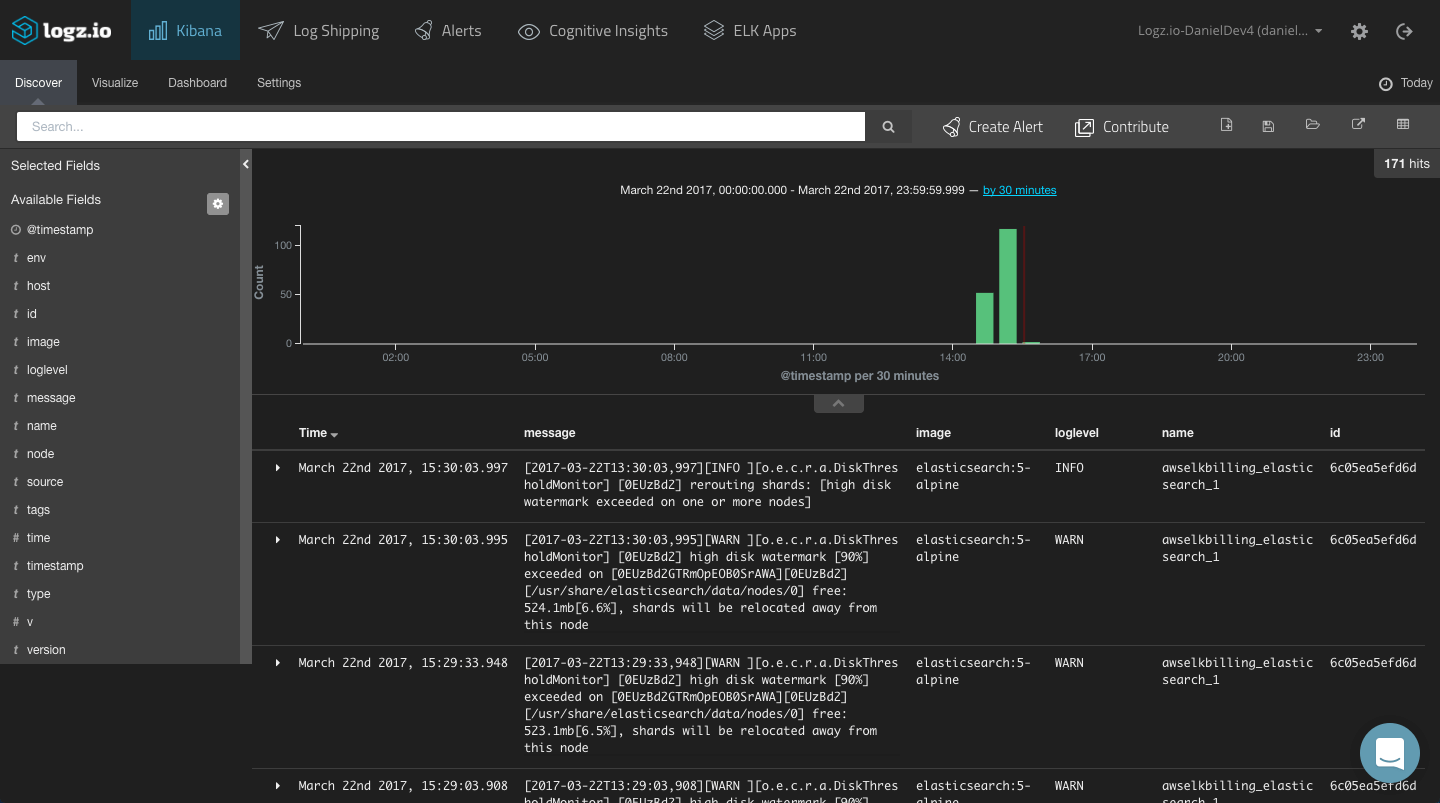
To start making sense of the data, a good place to start is to add some fields to the main log display area (the Discover tab). This will help us get some visibility into the data.
As explained above, this list of fields -— and whether you can use them for analysis —depends solely on how you configured your parsing. In our case, we have mapped some useful fields that can give us visibility into the logs such as “image” (the name of the image on which the container is based), “id” (the container identifier), and “name” (the name of the container).
Your next step is to query the data. To do this, you will need to learn the basics of Kibana querying syntax. Sounds like fun, right? We covered Kibana searches in our Kibana tutorial, but here are a few more basic Kibana searches you can use in the context of Docker logs.
You can use free-text searches to find the event for which you are searching, but that might prove too generic in nature — especially in larger environments logging scores of containers.
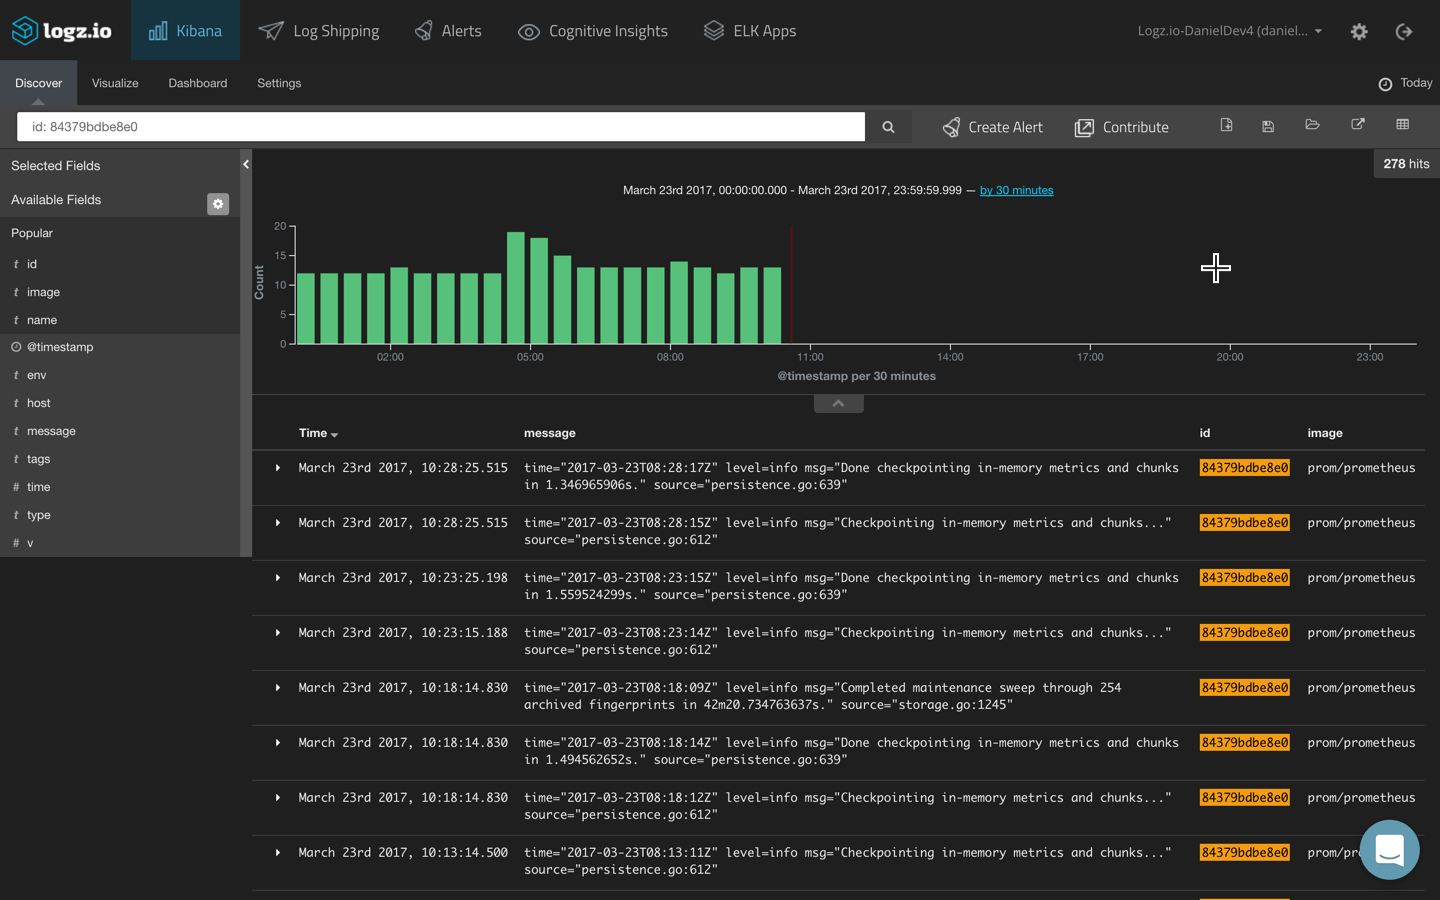
More granular searches will allow you to focus on specific services and containers. Field-level searches, for example, can return logs for a specific container or host:
id: 84379bdbe8e0
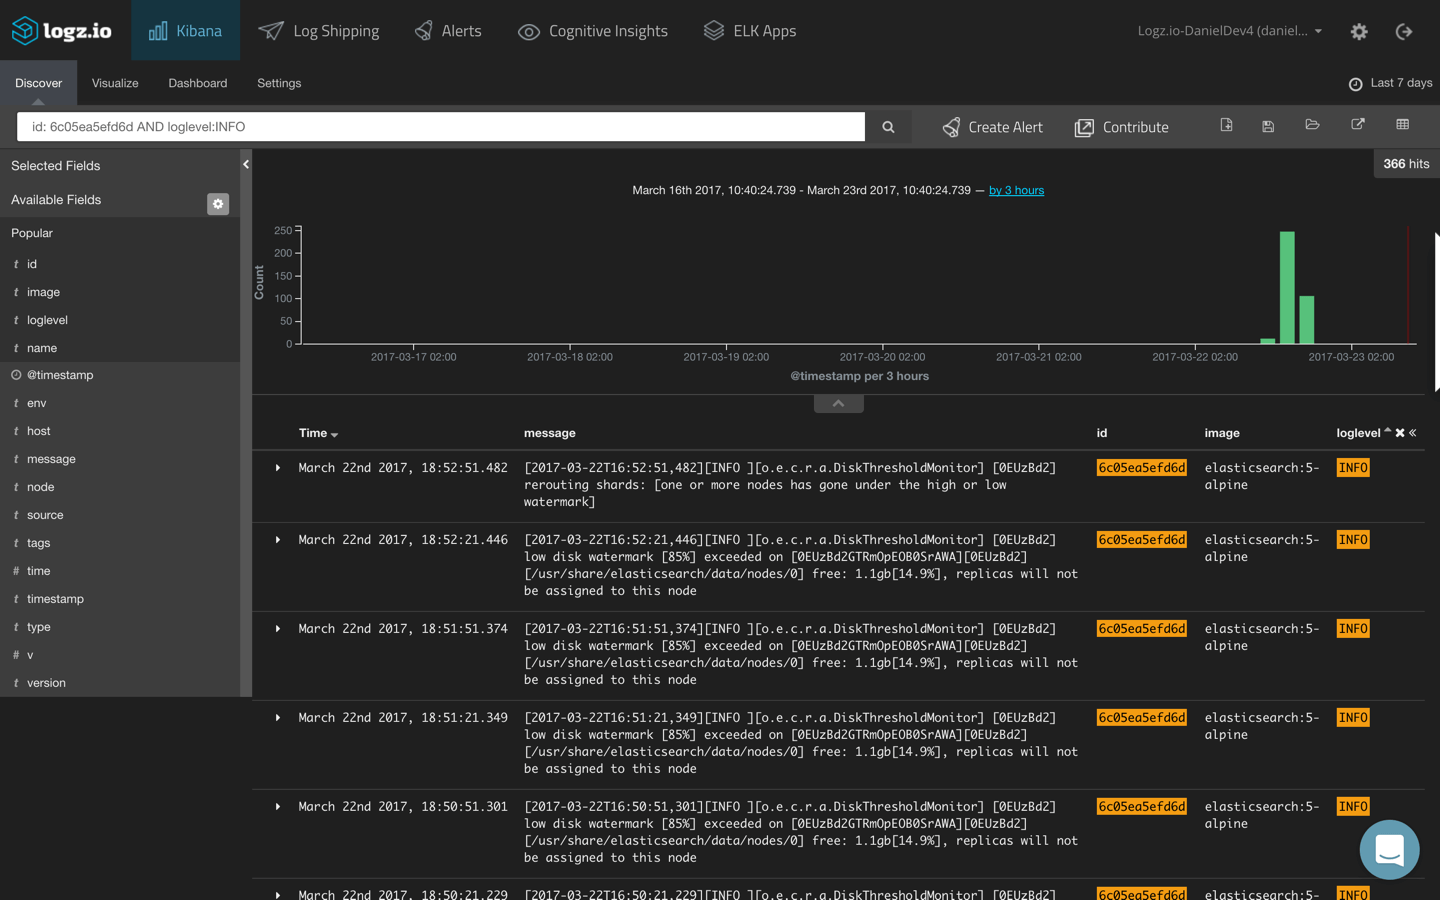
You can also combine two field-level searches in a logical statement to look for logs from a specific container and with a specific severity level:
id: 6c05ea5efd6d AND loglevel:INFO
Remember, these fields need to be mapped in your parsing to be able to perform field-based searches.
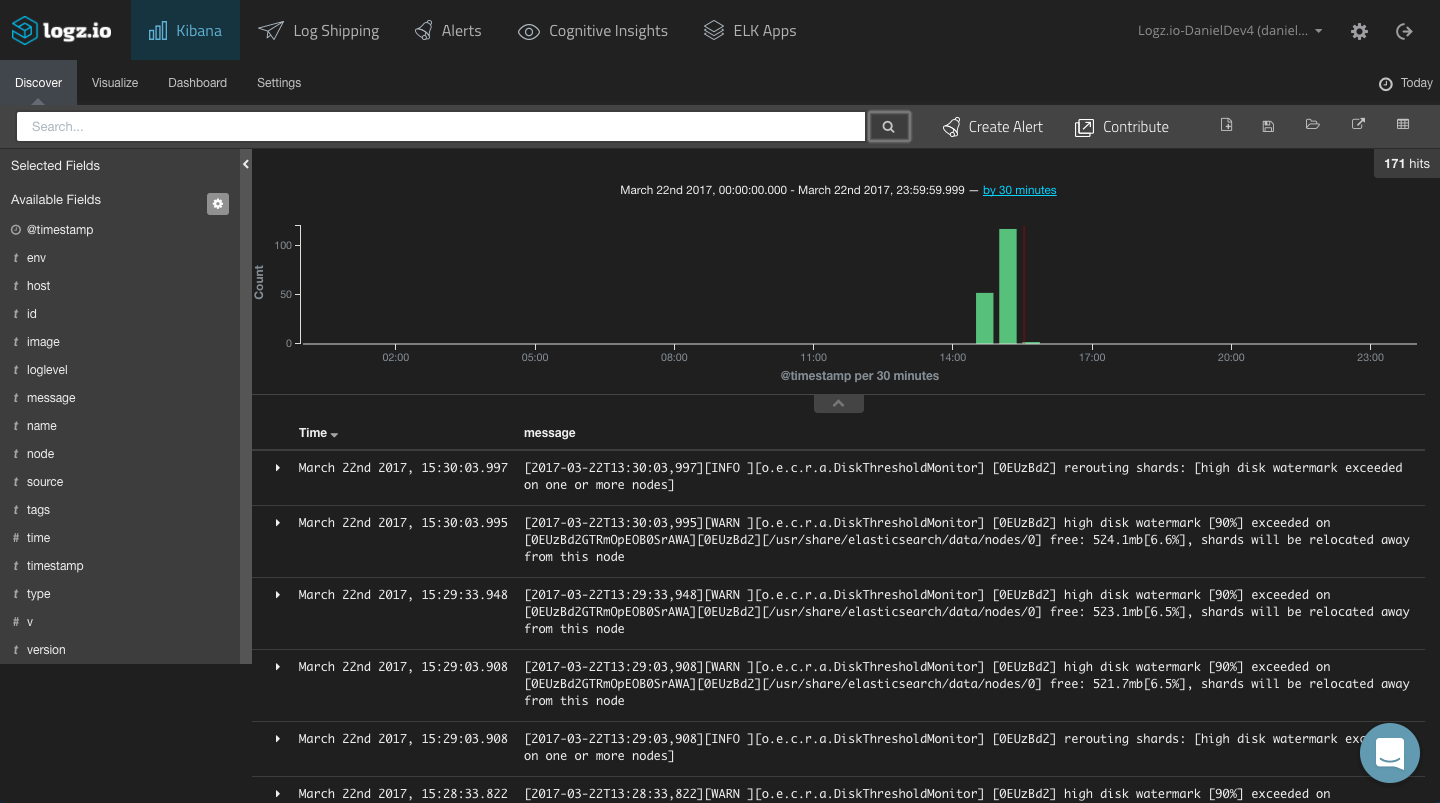
Another way of isolating the logs for a specific container is I using the _exists_ query. This allows you to filter the logs according to a specific field that exists in specific log messages.
For example:
_exists_:loglevel
Once you’ve finished querying your data, don’t forget to save your searches. This will help you in the visualization step. While you can perform searches while creating visualizations, it is much easier to start them from a set of data that has ready been filtered.
Visualizing Your Docker Logs
Kibana is renowned for the ability to create rich visualizations and dashboards on top of the indexed data. The truth, though, is that creating these beautiful graphical depictions of your data is not always easy. Again — how you mapped and parsed your messages is critical.
Let’s take a look at a few simple examples.
Logs per container
To see a breakdown of the amount of logs being generated per container or host, we can create a pie chart visualization.
Using a Terms aggregation of the container ‘name’ field, we get the following result:
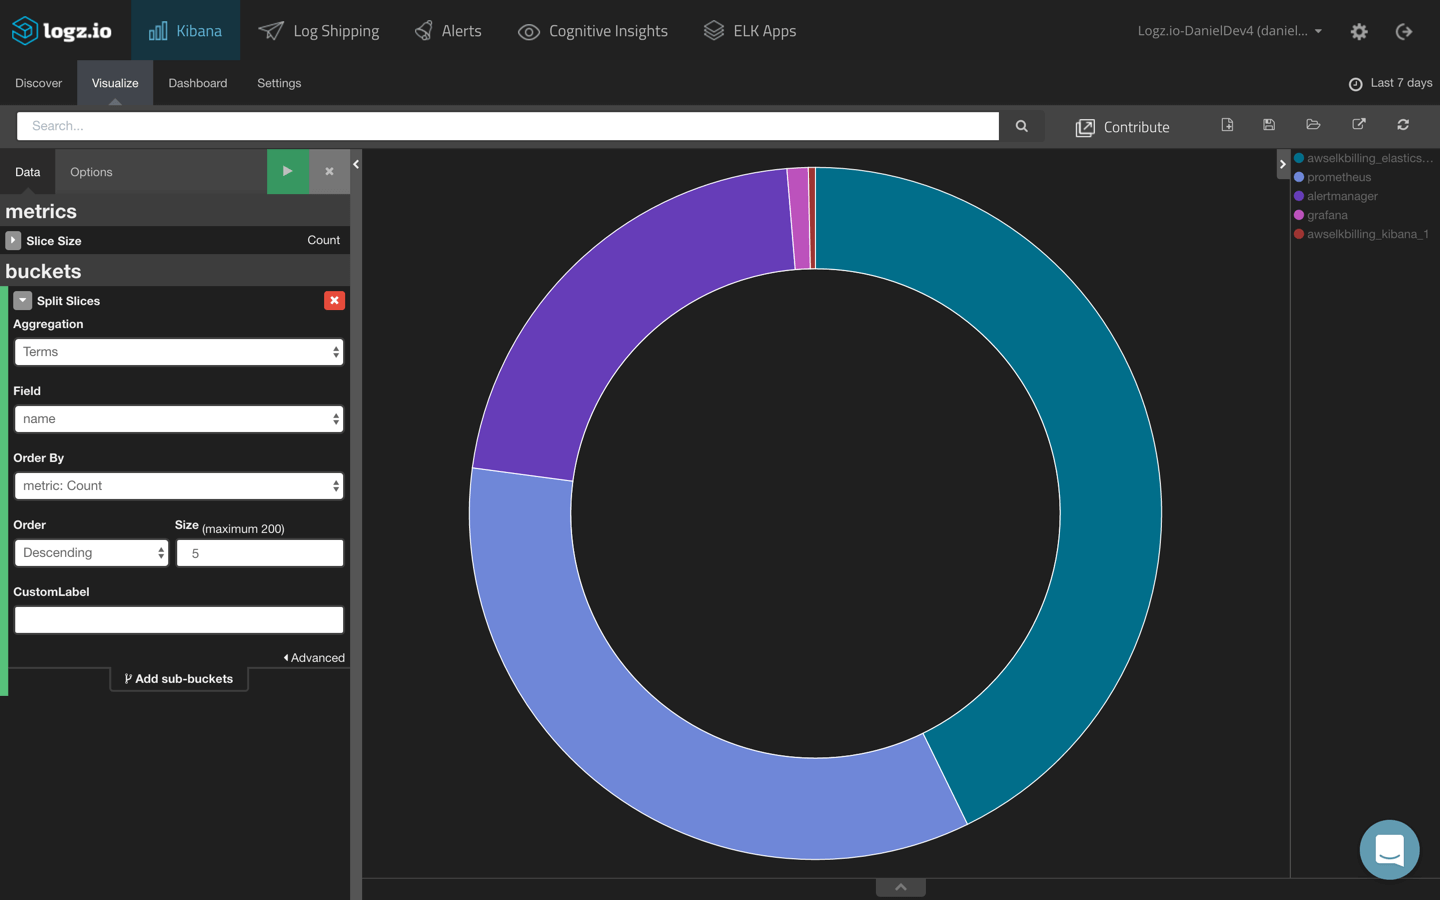
Of course, you could do the same for images or hosts.
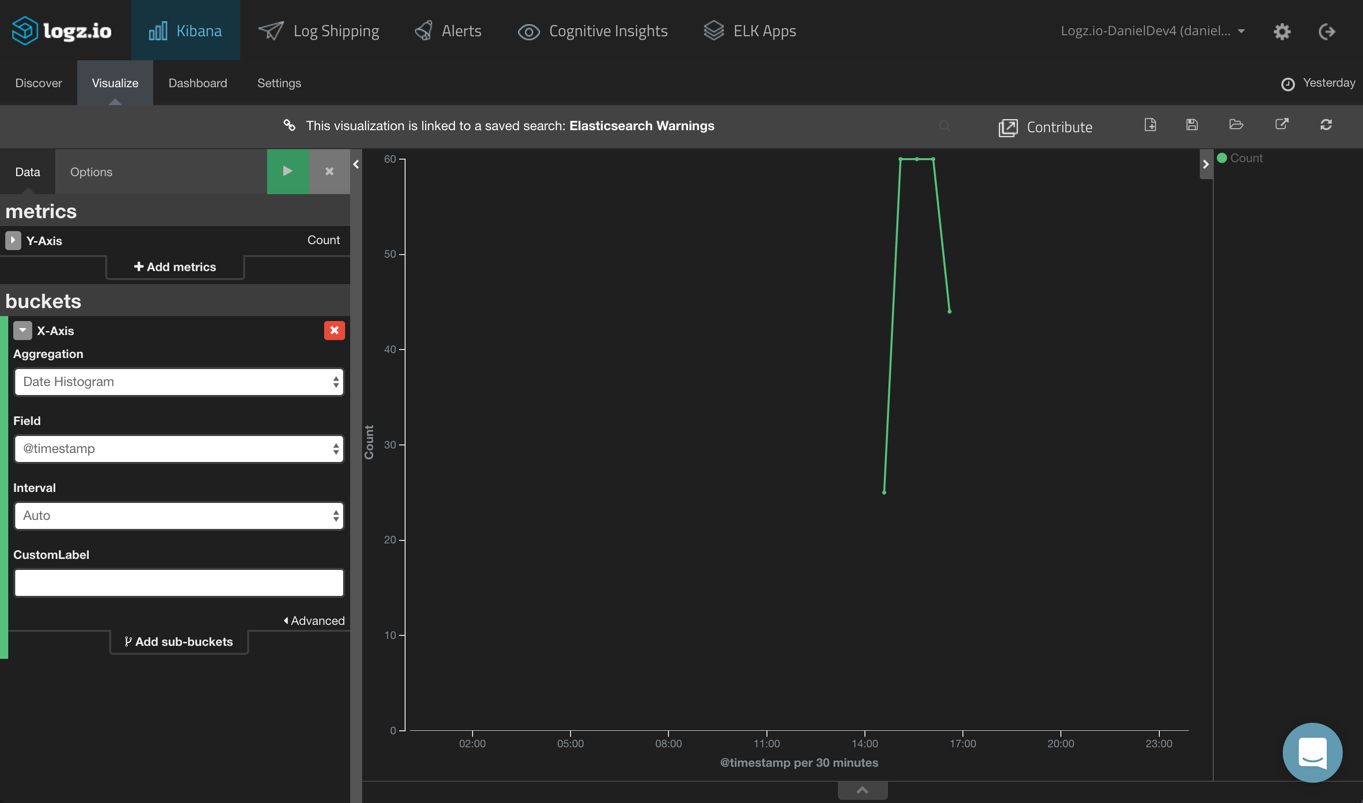
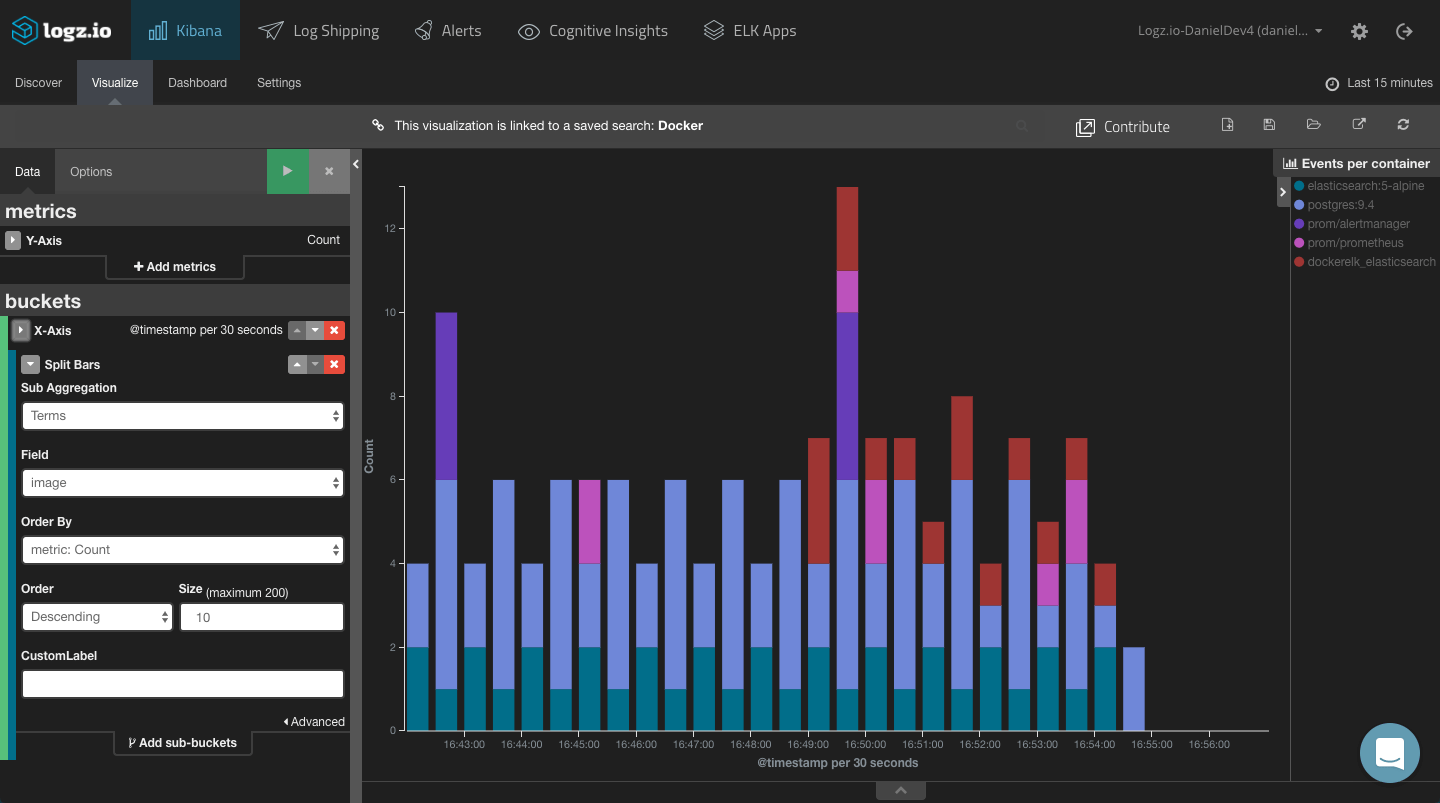
Events per container
Another example is monitoring the amount of events for specific containers. To do this, we will create a line chart visualization based on a saved search for event logs. In this example — error and warning logs — are being generated for a specific container.
All you need to do is configure the X axis to use a Date Histogram aggregation, and you’re all set:
Using a Bar Chart, you can get a more comprehensive view of logs per container:
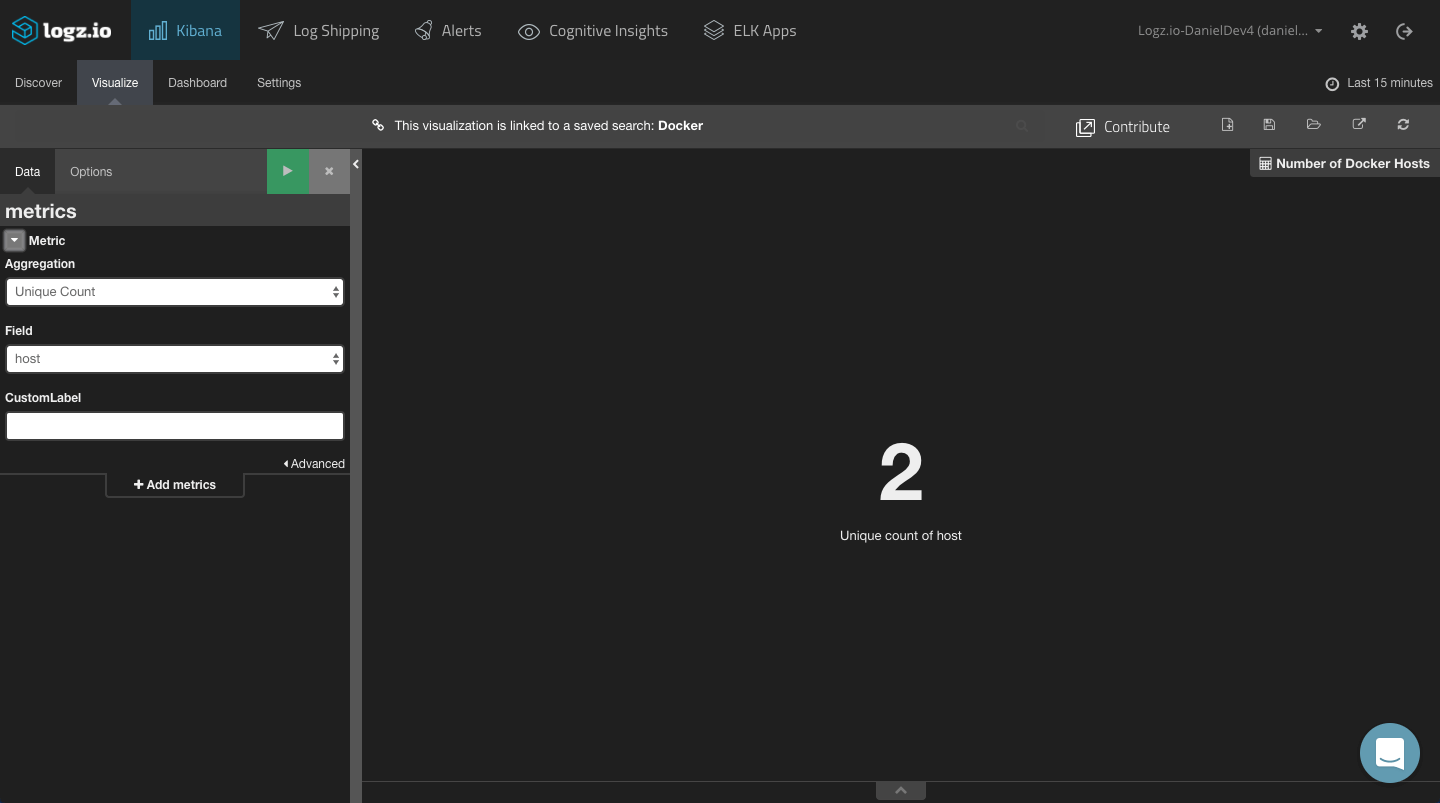
Number of images/containers/hosts
Using the Metric visualizations and the Unique Count aggregation, you can display the amount of Docker containers, images, and hosts in your environment.
These are just simple examples of how to visualize Docker container logs in Kibana. Kibana includes plenty more visualization types you can use — Tile Map visualizations to create geographic charts for IP fields (mapped as geoip fields), bar charts, data tables, and more.
Again, each Dockerized environment is totally different and contains different containers that generate different logs. The key to easier analysis is — and I can’t stress this enough — is parsing.
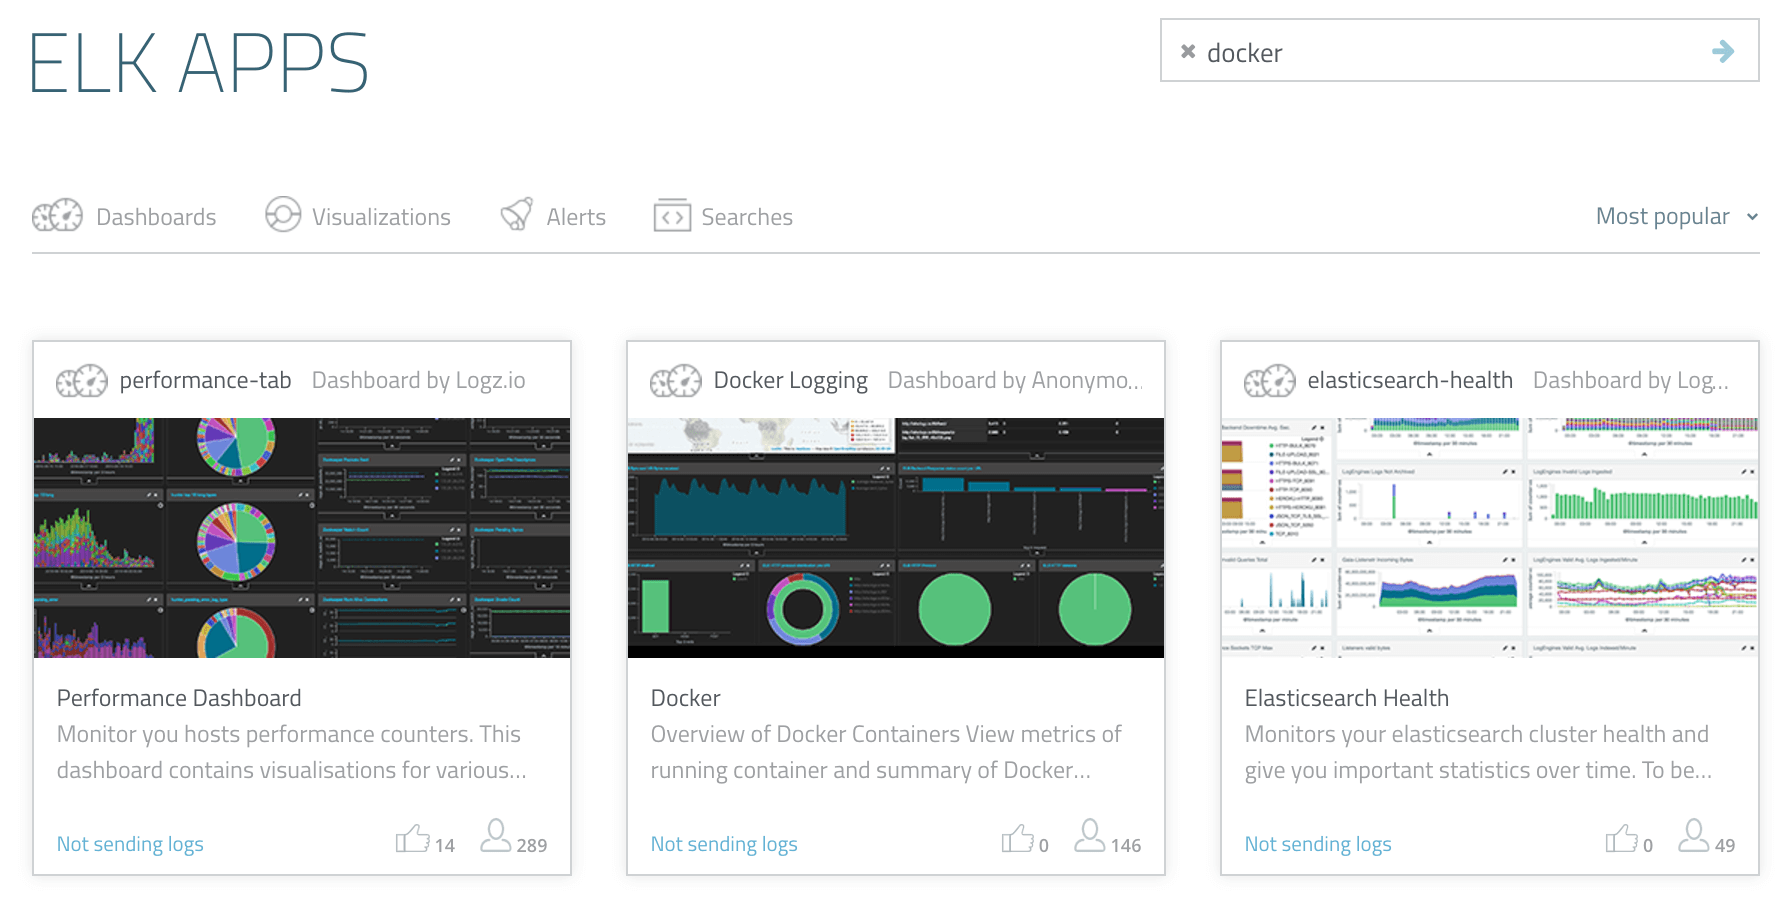
If you are using the Logz.io ELK Stack for logging your Docker containers, a pre-made dashboard is available in ELK Apps — a free library of pre-made Kibana visualizations and dashboards:
Endnotes
Despite the introduction of Docker drivers in version 1.12, Docker logging is still a big challenge.
A quick overview of other available solutions for extracting Docker logs from your containers reveals the simple truth that there is no silver bullet. Each method has its advantages and disadvantages, and this is without mentioning the other types of data Docker generates (such as stats and daemon events) that can — and should — be logged.
More on the subject:
While it is not straightforward to set up and establish a pipeline of well-parsed logs from your Docker hosts into ELK, the end result is worth the effort. Being able to centralize logs from all the different layers and visualize them will enable you to correlate events and monitor your Dockerized environment more efficiently.

You Might Also Like

Introduction to Custom Metrics in Java with Logz.io RemoteWrite SDK