DC/OS Logging with the ELK Stack
December 12, 2017

Data Center Operating System (DC/OS) is a system composed of Linux nodes communicating over a network to provide software-defined services. The DC/OS system consists of multiple software components written in different programming languages, running on various Linux nodes and communicating over properly configured TCP/IP networks. On each node, there can be multiple components executing along with their dependencies, each component providing a specific functionality or service.
From the operational side, DC/OS is a system of software-defined configurations and the automation of complex, independent applications running on clusters of machines.
From the development side, DC/OS is a platform that allows users to develop distributed systems composed of applications with access to a selection of core platform services. These services provide high-level abstractions, including persistent storage, message queues, and analytics.
DC/OS is not meant to be a configuration tool like Ansible, Chef, or Puppet. Rather, it is a cluster-scale operating system which enables the management of complex configurations of large numbers of nodes.
Logging DC/OS with ELK
To effectively log a large cluster consisting of multiple nodes and to monitor the status of the cluster, a centralized logging system is required. In this article, we will describe how to configure all nodes in a DC/OS cluster to report their logs to the ELK Stack (Elasticsearch, Logstash and Kibana) using Filebeat.
It’s important to note that the instructions shown here are for node instances running CentOS 7 on which all nodes are preconfigured. For instructions on how to install DC/OS, click here. We also assume you have a running ELK Stack or a Logz.io account (shipping logs to both are documented in this article).
Gathering DC/OS Logs
All DC/OS components report their logs into systemd-journald, a journal service running on each instance.
If Nginx is installed on the DC/OS cluster, for example, and you want to view all the logs stored on the instance, execute the following command to print all logs for Nginx installed on the cluster:
journalctl -u dcos-nginx -b
Next, extract the logs stored in systemd-journald for storage in a log file which you will then define in Filebeat.
Start by creating a log directory:
sudo mkdir -p /var/log/dcos
Then, write a script which parses the output from journalctrl and stores it in a /var/log/dcos/dcos.log file.
Below is an example of the dcos-journalctl-filebeat.service script which runs on your master node.
sudo tee /etc/systemd/system/dcos-journalctl-filebeat.service<<-EOF
[Unit]
Description=DCOS journalctl parser to filebeat
Wants=filebeat.service
After=filebeat.service


[Service]
Restart=always
RestartSec=5
ExecStart=/bin/sh -c '/usr/bin/journalctl --no-tail -f \
 -u dcos-3dt.service \
 -u dcos-3dt.socket \
 -u dcos-adminrouter-reload.service \
 -u dcos-adminrouter-reload.timer   \
 -u dcos-adminrouter.service        \
 -u dcos-bouncer.service            \
 -u dcos-ca.service                 \
 -u dcos-cfn-signal.service         \
 -u dcos-cosmos.service             \
 -u dcos-download.service           \
 -u dcos-epmd.service               \
 -u dcos-exhibitor.service          \
 -u dcos-gen-resolvconf.service     \
 -u dcos-gen-resolvconf.timer       \
 -u dcos-history.service            \
 -u dcos-link-env.service           \
 -u dcos-logrotate-master.timer     \
 -u dcos-marathon.service           \
 -u dcos-mesos-dns.service          \
 -u dcos-mesos-master.service       \
 -u dcos-metronome.service          \
 -u dcos-minuteman.service          \
 -u dcos-navstar.service            \
 -u dcos-networking_api.service     \
 -u dcos-secrets.service            \
 -u dcos-setup.service              \
 -u dcos-signal.service             \
 -u dcos-signal.timer               \
 -u dcos-spartan-watchdog.service   \
 -u dcos-spartan-watchdog.timer     \
 -u dcos-spartan.service            \
 -u dcos-vault.service              \
 -u dcos-logrotate-master.service  \
 > /var/log/dcos/dcos.log 2>&1'
ExecStartPre=/usr/bin/journalctl --vacuum-size=10M


[Install]
WantedBy=multi-user.target
EOF
The above step should be repeated on the all your slave nodes in the cluster. The only change relates to the services for which logs are fetched. If you have other services installed that you want to log, simply add them to the ExecStart section as shown in the example below:
sudo tee /etc/systemd/system/dcos-journalctl-filebeat.service<<-EOF
[Unit]
Description=DCOS journalctl parser to filebeat
Wants=filebeat.service
After=filebeat.service


[Service]
Restart=always
RestartSec=5
ExecStart=/bin/sh -c '/usr/bin/journalctl --no-tail -f      \
 -u dcos-3dt.service                      \
 -u dcos-logrotate-agent.timer            \
 -u dcos-3dt.socket                       \
 -u dcos-mesos-slave.service              \
 -u dcos-adminrouter-agent.service        \
 -u dcos-minuteman.service                \
 -u dcos-adminrouter-reload.service       \
 -u dcos-navstar.service                  \
 -u dcos-adminrouter-reload.timer         \
 -u dcos-rexray.service                   \
 -u dcos-cfn-signal.service               \
 -u dcos-setup.service                    \
 -u dcos-download.service                 \
 -u dcos-signal.timer                     \
 -u dcos-epmd.service                     \
 -u dcos-spartan-watchdog.service         \
 -u dcos-gen-resolvconf.service           \
 -u dcos-spartan-watchdog.timer           \
 -u dcos-gen-resolvconf.timer             \
 -u dcos-spartan.service                  \
 -u dcos-link-env.service                 \
 -u dcos-vol-discovery-priv-agent.service \
 -u dcos-logrotate-agent.service          \
 > /var/log/dcos/dcos.log 2>&1'
ExecStartPre=/usr/bin/journalctl --vacuum-size=10M


[Install]
WantedBy=multi-user.target
EOF
The only difference between the scripts for your master and slave nodes is the number of components being reported. Some of the components run only on the master node so they are not appended to dcos.log files.
To start gathering logs, you will first need to start these services:
sudo chmod 0755 /etc/systemd/system/dcos-journalctl-filebeat.service
sudo systemctl daemon-reload
sudo systemctl start dcos-journalctl-filebeat.service
sudo systemctl enable dcos-journalctl-filebeat.service
You should be able to see any collected logs by executing this command:
tail -F /var/log/dcos/dcos.log
Configuring Filebeat
The next step is to install and configure Filebeat which will act as the log shipper, tracking the DC/OS log file and forwarding the collected data to Elasticsearch for indexing.
First, download and configure Filebeat on all nodes in your DC/OS cluster.
curl -L -O https://artifacts.elastic.co/downloads/beats/filebeat/filebeat-5.6.1-x86_64.rpm

sudo rpm -vi filebeat-5.6.1-x86_64.rpm
Once installed, configure the Filebeat configuration file (/etc/filebeat/filebeat.yml) to track the /var/log/dcos/dcos.log file which we defined as the output file for our logs. In the example below, the $ELK_LOGSTASH and $ELK_PORT variables are to be replaced with the hostname and port of the running Logstash instance.
sudo tee /etc/filebeat/filebeat.yml <<-EOF
filebeat.prospectors:
- input_type: log
 paths:
   - /var/lib/mesos/slave/slaves/*/frameworks/*/executors/*/runs/latest/stdout
   - /var/lib/mesos/slave/slaves/*/frameworks/*/executors/*/runs/latest/stderr
   - /var/log/mesos/*.log
   - /var/log/dcos/dcos.log
tail_files: true
output.logstash:
 hosts: ["$ELK_LOGSTASH:$ELK_PORT"]
EOF
Again, you must perform the same steps on all nodes, including the master node.
After applying configuration files to all nodes, enable Filebeat services to see the log files in your ELK Stack.
sudo systemctl start filebeat
sudo systemctl enable filebeat
After a few seconds, your logs should be indexed in Elasticsearch and you will be able to define the index pattern in Kibana to begin analysis.
Shipping DC/OS Logs with Logz.io
Once you have completed the steps described above, shipping your logs to Logz.io using Filebeat is quite easy.
Your first step is to download an SSL certificate for encrypting the data. Execute the following commands on the master and slave nodes:
curl https://raw.githubusercontent.com/logzio/public-certificates/master/
COMODORSADomainValidationSecureServerCA.crt --output
COMODORSADomainValidationSecureServerCA.crt

sudo mkdir -p /etc/pki/tls/certs
sudo cp COMODORSADomainValidationSecureServerCA.crt /etc/pki/tls/certs/
After downloading the certificate, it’s time to configure Filebeat to stream the logs from the DC/OS cluster to Logz.io.
The easiest way to do this is to use our Filebeat wizard (available under Log Shipping → Filebeat in the Logz.io UI) to create a Filebeat configuration file which you can simply apply to Filebeat on your master and slave nodes.
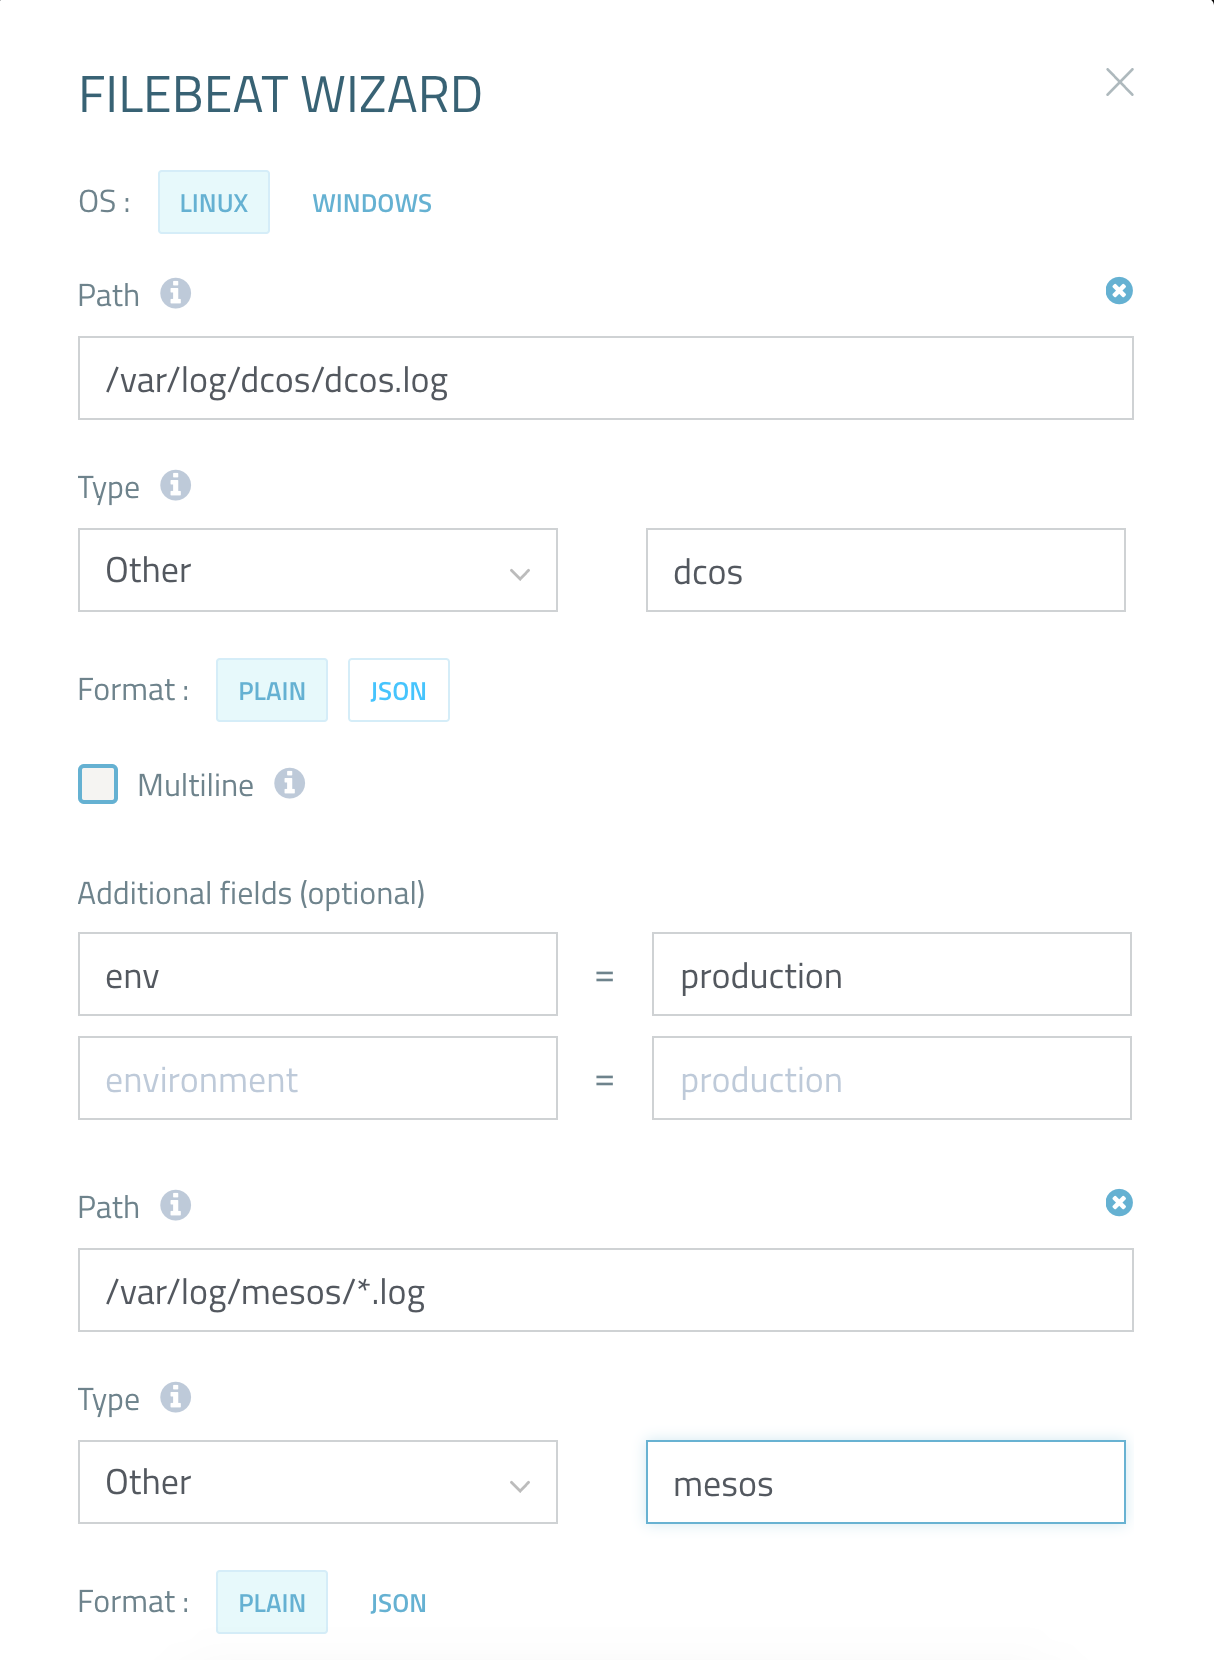
Here is an example of what a Filebeat configuration would look like for shipping into Logz.io:
############################# Filebeat #####################################
filebeat:
 prospectors:
   -
     paths:
       - /var/log/dcos/dcos.log
     fields:
       logzio_codec: plain
       token: <TOKEN>
       env: production
     fields_under_root: true
     ignore_older: 3h
     document_type: dcos
   -
     paths:
       - /var/log/mesos/*.log
     fields:
       logzio_codec: plain
       token: <TOKEN>
       env: production
     fields_under_root: true
     ignore_older: 3h
     document_type: mesos
 registry_file: /var/lib/filebeat/registry
############################# Output ##########################################
output:
 logstash:
   hosts: ["listener.logz.io:5015"]

########  The below configuration is used for Filebeat 5.0 or higher
   ssl:
     certificate_authorities: ['/etc/pki/tls/certs/COMODORSADomainValidationSecureServerCA.crt']
The example above covers shipping the /var/log/dcos/dcos.log and /var/log/mesos/*.log files, but you can repeat the same steps to include more files which will be shipped to Logz.io.
Be sure to add your Logz.io user token in the Filebeat file. You can find this under your account settings.
Once you’ve replaced the old Filebeat configuration file with the new one, all you have to do to is restart the Filebeat daemons running on your various DC/OS nodes so they can pick up the new configuration:
sudo systemctl restart filebeat
You should be able to see your logs coming into Logz.io after a few seconds.
Summary
As DC/OS core components are regular Linux processes, logging and monitoring can be set up similarly to any other Linux system. This is done by collecting all logs reported to the journalctl daemon into one log file and delegating the remaining work to a Filebeat daemon which transfers the file’s content to the ELK stack, whether it’s your own ELK deployment or Logz.io.More on the subject:
In this article, we assumed that all DC/OS components are reporting their logs through stderr and stdout, but not all components do. Some DC/OS components write their logs to files directly and cannot be caught by systemd-journald. In this case, the best solution is to reconfigure the log gatherer scripts so that those files are also included.
Happy logging!

You Might Also Like

How to Deploy an Azure Kubernetes Cluster with AKS

