Combining Log Analysis with Continuous Delivery to Reduce Release Cycle Times
May 3, 2018
One of the biggest challenges in the field of log analysis is being able to connect the dots and understand the underlying story connecting them. Applications and machines are generating an increasing amount of log data, making it extremely difficult to separate the wheat from the chaff.
This challenge is exacerbated by the growing frequency in which new code is being deployed. Continuous Integration (CI) and Continuous Deployment (CD) tools automate the process of application delivery, and the end result is more events, more log data, more obscured visibility and longer time to resolution.
In November last year, we introduced Application Insights — a new machine learning analysis tool that identifies new exceptions and errors being thrown by applications and displays them with actionable information that can be used for resolving the underlying event. This feature compliments Cognitive Insights, another machine learning technology that correlates events with discussions in technical forums on the web.
We are now happy to introduce a new capability that allows users to place these two types of events in the correct context by integrating with Continuous Delivery (CD) pipelines.
Users can now add visual markers to their insights storyline that signify that specific events or changes took place in their environment, thus helping them see the larger picture more easily and resolve issues faster.
Let’s take a closer look.
Creating new markers for events
The Insights page in Logz.io lists all the events identified by Logz.io’s machine learning engine. Whether Application Insights or Cognitive Insights, you can plot these events on a storyline that gives you an overview of critical, and otherwise hidden, events taking place.
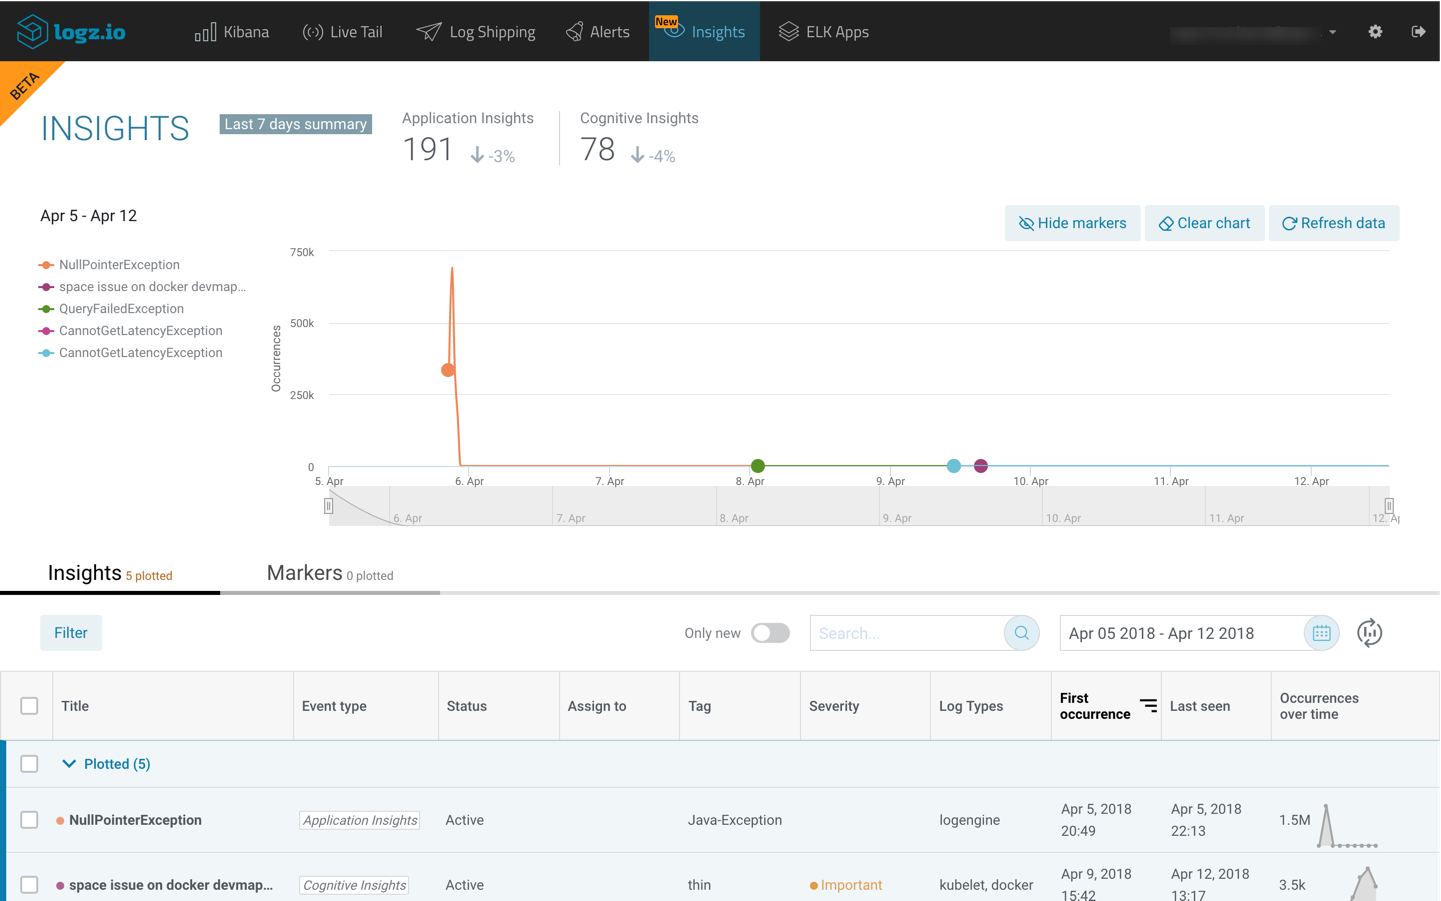
To help you understand the context in which these events are taking place, you can add what are called “markers” to the storyline. These markers reflect significant events that could be potential catalysts for issues, for example – new deployments, rollbacks, and specific alerts that may have been triggered.
The process of integrating with your application delivery pipeline and adding new markers is based on log messages.
First, configure your continuous delivery tool or application to log a specific message. Needless to say, whatever tool you may be using as part of the delivery pipeline, the more structured this log message is, the easier the process of configuring the new marker. Alternatively, you can latch onto a log that is already being shipped into the system that signifies an event is taking place. Then, select the Markers tab on the Insights page and click + Create marker.
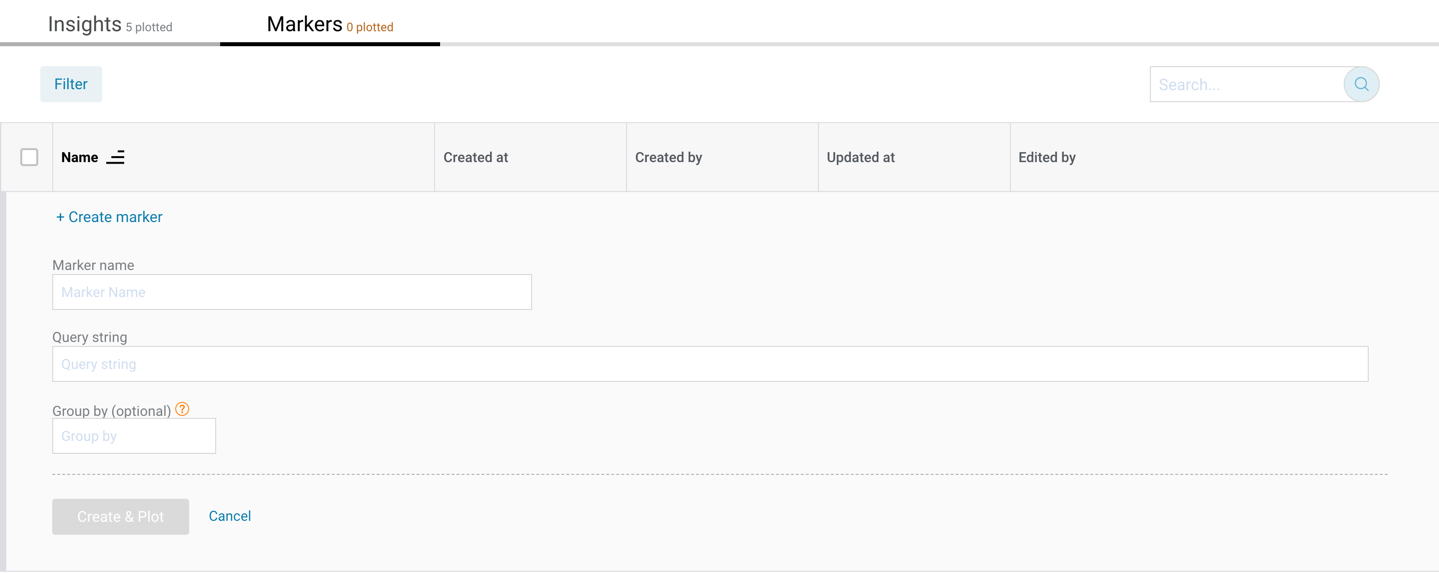
The next step is to give a name for your marker and enter a Kibana query for the log message your tool/service is shipping into Logz.io.
Let’s take a look at an example of a marker.
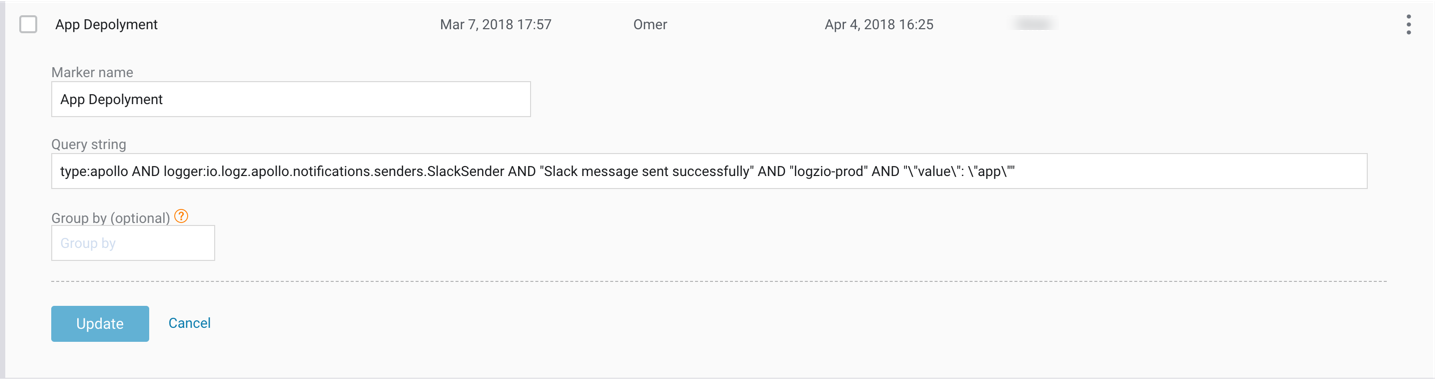
As implied by its name, this marker signifies a new deployment has occurred. The query string is looking for logs shipped by Apollo — an open source continuous deployment tool developed by Logz.io that is used for deploying with Kubernetes — which contains a specific string.
Hitting Create & Plot adds the marker to the markers tab, and plots it on your event storyline.
Correlating with insights
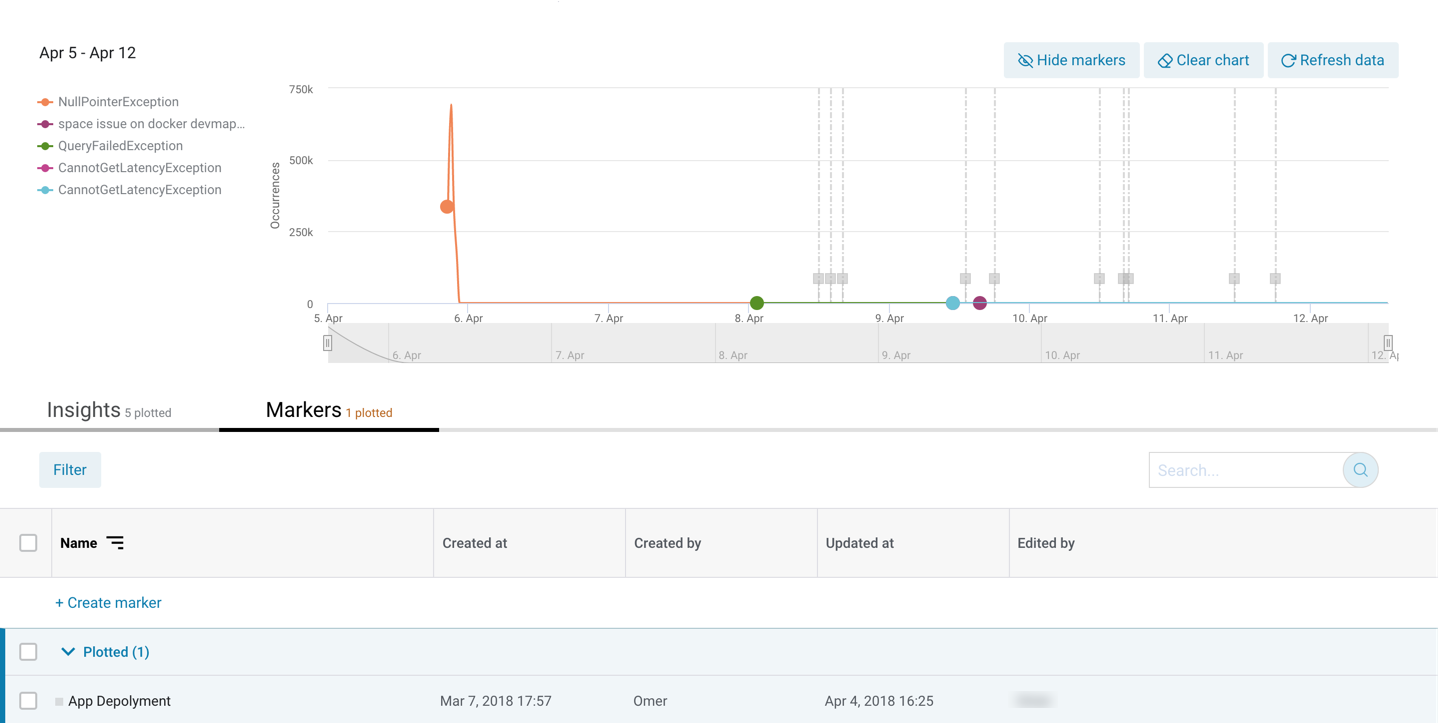
Once added to the graph, markers can be used to identify possible connections between the event they signify and the issues identified by Logz.io.
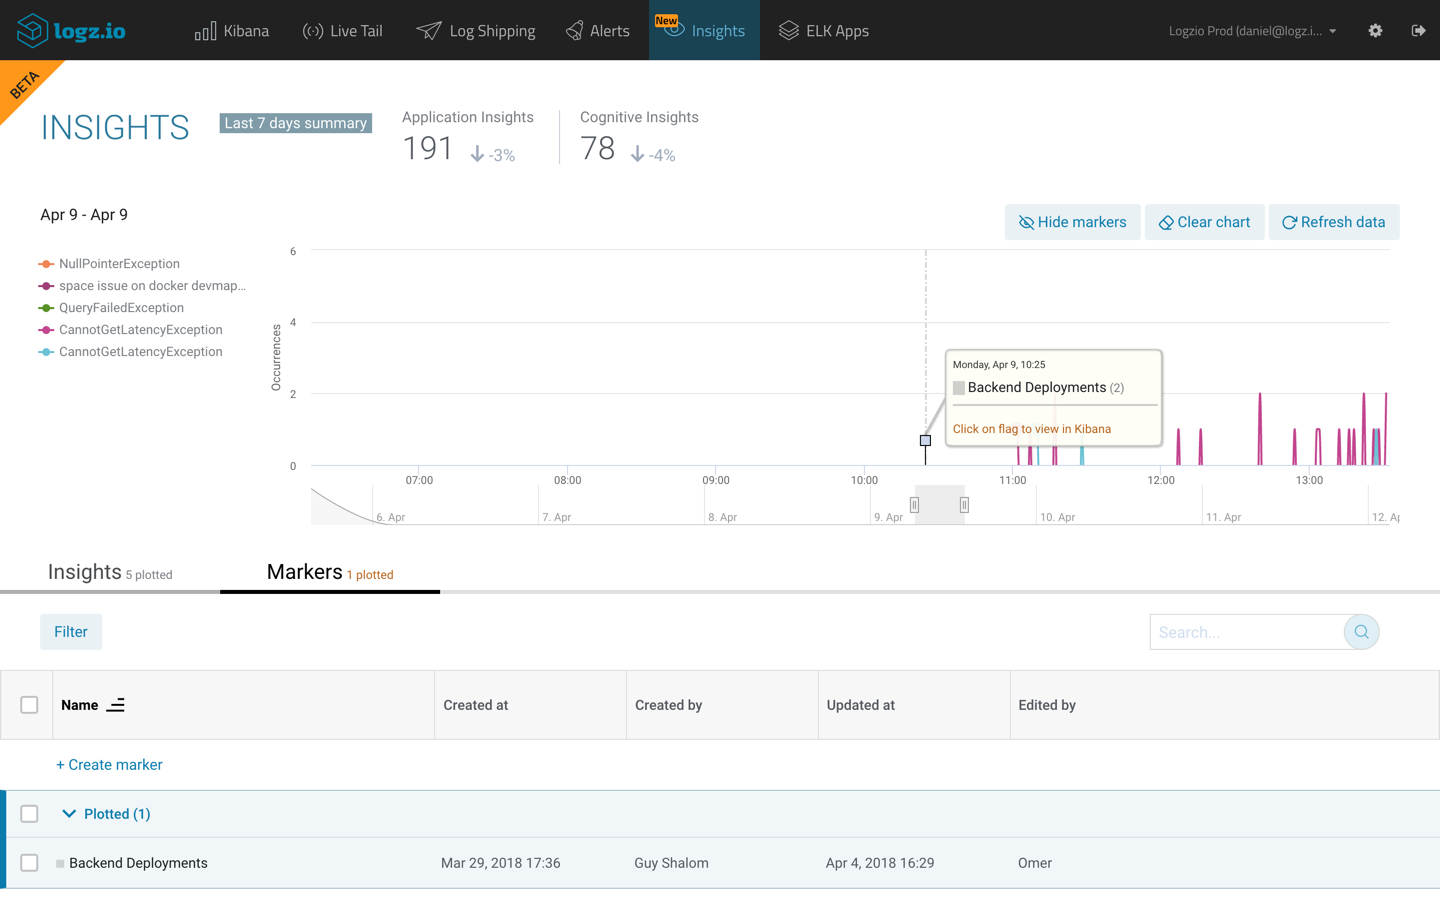
The markers are displayed on the storyline graph as grey flags, placed on vertical lines.
Hovering over the flag itself will display a tooltip informing you what event transpired and how many times it happened within the displayed time frame.
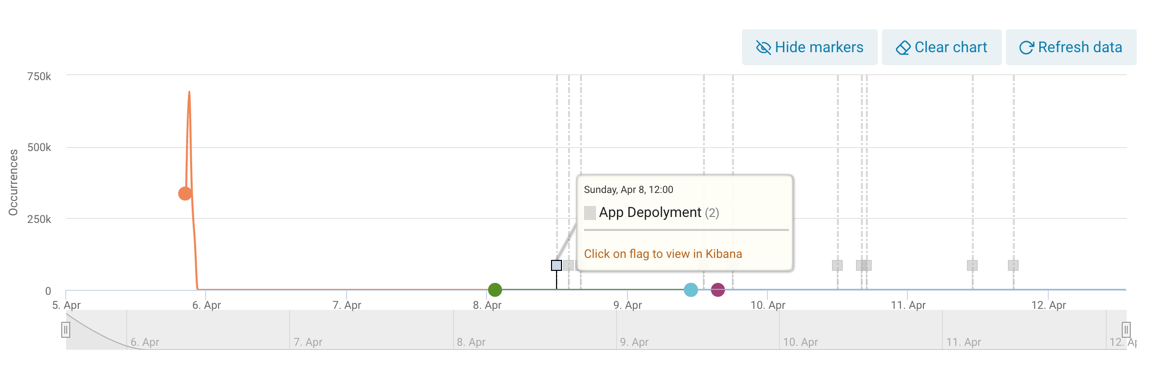
For deeper investigation, click and drag on a time frame on the graph. This will clarify the picture and help you establish a correlation between a specific insight and the marker in question.
In this case, we can see there was an issue with disk space on one of the Docker containers following a new deployment. If you want to take a look at the log messages themselves used for the marker, just click the flag itself and you will be taken to the Discover page in Kibana.
Handling markers
Markers can be subsequently added to the storyline graph at any point in time the same way insights are added — by either using the Plot Incidents button in the action bar (displayed when you select a marker, or a group of markers, from the list) or using the action menu.
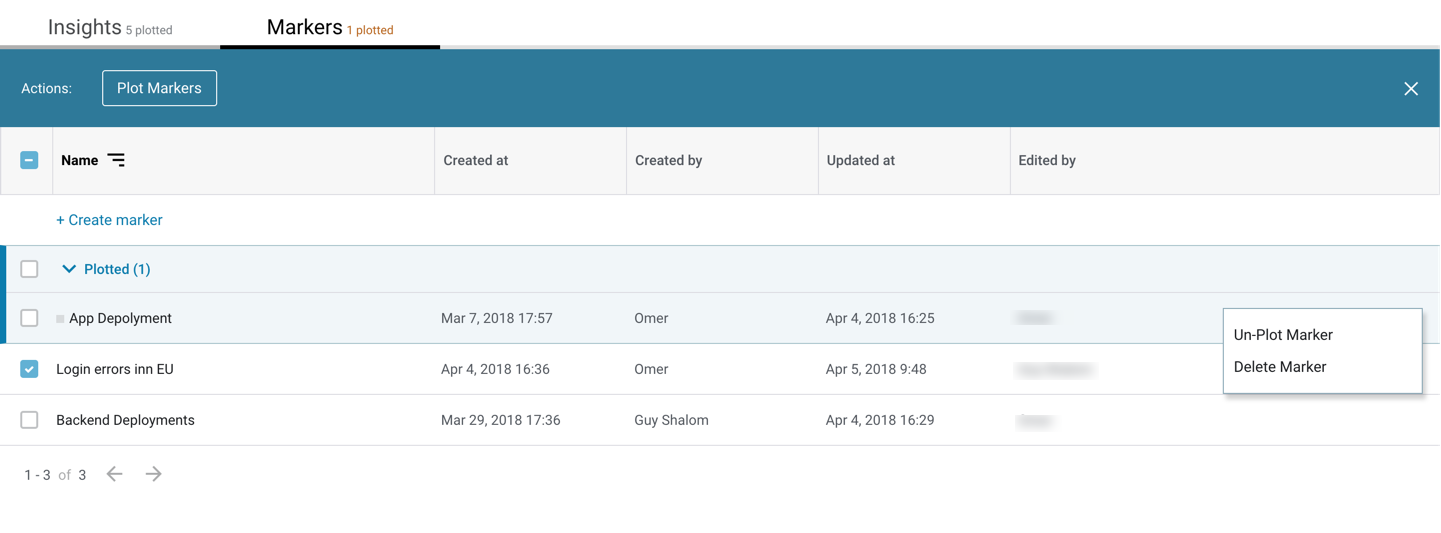
For easier management, you can sort the markers list, as well as filter and search it. Markers can be quickly and temporarily removed from the graph using the Hide Markers button above the graph.
Summing it up
CI/CD processes are pushing code into production more frequently, obscuring the already-limited visibility into your environment. As a result, events are simply getting drowned together with all the other signals and noise they generate.
This is the first time a log analysis platform has integrated with the application delivery process to shorten the development and deployment cycle. Logz.io’s Insights, coupled with the new ability to add markers that signify changes have taken place in the environment, helps developers and operators to see the overall picture more easily, resulting in faster troubleshooting and issue resolution.

You Might Also Like

Critical Automation: Anomaly Detection for Application Observability