

Monitoring Logstash Pipelines
November 13, 2017

Let’s face it, logstash is a difficult beast to tame.
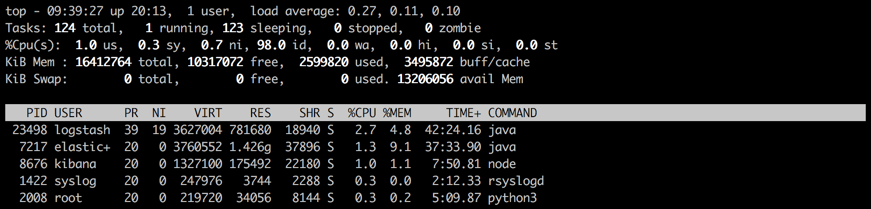
It’s heavy on your resources, configuring multiple pipelines can easily get out of hand, and all in all — it’s a tough cookie to debug. But — and this is huge but — it is one heck of a log aggregator, and will be in charge of a lot of the heavy lifting in your ELK-based pipelines. There’s a reason why you will see it starring in your Top list.
Over the years, attempts have been made to improve Logstash performance. Some of the processing Logstash has been traditionally in charge of has been assigned to other components in the stack (e.g. Filebeat, Elasticsearch ingest nodes).
In more recent versions, peripheral tooling was added to help operate and monitor Logstash. Monitoring APIs were introduced in version 5.0, that can provide you with general info and stats on the Logstash node and installed plugins. The Hot Threads API allows you to get details on abnormal Java threads with high CPU and taking a long time to execute.
Another and more recent monitoring tool is the Logstash Pipeline Viewer which was released as part of version 6. Let’s take a closer look.
Getting started
The Pipeline Viewer is part of the monitoring features offered in X-Pack. This means, that there is no other way to use it other than to follow the instructions for installing X-Pack as part of your ELK Stack setup.
Installing ELK Stack is not the purview of this article, but I will give you some general guidelines to make sure all works as expected.
- As always, make sure you have Java 8 installed before you begin the installation process.
- X-Pack plugins need to be installed for each component of the stack. Follow the order of installation as documented here.
- When resetting your X-Pack usernames and passwords, make note of them. You will need the Logstash user and password to enable the monitoring capabilities.
- Be sure to add the relevant X-Pack directives to the Logstash configuration file (/etc/logstash/logstash.yml):
xpack.monitoring.enabled: "true"
xpack.monitoring.elasticsearch.url: "http://localhost:9200"
xpack.monitoring.elasticsearch.username: "username"
xpack.monitoring.elasticsearch.password: "password"
- Don’t forget to add your X-Pack credentials to the output section in your Logstash pipeline configuration, otherwise, you will be seeing 401s when trying to connect Logstash to Elasticsearch.
 output {
   stdout { codec => rubydebug }
   elasticsearch {
    hosts => "localhost"
    user => "username"
    password => "password"
    }
 }
Once you have installed all the components and started your Logstash pipeline, you should be able to see your Logstash nodes and any running pipeline in the Monitoring tab in Kibana.

Opening the Logstash section, an overview of your Logstash instances is displayed, exposing and visualizing most of the data you can access with the monitoring API.

Visualizing your pipelines
The subject of this article, however, is the Pipeline Viewer. If you click on Pipelines, you will see a list of the different versions of your pipeline statistics (not the configurations themselves). So if you are making frequent changes, you can measure their effect on performance.

Opening a version will give you a visual depiction of statistical data captured for the pipeline — you can view the data flow, and any branching logic implemented as part of the pipeline such as filter plugins used and defined output destinations.

Each of the components displayed in the viewer includes labels and metrics which change depending on the plugin. Take the Elasticsearch output plugin for example.
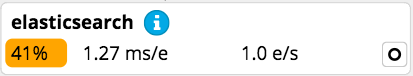
There is an O label signifying this is an output plugin. Starting from left to right, you can also see worker usage (% of total execution time), performance (no. of milliseconds spent processing each event, and throughput (number of events per second). Some of these metrics might be highlighted — in the case above we can see that the worker usage is at 41%. This indicates a potential issue down the road that we may want to look into.
The i icon is displayed here because I haven’t added IDs to the different steps within the Logstash configuration file. While not mandatory, these IDs can help you more easily identify the difference in performance for similar plugins. In the example above, we can see a number of different split filters being used, but it’s tough to distinguish between them without an ID.
Summing it up
The Pipeline Viewer is meant to act as a parsing profiler of sorts. What it allows you to do is identify and resolve potential parsing bottlenecks — what grok filter is consuming too much CPU, where can an alternative filter be used to do the same parsing with less processing, and so forth.
More on the subject:
It’s can be an extremely useful tool to have, yet does not solve inherent pitfalls in Logstash. As it was not the purpose of the tool, this is fine. But don’t expect the Pipeline Viewer to be a remedy for some of the challenges involved when working with Logstash.

You Might Also Like

Tool Consolidation Is Dead. Long Live Agentic AI.

