
Integrating Logz.io with Wazuh OSSEC for HIDS – Part 2
June 12, 2017
In the previous post, we examined how to set up the integration between Wazuh’s fork of OSSEC and the ELK Stack. The question now is what to do with the data now streaming into Kibana.
Analyzing OSSEC Alerts
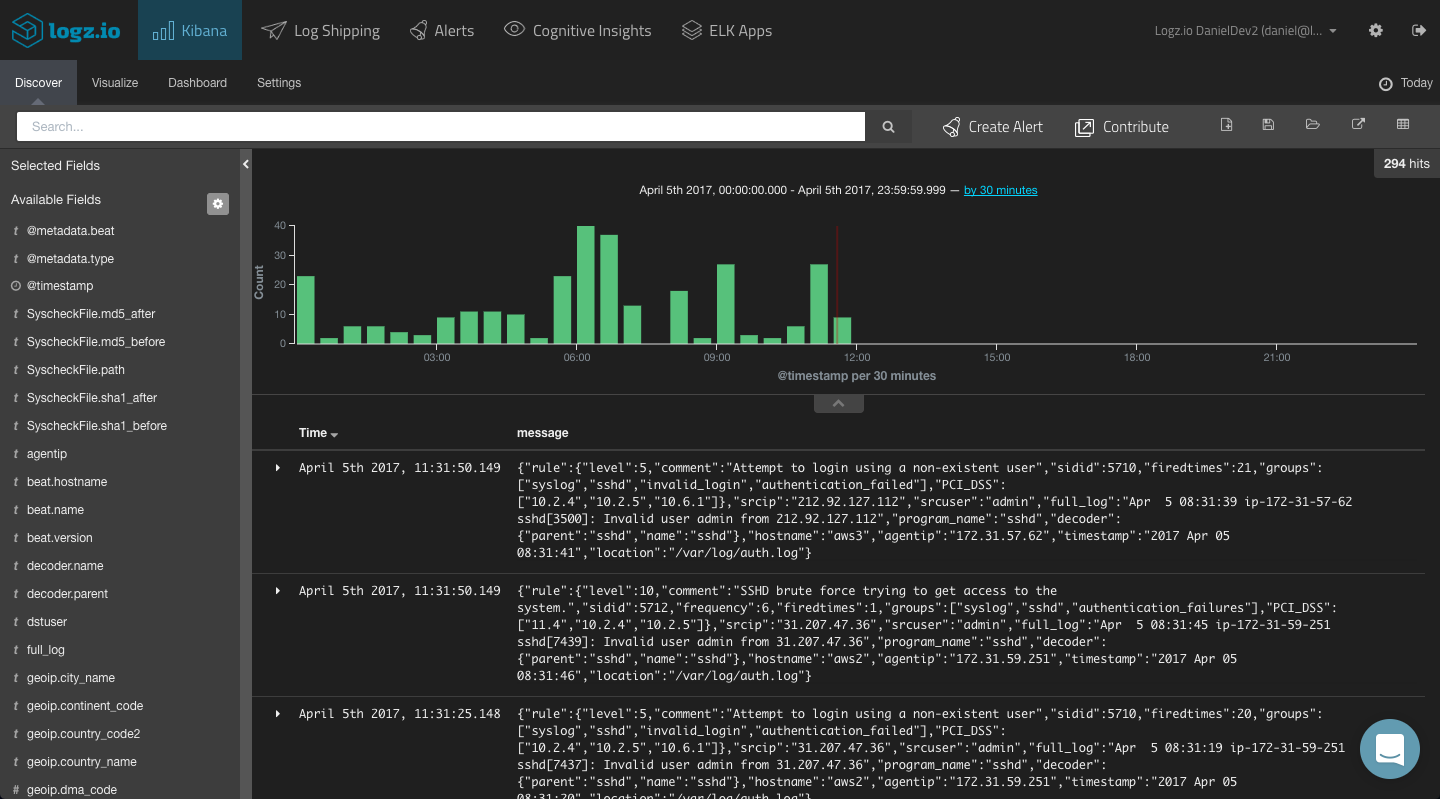
Since the OSSEC alerts are outputted in JSON format, Elasticsearch easily maps the different fields included in the alerts. These fields are displayed on the left side of the Discover page in Kibana.
More on the subject:
To get some visibility into the OSSEC alerts, a first step would be to add some of the available fields to the main display area. This depends on what you would like to analyze, but the most obvious fields to add would be the “rule.xxx” fields (e.g., “rule.comment,” “rule.level,” “rule.groups,” “rule.firedtimes”) and the hostname (the OSSEC agent name).
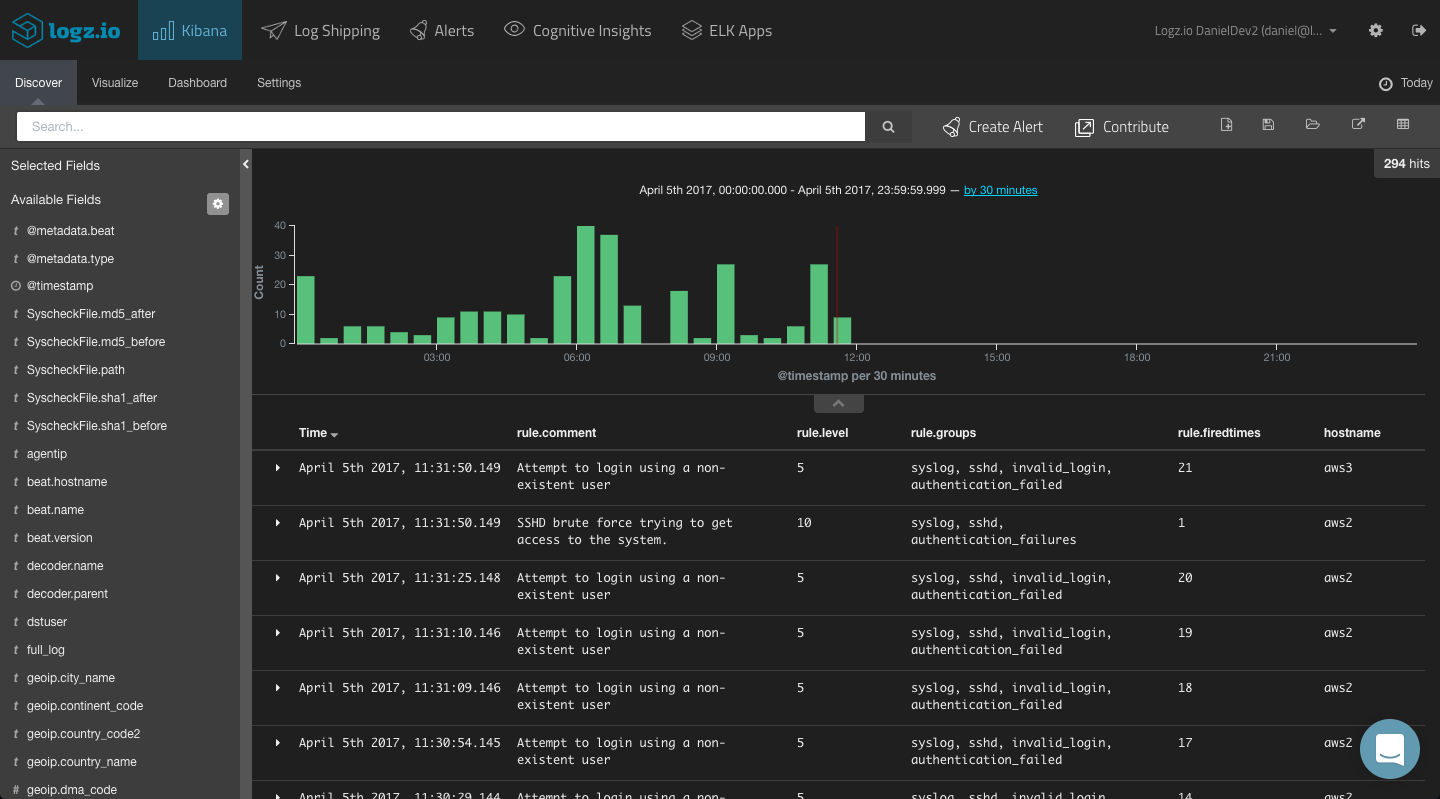
This gives you a better idea of the data you have available and what to analyze. To dive deeper and search for specific alerts, your next step would be to query Kibana.
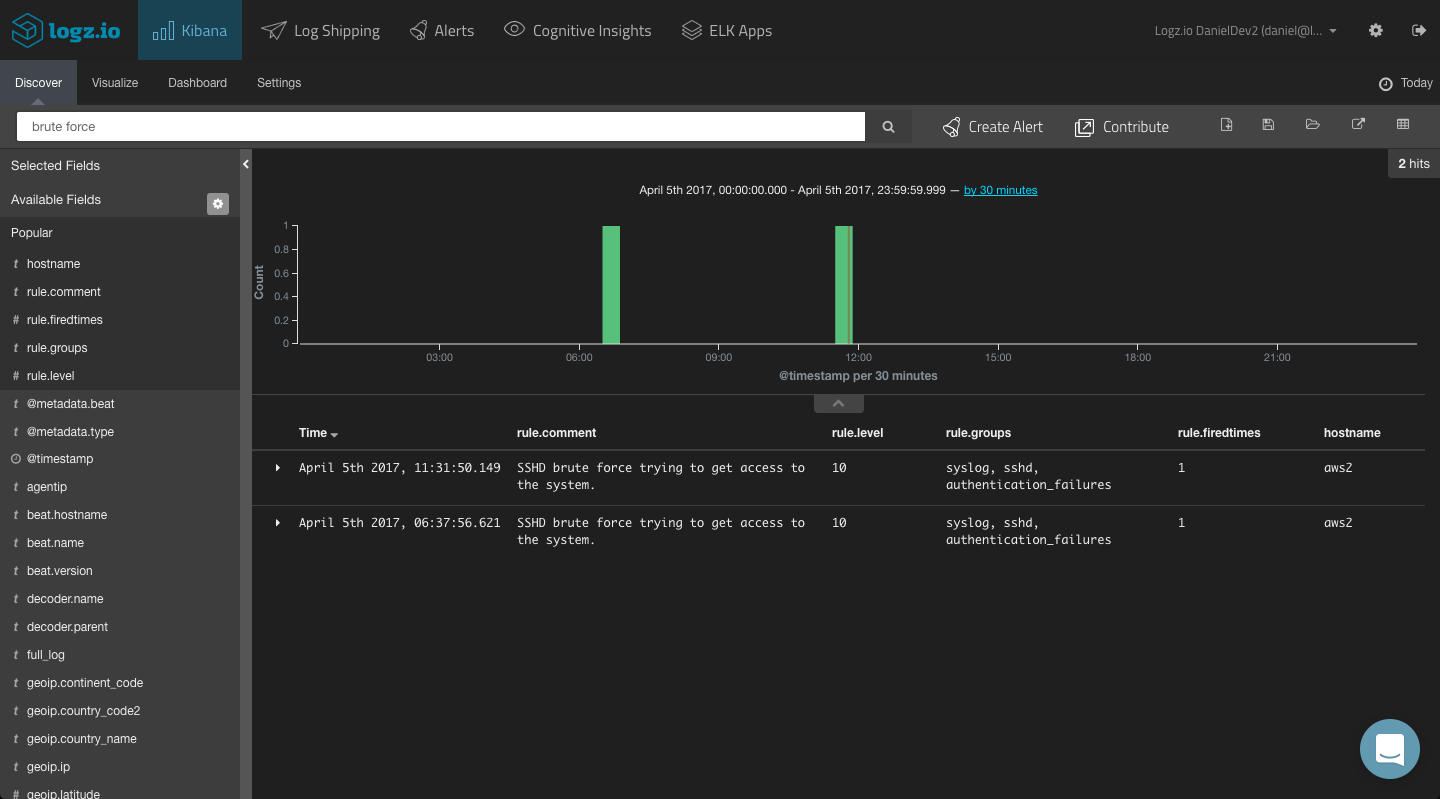
You could start with a free-text search. So if you know what event you are looking for, simply enter it in the search field at the top of the page:
“brute force”
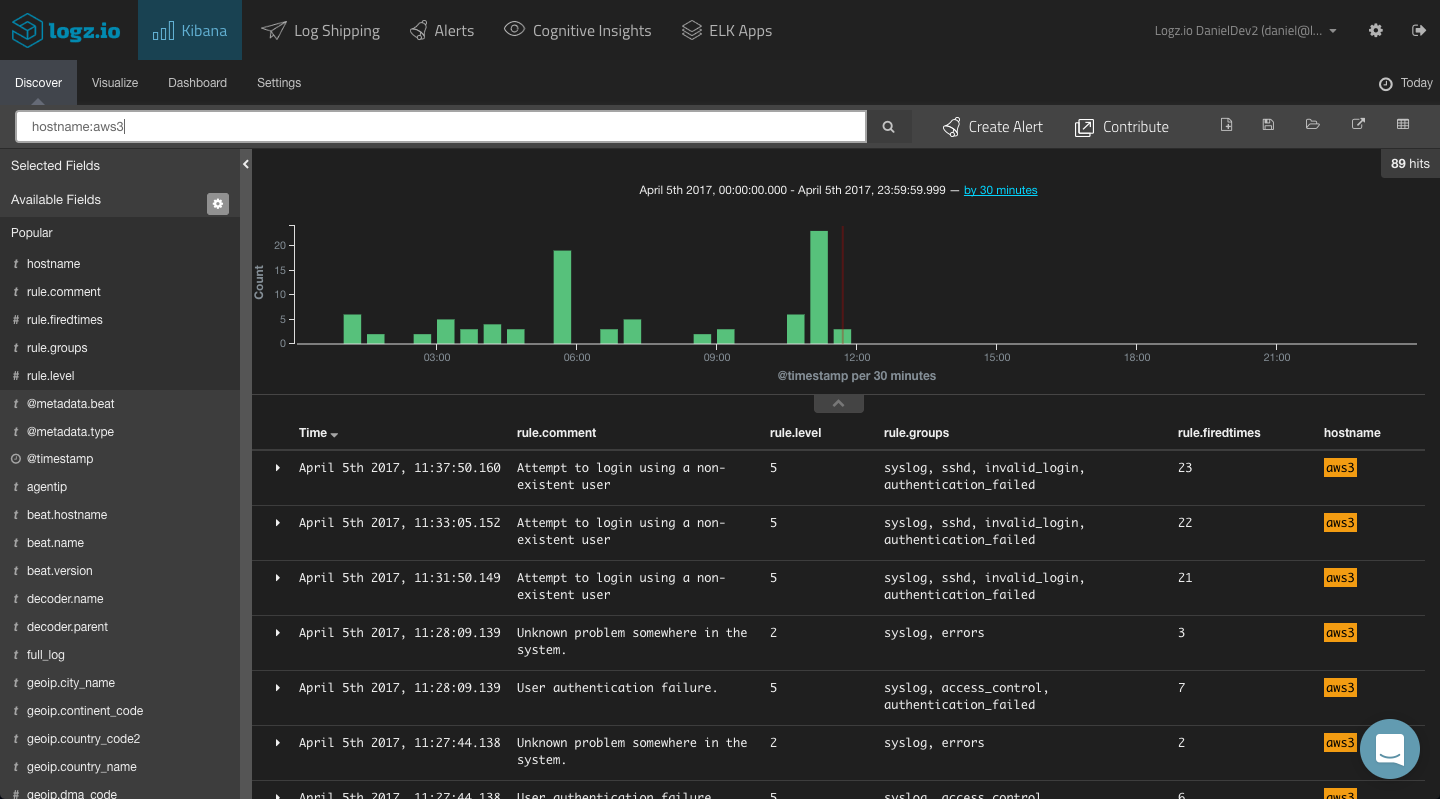
You could, for example, use a field-level search to look for alerts being triggered by a specific agent. For example:
hostname:aws3
You could use a logical statement to search for a combination. For example, say you are looking for only alerts with a rule level of 5 and from a specific agent:
hostname:aws3 AND rule.level:”5”
And so forth.
Kibana supports a wide range of queries, and we cover most of them in this article.
Visualizing OSSEC Alerts
Based on your Kibana queries, you can create your OSSEC visualizations and dashboards. In this section, we will show a few simple examples of how to visualize your OSSEC alerts.
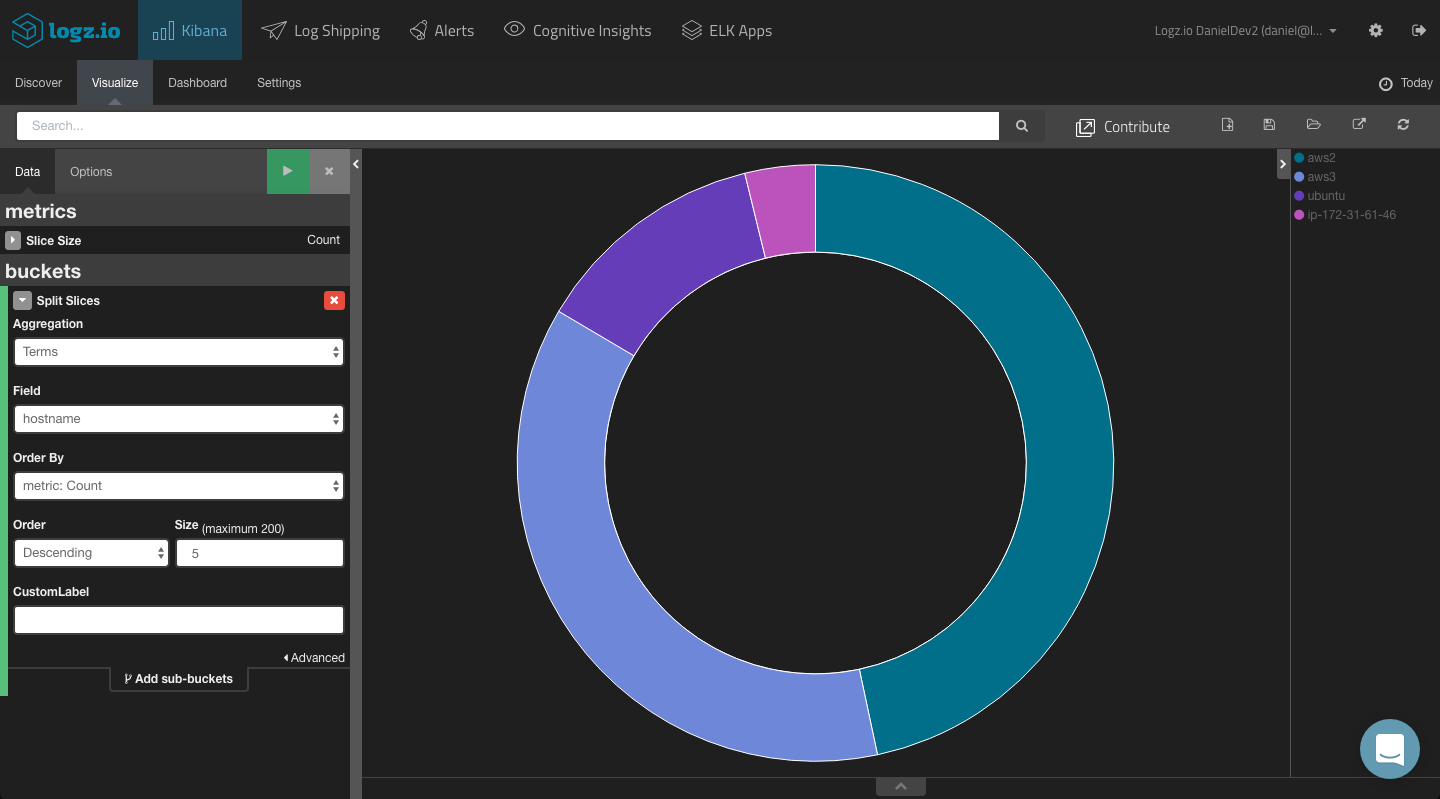
Top OSSEC Agents
For starters, you can visualize a breakdown of the top five OSSEC agents reporting alerts. To do this, we can use a simple pie chart visualization and use a Terms aggregation for the ‘hostname’ field.
The configuration and end result looks as follows:
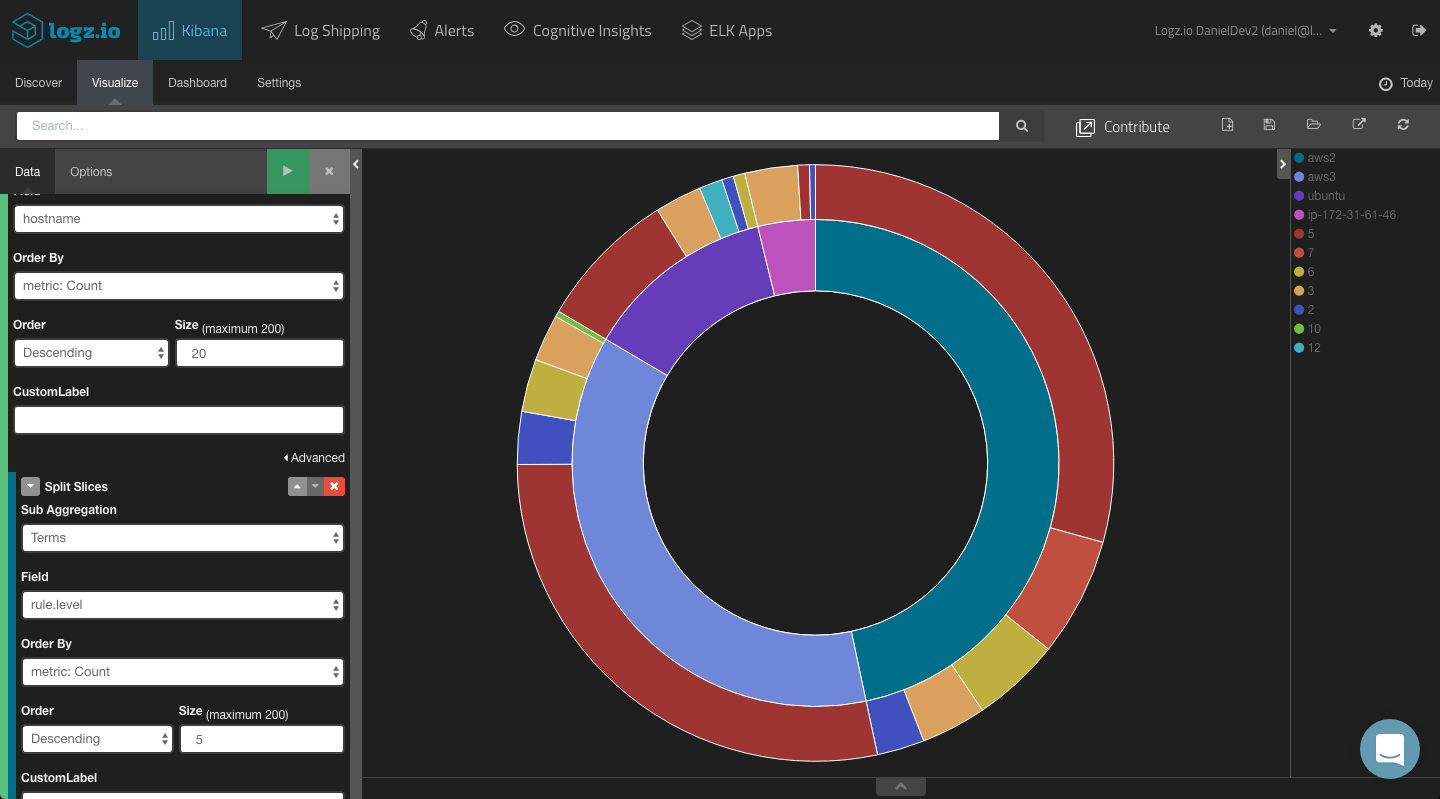
Adding a split slice to the pie chart with a terms aggregation of the ‘rule.level’ field, you will be able to see a breakdown of the different alert levels per agent.
Alerts Over Time
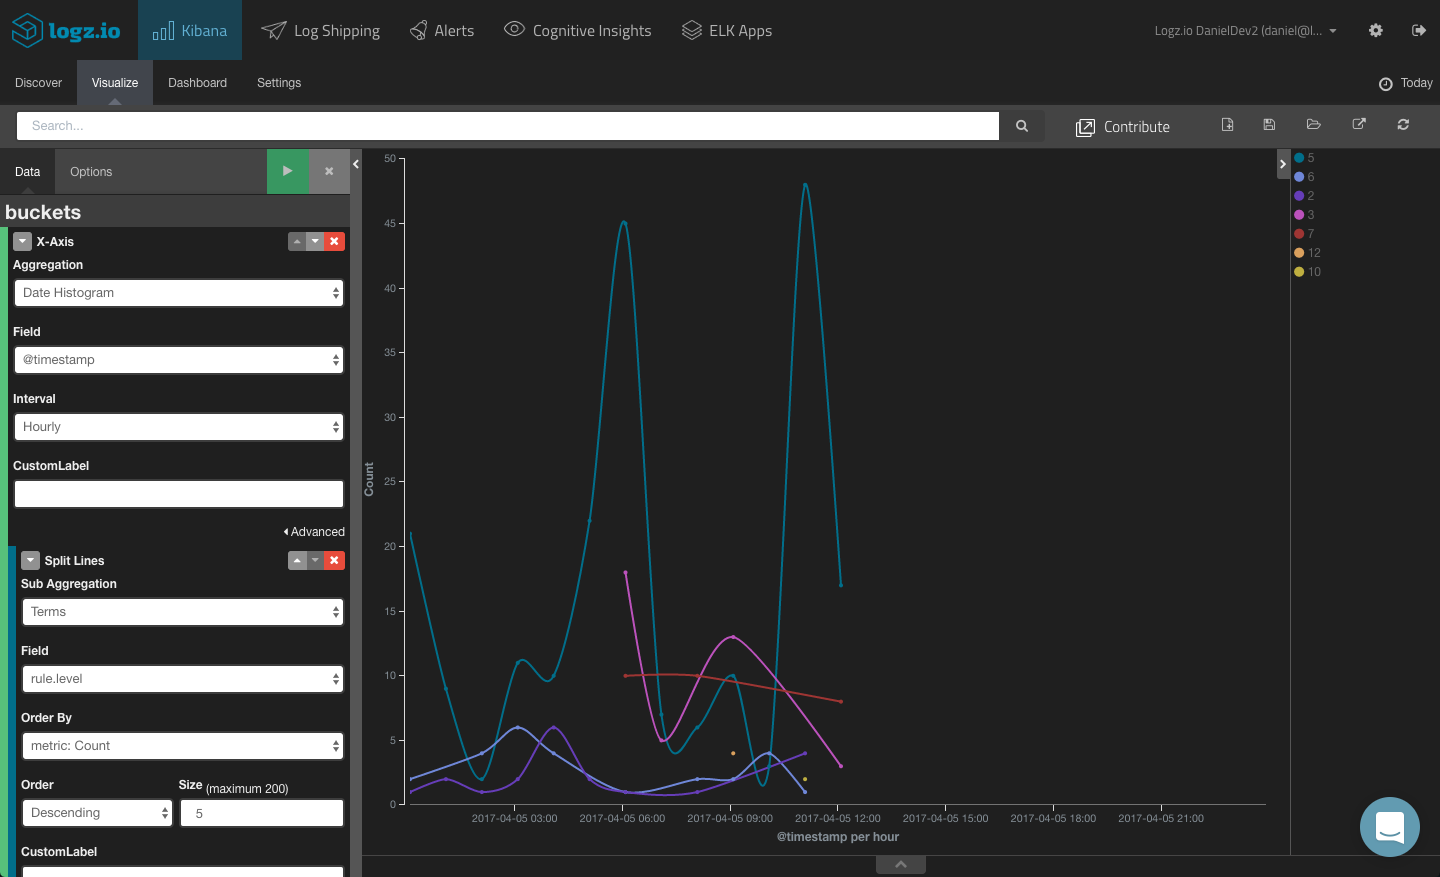
To get a sense of trends over time, you can create a line chart visualization showing different alerts over time.
To do this, we will leave the Y axis with the default definition (simple Count aggregation) and configure the X axis using a Date Histogram aggregation (hourly interval) and a Terms aggregation of the “rules.level” field.
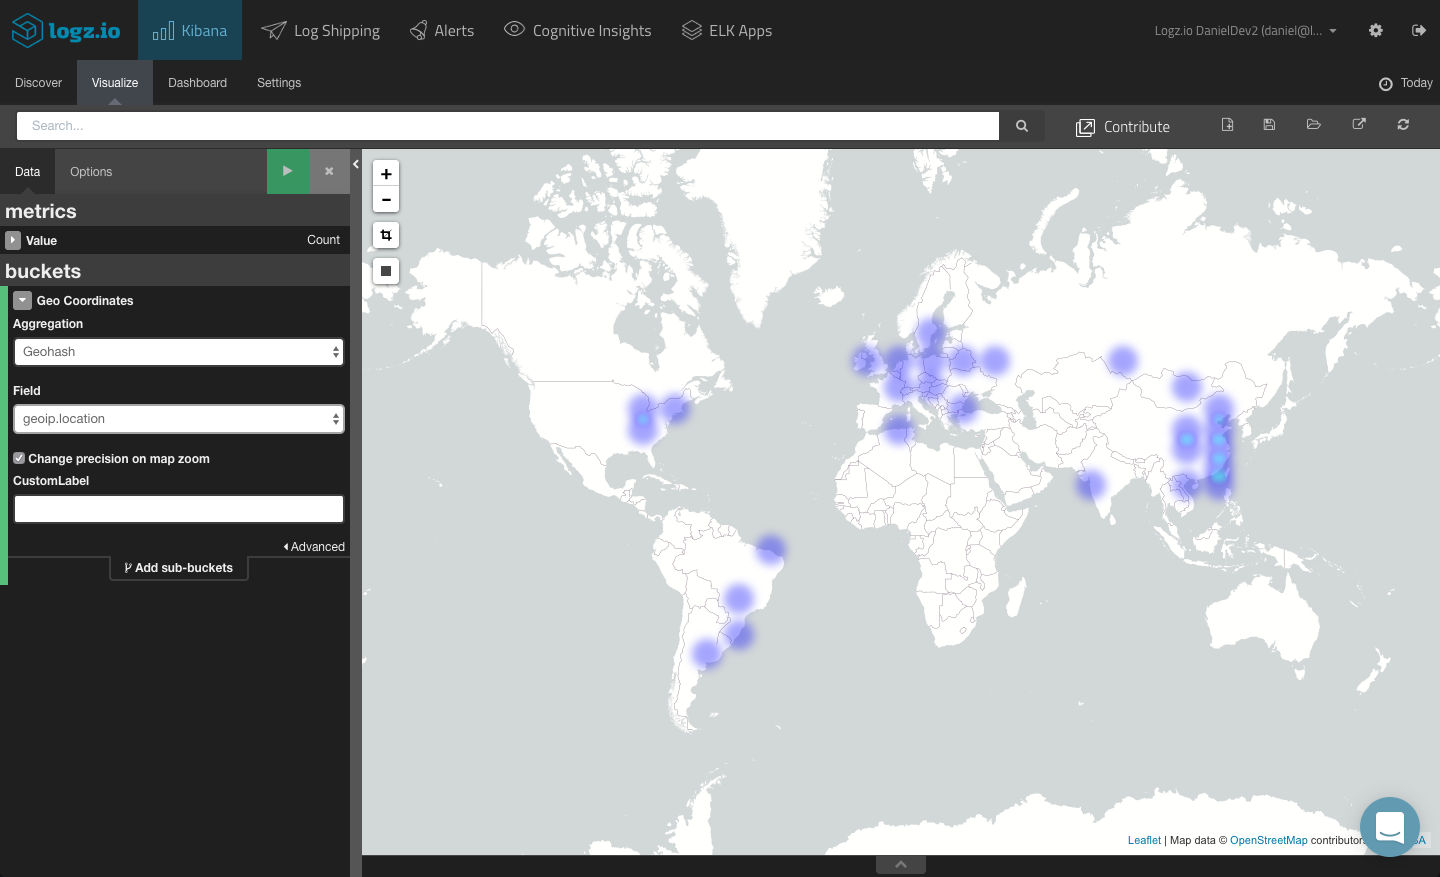
Geographical Map
A more advanced example is creating a geographical depiction based on the “sourceip” field. This will help you understand from where intrusion attempts are originating.
The ability to visualize this field depends on whether you mapped it as a geoip field. If you are using Logz.io, this field will be mapped automatically if you defined the log type as “ossec” in Filebeat. If you are using your own ELK deployment, you will need to use Logstash to map the field correctly.
Once mapped, you can select the TileMap visualization type from the selection of available visualizations and then tweak it accordingly.
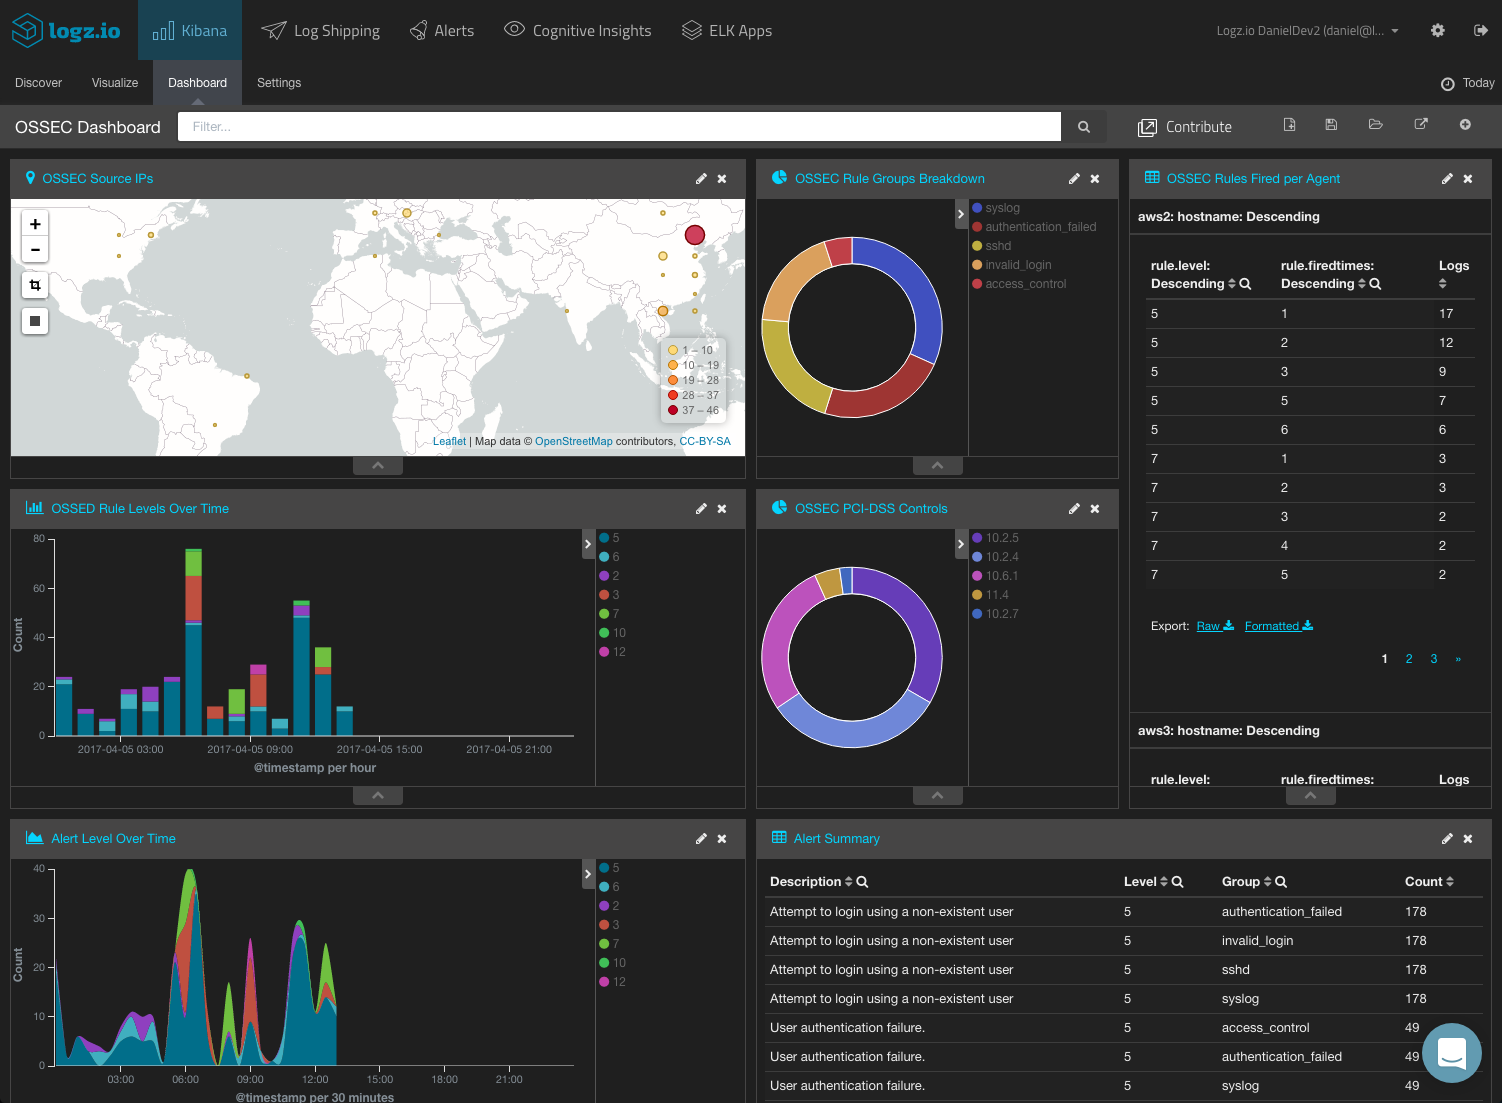
Creating an OSSEC Dashboard
These were just examples of how to visualize the alerts triggered by your OSSEC agents. You can, of course, slice and dice the data in whichever manner you like, depending on your needs and requirements. If, for example, you are interested in PCI-DSS, you will want to visualize the “rule.PC__DSS” field. And so on.
In any case, once you have your visualizations created, your next step towards a building a comprehensive OSSEC monitoring tool will be to compile them into a dashboard.
ELK Apps — the Logz.io library of Kibana searches, alerts, visualizations, and dashboards — includes a readymade dashboard for OSSEC alerts. To install it, simply open ELK Apps, search for ‘ossec’ and install the dashboard.
Final Notes
It is also worth mentioning that Wazuh provides a web app that acts as a management and monitoring dashboard for your Wazuh infrastructure.
Here are some instructions on how to install this plugin when you set up Kibana with Wazuh.
In the next part of the series, we will delve deeper into Logz.io’s alerting mechanism and learn how to get notified of OSSEC events.

You Might Also Like

Logz.io Explore – Overview

