
MongoDB Performance Monitoring Using the ELK Stack
July 11, 2016

MongoDB, one of the most popular NoSQL databases today, is designed to process and store massive amounts of data. The tool is used by many well-known, modern IT organizations such as Facebook, eBay, Foursquare, and Expedia. MongoDB monitoring is a critical component of all database administration, and tight MongoDB cluster monitoring will show the state of your database. However, due to its complex architecture which allows for virtually unlimited scaling, monitoring is a challenging task. In this article, we will explain how to collect and analyze some of the MongoDB logs and metrics using the ELK Stack so that you can keep a close eye on your MongoDB performance and growth.
This article will first cover metrics, then go into greater detail about MongoDB logs. This includes the MongoDB log format, slow operation logs, timestamps, severity, and components.
MongoDB Metrics to Track
In this article, we will use the latest version of MongoDB (version 4.2) and focus on metrics that are available using the WiredTiger storage engine. This has been the MongoDB default storage engine since version 3.2. We will focus on tracking and metric analysis to get an overview of its database performance, resource utilization, and saturation. These are accessible using MongoDB commands.
MongoDB uses five different metricsets (metrics datasets): collstats, dbstats, one simply dubbed metrics, replstatus, and plain ole status.
MongoDB collstats Metricset
This tracks the usage and storage statistics for each collection (count of operations and time by microsecond).
mongodb.collstats.collection
mongodb.collstats.commands.count
mongodb.collstats.commands.time.us
mongodb.collstats.db
mongodb.collstats.getmore.count
mongodb.collstats.getmore.time.us
mongodb.collstats.insert.count
mongodb.collstats.insert.time.us
mongodb.collstats.lock.read.count
mongodb.collstats.lock.read.time.us
mongodb.collstats.lock.write.count
mongodb.collstats.lock.write.time.us
mongodb.collstats.name
mongodb.collstats.queries.count
mongodb.collstats.queries.time.us
mongodb.collstats.remove.count
mongodb.collstats.remove.time.us
mongodb.collstats.total.count
mongodb.collstats.total.time.us
mongodb.collstats.update.count
mongodb.collstats.update.time.us
This includes the following measures of indices as they the system builds them:
mongodb.collStats.indexDetails
mongodb.collStats.indexBuilds
mongodb.collStats.totalIndexSize
mongodb.collStats.nindexes
mongodb.collStats.indexSizes
Run collStats with this command:
{
   collStats: ,
   scale:
}
Note that scale is an optional field, covering the scale factor for size data. In the output, scaleFactor will appear like this:
"scaleFactor" :
MongoDB dbstats Metricset
This default metricset collects info related to the following fields:
mongodb.dbstats.avg_obj_size.bytes
mongodb.dbstats.collections
mongodb.dbstats.data_size.bytes
mongodb.dbstats.db
mongodb.dbstats.file_size.bytes
mongodb.dbstats.index_size.bytes
mongodb.dbstats.indexes
mongodb.dbstats.num_extents
mongodb.dbstats.objects
mongodb.dbstats.storage_size.bytes
mongodb.dbstats.ns_size_mb.mb
mongodb.dbstats.data_file_version.major
mongodb.dbstats.data_file_version.minor
mongodb.dbstats.extent_free_list.num
mongodb.dbstats.extent_free_list.size.bytes
MongoDB metrics Metricset
mongodb.metrics.commands.aggregate.failed
mongodb.metrics.commands.aggregate.total
mongodb.metrics.commands.build_info.failed
mongodb.metrics.commands.build_info.total
mongodb.metrics.commands.coll_stats.failed
mongodb.metrics.commands.coll_stats.total
mongodb.metrics.commands.connection_pool_stats.failed
mongodb.metrics.commands.connection_pool_stats.total
mongodb.metrics.commands.count.failed
mongodb.metrics.commands.count.total
mongodb.metrics.commands.db_stats.failed
mongodb.metrics.commands.db_stats.total
mongodb.metrics.commands.distinct.failed
mongodb.metrics.commands.distinct.total
mongodb.metrics.commands.find.failed
mongodb.metrics.commands.find.total
mongodb.metrics.commands.get_cmd_line_opts.failed
mongodb.metrics.commands.get_cmd_line_opts.total
mongodb.metrics.commands.get_last_error.failed
mongodb.metrics.commands.get_last_error.total
mongodb.metrics.commands.get_log.failed
mongodb.metrics.commands.get_log.total
mongodb.metrics.commands.get_more.failed
mongodb.metrics.commands.get_more.total
mongodb.metrics.commands.get_parameter.failed
mongodb.metrics.commands.get_parameter.total
mongodb.metrics.commands.host_info.failed
mongodb.metrics.commands.host_info.total
mongodb.metrics.commands.insert.failed
mongodb.metrics.commands.insert.total
mongodb.metrics.commands.is_master.failed
mongodb.metrics.commands.is_master.total
mongodb.metrics.commands.is_self.failed
mongodb.metrics.commands.is_self.total
mongodb.metrics.commands.last_collections.failed
mongodb.metrics.commands.last_collections.total
mongodb.metrics.commands.last_commands.failed
mongodb.metrics.commands.last_commands.total
mongodb.metrics.commands.list_databased.failed
mongodb.metrics.commands.list_databased.total
mongodb.metrics.commands.list_indexes.failed
mongodb.metrics.commands.list_indexes.total
mongodb.metrics.commands.ping.failed
mongodb.metrics.commands.ping.total
mongodb.metrics.commands.profile.failed
mongodb.metrics.commands.profile.total
mongodb.metrics.commands.replset_get_rbid.failed
mongodb.metrics.commands.replset_get_rbid.total
mongodb.metrics.commands.replset_get_status.failed
mongodb.metrics.commands.replset_get_status.total
mongodb.metrics.commands.replset_heartbeat.failed
mongodb.metrics.commands.replset_heartbeat.total
mongodb.metrics.commands.replset_update_position.failed
mongodb.metrics.commands.replset_update_position.total
mongodb.metrics.commands.server_status.failed
mongodb.metrics.commands.server_status.total
mongodb.metrics.commands.update.failed
mongodb.metrics.commands.update.total
mongodb.metrics.commands.whatsmyuri.failed
mongodb.metrics.commands.whatsmyuri.total
mongodb.metrics.cursor.open.no_timeout
mongodb.metrics.cursor.open.pinned
mongodb.metrics.cursor.open.total
mongodb.metrics.cursor.timed_out
mongodb.metrics.document.deleted
mongodb.metrics.document.inserted
mongodb.metrics.document.returned
mongodb.metrics.document.updated
mongodb.metrics.get_last_error.write_timeouts
mongodb.metrics.get_last_error.write_wait.count
mongodb.metrics.get_last_error.write_wait.ms
mongodb.metrics.operation.scan_and_order
mongodb.metrics.operation.write_conflicts
mongodb.metrics.query_executor.scanned_documents.count
mongodb.metrics.query_executor.scanned_indexes.count
mongodb.metrics.replication.apply.attempts_to_become_secondary
mongodb.metrics.replication.apply.batches.count
mongodb.metrics.replication.apply.batches.time.ms
mongodb.metrics.replication.apply.ops
mongodb.metrics.replication.buffer.count
mongodb.metrics.replication.buffer.max_size.bytes
mongodb.metrics.replication.buffer.size.bytes
mongodb.metrics.replication.executor.counters.cancels
mongodb.metrics.replication.executor.counters.event_created
mongodb.metrics.replication.executor.counters.event_wait
mongodb.metrics.replication.executor.counters.scheduled.dbwork
mongodb.metrics.replication.executor.counters.scheduled.exclusive
mongodb.metrics.replication.executor.counters.scheduled.failures
mongodb.metrics.replication.executor.counters.scheduled.netcmd
mongodb.metrics.replication.executor.counters.scheduled.work
mongodb.metrics.replication.executor.counters.scheduled.work_at
mongodb.metrics.replication.executor.counters.waits
mongodb.metrics.replication.executor.event_waiters
mongodb.metrics.replication.executor.network_interface
mongodb.metrics.replication.executor.queues.free
mongodb.metrics.replication.executor.queues.in_progress.dbwork
mongodb.metrics.replication.executor.queues.in_progress.exclusive
mongodb.metrics.replication.executor.queues.in_progress.network
mongodb.metrics.replication.executor.queues.ready
mongodb.metrics.replication.executor.queues.sleepers
mongodb.metrics.replication.executor.shutting_down
mongodb.metrics.replication.executor.unsignaled_events
mongodb.metrics.replication.initial_sync.completed
mongodb.metrics.replication.initial_sync.failed_attempts
mongodb.metrics.replication.initial_sync.failures
mongodb.metrics.replication.network.bytes
mongodb.metrics.replication.network.getmores.count
mongodb.metrics.replication.network.getmores.time.ms
mongodb.metrics.replication.network.ops
mongodb.metrics.replication.network.reders_created
mongodb.metrics.replication.preload.docs.count
mongodb.metrics.replication.preload.docs.time.ms
mongodb.metrics.replication.preload.indexes.count
mongodb.metrics.replication.preload.indexes.time.ms
mongodb.metrics.storage.free_list.search.bucket_exhausted
mongodb.metrics.storage.free_list.search.requests
mongodb.metrics.storage.free_list.search.scanned
mongodb.metrics.ttl.deleted_documents.count
mongodb.metrics.ttl.passes.count
Run dbStats with the following command:
db.runCommand( {
   dbStats: 1,
   scale:
} )
MongoDB replstatus Metricset
The MongoDB replstatus metricset provides metrics on MongoDB replica set status. Note that oplog comes out of db.getReplicationInfo().
mongodb.replstatus.oplog.size.allocated
mongodb.replstatus.oplog.size.used
mongodb.replstatus.oplog.first.timestamp
mongodb.replstatus.oplog.last.timestamp
mongodb.replstatus.oplog.window
mongodb.replstatus.set_name
mongodb.replstatus.server_date
mongodb.replstatus.optimes.last_committed
mongodb.replstatus.optimes.applied
mongodb.replstatus.optimes.durable
mongodb.replstatus.lag.max
mongodb.replstatus.lag.min
mongodb.replstatus.headroom.max
mongodb.replstatus.headroom.min
mongodb.replstatus.members.primary.host
mongodb.replstatus.members.primary.optime
mongodb.replstatus.members.secondary.hosts
mongodb.replstatus.members.secondary.optimes
mongodb.replstatus.members.secondary.count
mongodb.replstatus.members.recovering.hosts
mongodb.replstatus.members.recovering.count
mongodb.replstatus.members.unknown.hosts
mongodb.replstatus.members.unknown.count
mongodb.replstatus.members.startup2.hosts
mongodb.replstatus.members.startup2.count

mongodb.replstatus.members.arbiter.hosts

mongodb.replstatus.members.arbiter.count

mongodb.replstatus.members.down.hosts

mongodb.replstatus.members.down.count

mongodb.replstatus.members.rollback.hosts

mongodb.replstatus.members.rollback.count

mongodb.replstatus.members.unhealthy.hosts

mongodb.replstatus.members.unhealthy.count
mongodb.replstatus.oplog.size.allocated
mongodb.replstatus.oplog.size.used
mongodb.replstatus.oplog.first.timestamp
mongodb.replstatus.oplog.last.timestamp
mongodb.replstatus.oplog.window #Difference between first and last operations in replstatus.
mongodb.replstatus.set_name
mongodb.replstatus.server_date
mongodb.replstatus.optimes.last_committed
mongodb.replstatus.optimes.applied
mongodb.replstatus.optimes.durable #Info on the most recent operation written to the journal of this replica set
mongodb.replstatus.lag.max #Difference between optime of primary and slowest secondary
mongodb.replstatus.lag.min #Difference between optime of primary and fastest secondary
mongodb.replstatus.headroom.max #Difference between primary’s oplog window and the replication lag of the fastest secondary
mongodb.replstatus.headroom.min #Difference between primary’s oplog window and the replication lag of the slowest secondary
mongodb.replstatus.members.primary.host
mongodb.replstatus.members.primary.optime
mongodb.replstatus.members.secondary.hosts
mongodb.replstatus.members.secondary.optimes
mongodb.replstatus.members.secondary.count
mongodb.replstatus.members.recovering.hosts
mongodb.replstatus.members.recovering.count
mongodb.replstatus.members.unknown.hosts
mongodb.replstatus.members.unknown.count
mongodb.replstatus.members.startup2.hosts
mongodb.replstatus.members.startup2.count
mongodb.replstatus.members.arbiter.hosts
mongodb.replstatus.members.arbiter.count
mongodb.replstatus.members.down.hosts
mongodb.replstatus.members.down.count
mongodb.replstatus.members.rollback.hosts
mongodb.replstatus.members.rollback.count
mongodb.replstatus.members.unhealthy.hosts
mongodb.replstatus.members.unhealthy.count
MongoDB status metricset
Over the course of recent minor releases, there have been several metrics updates. New metrics include 1) how often shards have inconsistent indices; 2) how often nodes call elections; 3) and new metrics or fields:
metrics.aggStageCounters (field)
metrics.repl.network.notMasterLegacyUnacknowledgedWrites (field)
metrics.repl.network.notMasterUnacknowledgedWrites (field)
metrics.repl.stepDown.userOperationsKilled (metric)
metrics.repl.stepDown.userOperationsRunning (metric)
shardingStatistics.countDocsClonedOnRecipient (field)
shardingStatistics.countDocsClonedOnDonor (field)
shardingStatistics.countDocsDeletedOnDonor (field)
shardingStatistics.countRecipientMoveChunkStarted (field)
shardingStatistics.countDonorMoveChunkLockTimeout (field)
MongoDB Metrics Commands
Throughput
MongoDB (with WiredTiger storage engine) provides several commands that can be used to collect metrics using mongo shell. Mongo shell is an interactive JavaScript interface for MongoDB that allows you to query data and take administrative actions.
One of the rich commands that provides a lot of information about items including operations, connections, journaling, background flushing, memory, locking, asserts, cursors, and cache is the serverStatus (i.e., db.serverStatus()).
These throughput metrics are important since they can be used to avoid many performance issues, such as resource overloading. To get a general overview of your MongoDB cluster activities, you should first look at number of read/write clients and the number of db operations that they perform. These metrics can be retrieved using serverStatus opcounters and globalLock objects.
The objects’ output is in JSON, such as show in the example below:
….
"opcounters": {
      "insert": 0,
      "query": 1,
      "update": 12,
      "delete": 5,
      "getmore": 0,
      "command": 23
}
….
The opcounters part of the serverStatus output
Opcounters.query and opcounters.getmore commands return metrics that indicate the number of read requests received from the time the mongod (a process that handles data requests and manages data access) instance last began. On the other hand, opcounters.insert, opcounters.update, and opcounters.delete return the number of write requests received.
By monitoring the number of read and write requests, you can quickly prevent resource saturation as well as spot bottlenecks and the root cause of overloads. In addition, these metrics will allow you to assess when and how you need to scale your cluster.
As shown above, globalLock is a document that reports on the database’s lock state and can provide you with information regarding read/write request statuses. These will allow you to check if requests are accumulating faster than they are being processed. The same applies to activeClients.readers and activeClients.writers. These can enable you to learn about the relationship between the amount of current active clients and your database load.
"globalLock": {

   "totalTime": NumberLong(254415000),

   "currentQueue": {
      "total": 0,
      "readers": 0,
      "writers": 0
   },

   "activeClients": {
      "total": 8,
      "readers": 0,
      "writers": 0
   }
}
…
The globalLock part of the serverStatus output
Performance and Failover
Using a replica set (a master-slave replication that facilitates load balancing and failover) is a must to ensure your production robustness. The oplog (operations log) is the main component of the MongoDB replication mechanism. Below, you can see the relevant metrics that can be retrieved using the getReplicationInfo and replSetGetStatus commands. Note that mongodump and mongorestore cannot be used to back up sharded clusters as of v4.2.
As shown below, replica set member statuses are composed of a few indications such as the replica state and optimeDate field, which is important for calculating the replication lag metric that contains the date when the last entry from the oplog is applied to that member):
"members" : [
   {
      "_id" : 0,
      "name" : "<HOST1>",
      "health" : 1,
      "state" : 1,
      "stateStr" : "PRIMARY",
      "uptime" : 250,
      "optime" : {
         "ts" : Timestamp(1447946570, 1),
         "t" : NumberLong(1)
         },
      "optimeDate" : <DATE>,
      "infoMessage" : "could not find member to sync from",
      "electionTime" : <TIMESTAMP>,
      "electionDate" : <DATE>,
      "configVersion" : 1,
      "self" : true
   },
   {
      "_id" : 1,
      "name" : "<HOST2>",
      "health" : 1,
      "state" : 2,
      "stateStr" : "SECONDARY",
      "uptime" : 13,
      "optime" : {
         "ts" : Timestamp(1447946549, 1),
         "t" : NumberLong(-1)
         },
      "optimeDate" : <DATE>,
      "lastHeartbeat" : <DATE>,
      "lastHeartbeatRecv" : <DATE>,
      "pingMs" : NumberLong(0),
      "configVersion" : 1
},
{
      "_id" : 2,
      "name" : "<HOST2>",
      "health" : 1,
      "state" : 2,
      "stateStr" : "SECONDARY",
      "uptime" : 13,
      "optime" : {
         "ts" : Timestamp(1447946549, 1),
         "t" : NumberLong(-1)
         },
      "optimeDate" : <DATE>,
      "lastHeartbeat" : <DATE>,
      "lastHeartbeatRecv" : <DATE>,
      "pingMs" : NumberLong(0),
      "configVersion" : 1
   }
]
The member part of the replSetGetStatus output
Replication lag is used to show the difference between the primary and secondary. Since you want to avoid serving outdated information, it’s important to keep the difference between the two as narrow as possible. If you lack any existing load issues, your replication lag will be zero. This is ideal. However, if the number rises for your secondary nodes, the integrity of your data is at risk. To avoid such events, we recommend setting alerts on these metrics so that you can constantly monitor your replica status. Learn more about replication lag here.
Resource utilization
One of the most important metrics is the number of client connections. This includes current active connected clients and the unused connections as well. These can be reported using serverStatus:
"connections": {
   "current": 1,
   "available": 818,
   "totalCreated": NumberLong(4)
}
The connections part of the serverStatus output
An unexpected rise in the client connections metric can occur if the connection is not handled well or if there is an issue inside of the MongoDB driver that is used for handling the connection. Tracking the behavior of these metrics will allow you to set the relevant summary metrics such as the average amount as alerts’ thresholds.
Another set of very important metrics is related to storage. These can be be retrieved using the db.stats() command, which will return statistics for the selected database. Running it using the Mongo shell to get statistics on the database test_mongo_db looks like this:
mongo test_mongo_db --eval "db.stats()"
The next JSON snippet is from the db.stats output:
{
   "db": "test",
   "collections": 1,
   "objects": 1,
   "avgObjSize": 40,
   "dataSize": 40,
   "storageSize": 4096,
   "numExtents": 0,
   "indexes": 1,
   "indexSize": 4096,
   "fileSize": 0,
   "ok": 1
}
Example of db.stats output
If you look inside the output of db.stats command, you will find (similar to the example above) metrics for the number of objects (documents) within all of the collections (collections property in the output), the size of all documents (dataSize property in bytes), the size of all indexes (indexSize property, in bytes) and total amount of space allocated to collections in this database for document storage.
MongoDB monitoring should covering the dataSize, indexSize or storageSize metrics. They will show physical memory allocation changes and help keep clusters healthy with enough storage for databases. However, a large drop in dataSize can also indicate there are many requested deletions, which you should investigate to confirm they are legit operations.
The following metrics that should be monitored are the memory metrics using serverStatus. The interested tuple of metrics is virtual memory usage, which is located in the mem.virtual property (in MB), and the amount of memory used by the database, which is located in the mem.resident property (in MB). Similar to the storage metrics, memory metrics are important to monitor because overloading RAM memory within your server(s) is never good. This can lead to the slowing or crashing of your server, which will leave your cluster weakened. Or, even worse, if you have only one dedicated server, MongoDB can dramatically slow down or even crash.
Another important set of metrics is located in the extra_info.page_faults property of the serverStatus output: the number of page faults or the number of times MongoDB failed to get data from the disk.
"mem": {
   "bits": 64,
   "resident": 82,
   "virtual": 245,
   "supported": true,
   "mapped": 0,
   "mappedWithJournal": 0

}
"extra_info": {
   "note": "fields vary by platform",
   "heap_usage_bytes": 59710000,
   "page_faults": 1
}
The mem and extra_info part of the serverStatus output
Collecting and Monitoring Using ELK
In this section, we will described how to ship, store, and monitor your MongoDB performance metrics detailed above using the Logz.io ELK Stack.
We will use the Ubuntu Server 16.04 on Amazon cloud. You can also read our step-by-step article if you would like to know how to install and configure the ELK stack on Amazon cloud.
Extracting the MongoDB Metrics
In the next step, we will demonstrate how to ship metrics to Elasticsearch with Logstash. Using some programming to retrieve metrics will give you better control and allow you to run complex pre-shipping actions.
To ship logs, we will create a Logstash configuration file with the input path, including how to interpret it and where to send it. Learn more about Logstash configuration here.
Before we create the Logstash configuration file, we will describe how to retrieve the MongoDB metrics specifically — using the mongo shell interface via the bash of your OS.
If we want to execute the serverStatus command via our terminal, without staying in the mongo shell program, we can use --eval flag of the mongo shell program as follows:
mongo --eval "db.serverStatus()"
And the output:
MongoDB shell version: 4.2.6

Connection to: <db>

{
   <the JSON objects>
}
The output format from the serverStatus command
As you can see, the first two lines of the output contain information about the MongoDB shell version and to which database the shell is currently connected. Since this format does not comply with strict JSON rules and complicates our Logstash configuration file, we will use the pipeline approach to cut off the first two lines of the output with the tail command.
So, our command will look like this:
mongo --eval 'db.serverStatus()' | tail -n +3
Now, the output file will only contain the JSON part.
Next, we want to remove the NumberLong(x) and ISODate(x) from the JSON file. Again, sending these to Logstash will trigger a JSON parsing exception, and storing in Elasticsearch will fail. To transform the stream of the text, we will use the sed command with a regex pattern that will find NumberLong and ISODate data types. It will then replace it with the arguments that exist inside these data types:
{

   ….

   "localTime": ISODate("2016-06-23T16:43:19.105Z"),

   …

   "connections": {

      ….

      "totalCreated": NumberLong(62)

      …

   }

}
The example of the serverStatus ouput with NumberLong and ISODate data types
Now, using the pipeline command and adding the piece for transforming the text, the final command will look as follows:
mongo --eval 'db.serverStatus()' | tail -n +3 | sed 's/\(NumberLong([[:punct:]]\?\)\([[:digit:]]*\)\([[:punct:]]\?)\)/\2/' | sed 's/\(ISODate(\)\(.*\)\()\)/\2/'
Running this command will generate a pure JSON file without the MongoDB metadata.
In addition to the serverStatus command, we will also use the db.stats() command to gather storage metrics for specific databases. For the purpose of this tutorial, we created two databases for which we want to monitor storage allocation with the names test_mongo_db_1 and test_mongo_db_2.
Again, we will use the commands for gathering storage statistics for these two databases together with pipeline and tail commands to comply with the JSON formatting rules:
mongo test_mongo_db_1 --eval "db.stats()" | tail -n +3

mongo test_mongo_db_2 --eval "db.stats()" | tail -n +3
Configuring Logstash
Next, we will take the created commands from above and place them in the Logstash configuration file (logstash.config) using the exec input plugin. To forward the data to Elasticsearch, we will use the Elasticsearch output plugin:
input {
   exec {
      command => "mongo --eval 'db.serverStatus()' | tail -n +3 | sed 's/\(NumberLong([[:punct:]]\?\)\([[:digit:]]*\)\([[:punct:]]\?)\)/\2/' | sed 's/\(ISODate(\)\(.*\)\()\)/\2/'"
      interval => 7
      type => "db.serverStatus"
   }
   exec {
      command => "mongo test_mongo_db_1 --eval 'db.stats()' | tail -n +3"
      interval => 7
      type => "db.test_mongo_db_1.stats"
   }

   exec {
      command => "mongo test_mongo_db_2 --eval 'db.stats()' | tail -n +3"
      interval => 7
      type => "db.test_mongo_db_2.stats"
   }
}

filter {
   json {
      source => "message"
   }
}

output {
   elasticsearch {
      hosts => ["localhost:9200"]
   }
}
The Logstash configuration for getting MongoDB metrics and sending it to the Elasticsearch
We’re now going to start the Logstash configuration using the next command:
./bin/logstash -f logstash.config
After a short while, you will begin to receive the first MongoDB metrics via Logstash.
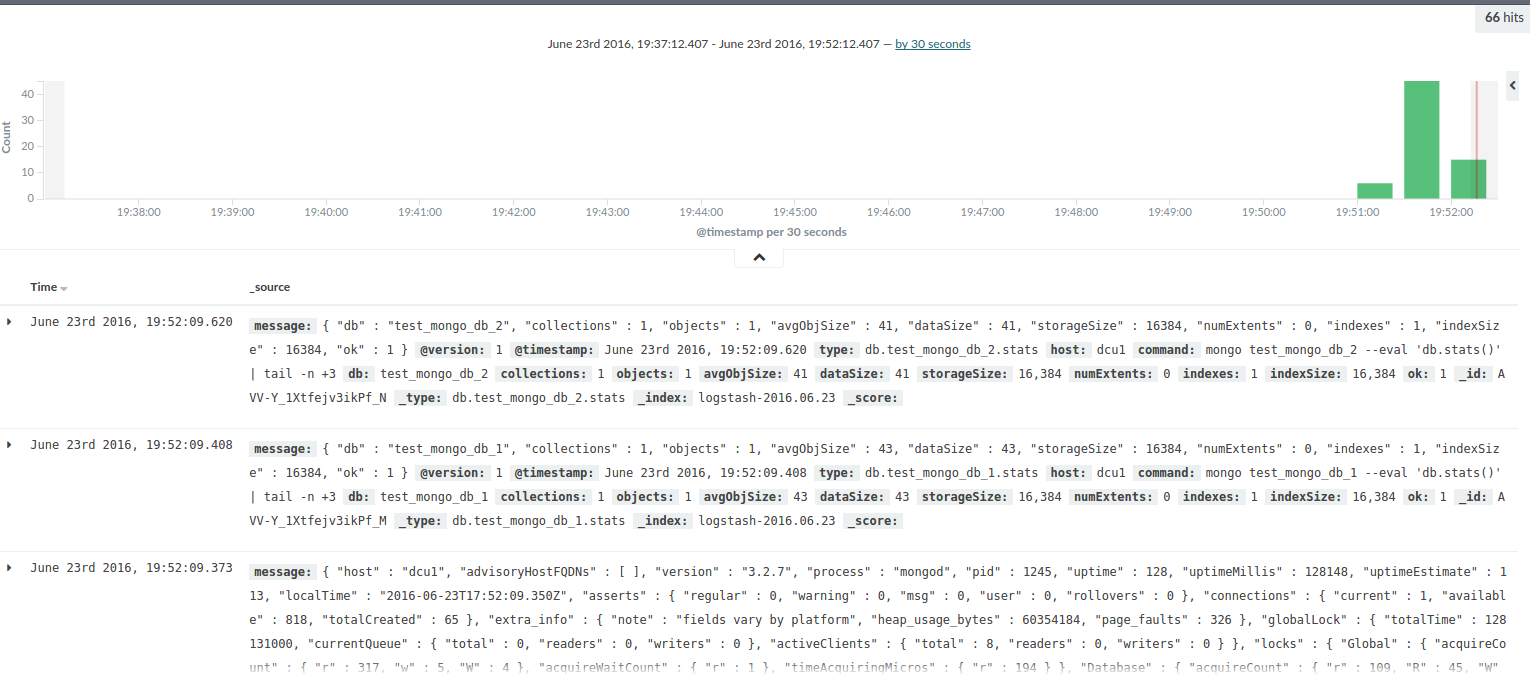
Discover section of Kibana after short time of waiting until Logstash start with sending metrics to the Elasticsearch
Shipping MongoDB Logs to Elasticsearch using Filebeat and Logstash
The general MongoDB log format when output is to the log file or to the console is such:
{timestamp} {severity} {component} [{context}] {message}
Example:
2014-11-03T18:28:32.450-0500 I NETWORK [initandlisten] waiting for connections on port 27017
Note that some MongoDB log formats changed with MongoDB 4.2.
Shipping MongoDB Logs using Filebeat
First, configure the MongoDB module for Filebeat in filebeat/modules.d/mongodb.yml:
filebeat.modules:
- module: mongodb
  log:
    enabled: true
    var.paths: ["/path/to/log/mongodb/*.log*"]
Or, from the command line:
-M "mongodb.log.var.paths=[/path/to/log/mongodb/*.log*]"
For a more complete configuration of Filebeat and filebeat.yml, visit our Filebeat tutorial. If you do forward MongoDB logs via Filebeat to Logstash, ensure Logstash is the output:
output.logstash:
  hosts: ["localhost:5044"]
Shipping to Logz.io Using Logstash
Logz.io provides the ELK Stack as an end-to-end service so that the logs that you send to us are indexed and stored in Elasticsearch and available in real-time through Kibana.
While we support a wide range of techniques for shipping the logs (available under the Log Shipping section in the UI), in the next section I will explain how to use our Logstash integration to ship MongoDB logs into Logz.io.
In the Logz.io UI, select the Log Shipping tab located at the top of the page, and under the Platforms menu on the left, select the Logstash item.
On the right, you will see what needs to be added to the current Logstash configuration to send logs to Logz.io. Two additional changes are required: One is adding token through the filter plugin, and the second is changing the output, where the elasticsearch output is replaced with tcp pointing to the listener.logz.io server in charge of processing incoming logs.
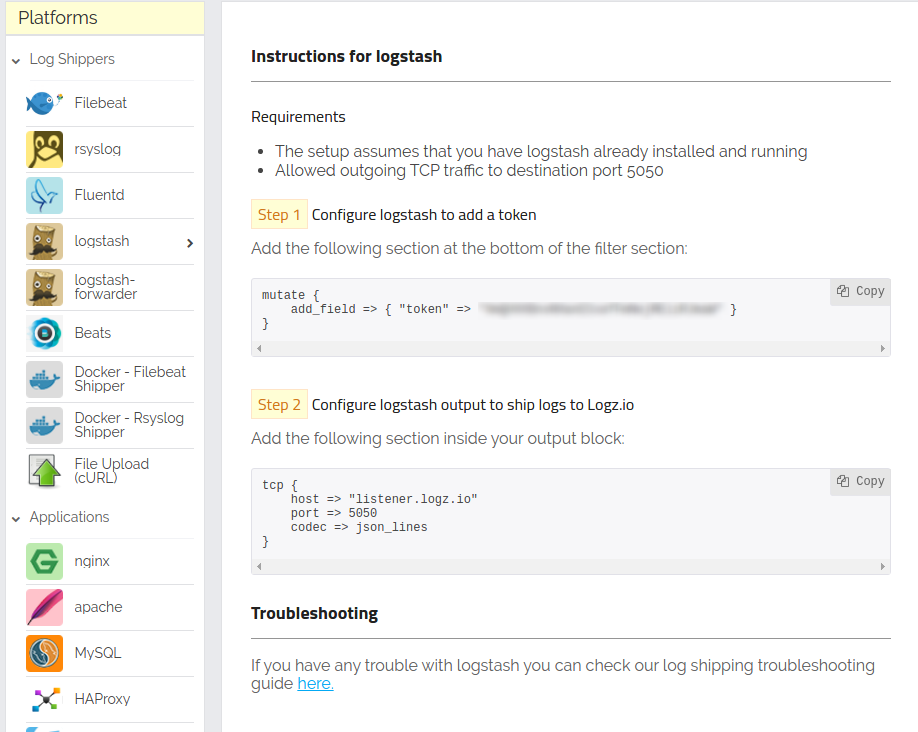
The Logstash shipping page for Logz.io, for MongoDB logs and metrics
After adding these changes, the Logstash configuration file for shipping logs to Logz.io looks like this:
input {
   exec {
      command => "mongo --eval 'db.serverStatus()' | tail -n +3 | sed 's/\(NumberLong([[:punct:]]\?\)\([[:digit:]]*\)\([[:punct:]]\?)\)/\2/' | sed 's/\(ISODate(\)\(.*\)\()\)/\2/'"
      interval => 7
      type => "db.serverStatus"
   }

   exec {
      command => "mongo test_mongo_db_1 --eval 'db.stats()' | tail -n +3"
      interval => 7
      type => "db.test_mongo_db_1.stats"
   }

   exec {
      command => "mongo test_mongo_db_2 --eval 'db.stats()' | tail -n +3"
      interval => 7
      type => "db.test_mongo_db_2.stats"
   }

}
filter {
   json {
      source => "message"
   }
   mutate {
      add_field => {"token" => "<TOKEN>"}
   }
}

output {
   tcp {
      host => "listener.logz.io"
      port => 5050
      codec => json_lines
   }
}
Logstash configuration file for shipping the logs to Logz.io
After starting Logstash with the new configuration file, you will notice that logs will begin to appear in the Discover section within the Logz.io UI.
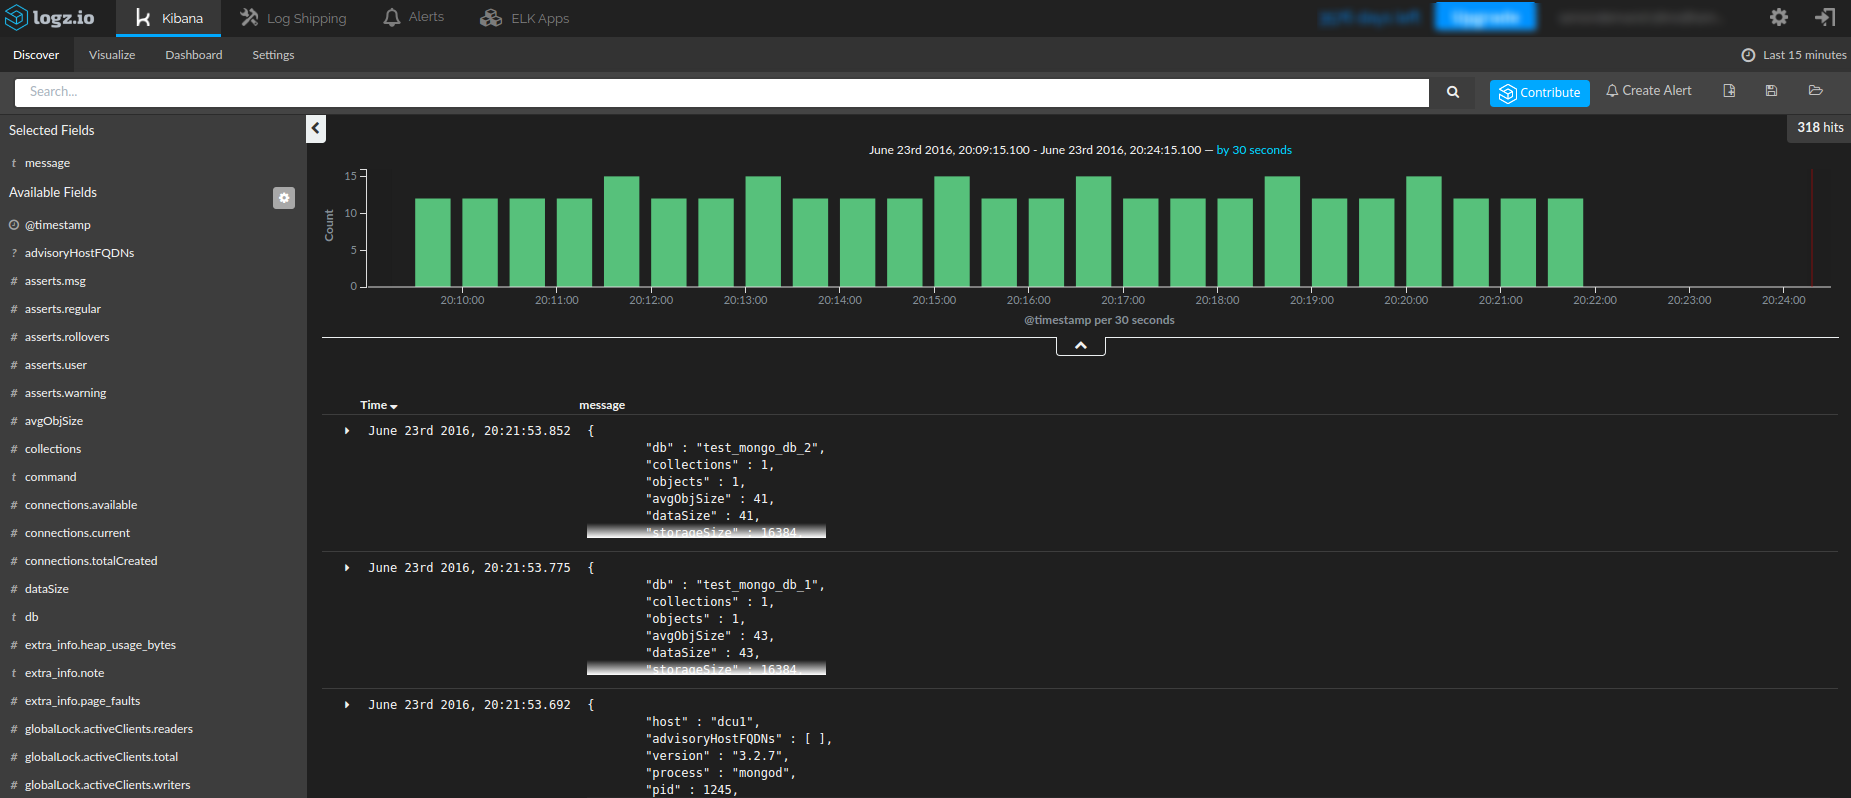
The Logz.io Discover section after starting a new Logstash configuration
Shipping to Logz.io Using Amazon S3
Another way to ship logs into Logz.io is with AWS S3. You would first need to create the log files themselves from the MongoDB command output, and then use the AWS CLI to sync with an S3 bucket.
Creating the log files
In the previous section, we used the pipeline command to execute and filter command output. The next step is to redirect this output to the file.
First, we will create a new log file:
mongo --eval 'db.serverStatus()' | tail -n +3 | sed 's/\(NumberLong([[:punct:]]\?\)\([[:digit:]]*\)\([[:punct:]]\?)\)/\2/' | sed 's/\(ISODate(\)\(.*\)\()\)/\2/' >> mongo_server_status_$(date +"%Y-%m-%d-%H")
Next, we will do the same for the command that generates the database stats:
mongo test_mongo_db_1 --eval 'db.stats()' | tail -n +3 >> mongo_test_mongo_db_1_stats_$(date +"%Y-%m-%d-%H")

mongo test_mongo_db_2 --eval 'db.stats()' | tail -n +3 >> mongo_test_mongo_db_2_stats_$(date +"%Y-%m-%d-%H")
We can now use these commands for periodic cron jobs to take charge of collecting the logs in a periodic manner.
Syncing with S3 and shipping to Logz.io
Logz.io supports shipping from S3 natively. In the Logz.io UI, open the Log Shipping section and expand the AWS section. Select the S3 bucket option, and configure Logz.io to be able to read from your S3 bucket.
More on the subject:
To find more information on how to configure this type of shipping of the logs and how to use AWS CLI sync command to copy files to an S3 bucket, you can read the section S3 Syncing and Shipping in our article on creating a PCI DSS dashboard.
The MongoDB Performance Dashboard
Now that all of our MongoDB metrics are shipped to Elasticsearch, we are ready to build a MongoDB monitoring dashboard. We will start with a series of Kibana visualizations for the throughput metrics.
First and as an example, we will create a line chart that visualizes the number of read requests. After clicking on the Visualize section and selecting the Line chart visualization type from the menu, we will set up metrics fields on the left side in the Kibana:
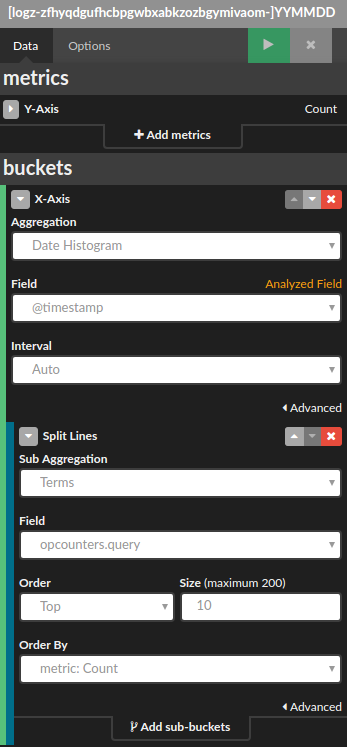
The metrics configuration for query number
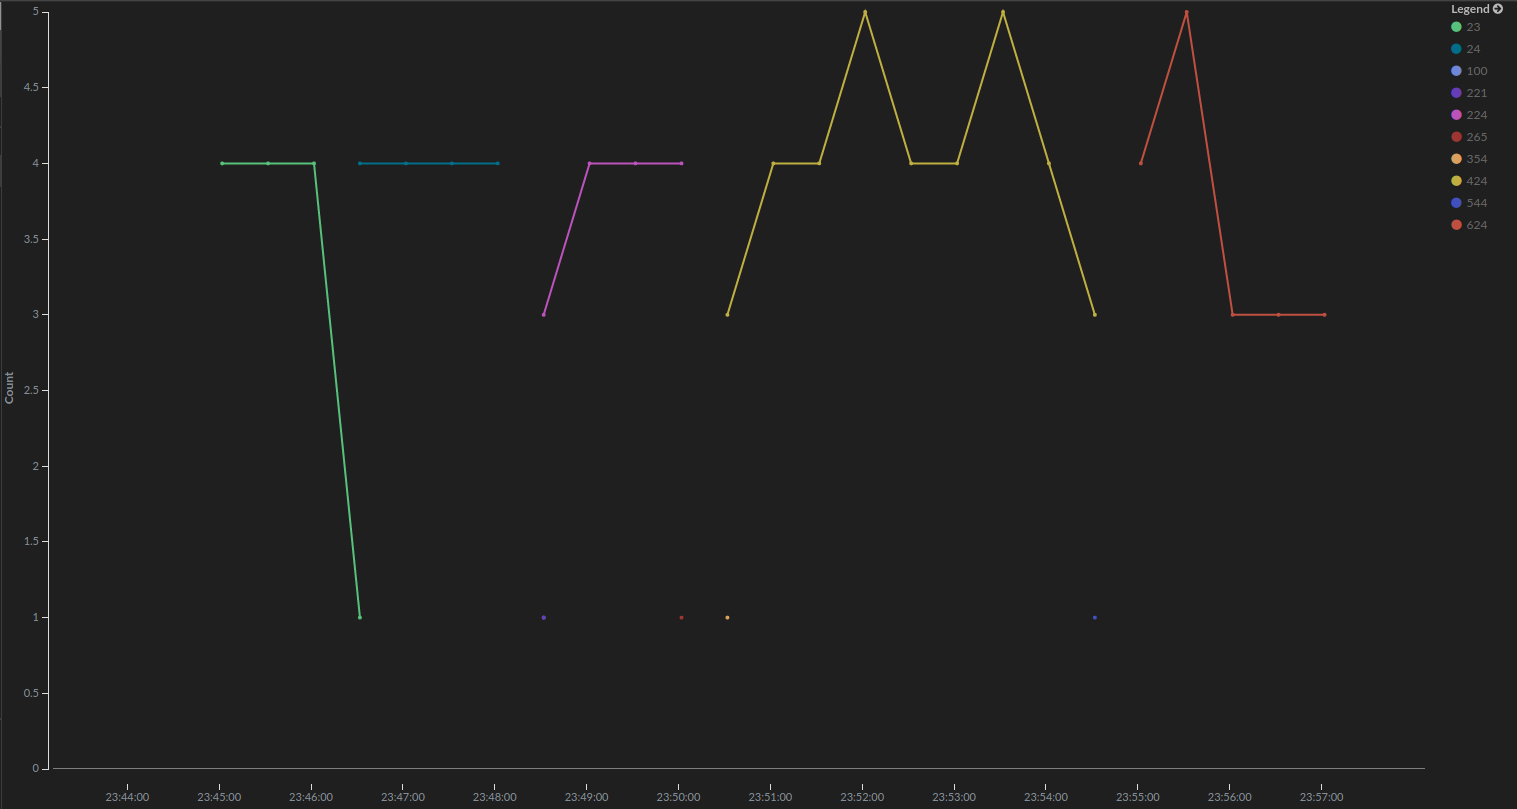
A line chart for query number
We will do the same thing for the rest of the throughput metrics. The configuration will only differ in the aggregation fields used (where for query we pointed on the opcounters.query from the field dropdown).
After adding and saving these charts in the KIbana dashboard, you will be able to see throughput metrics visualized:
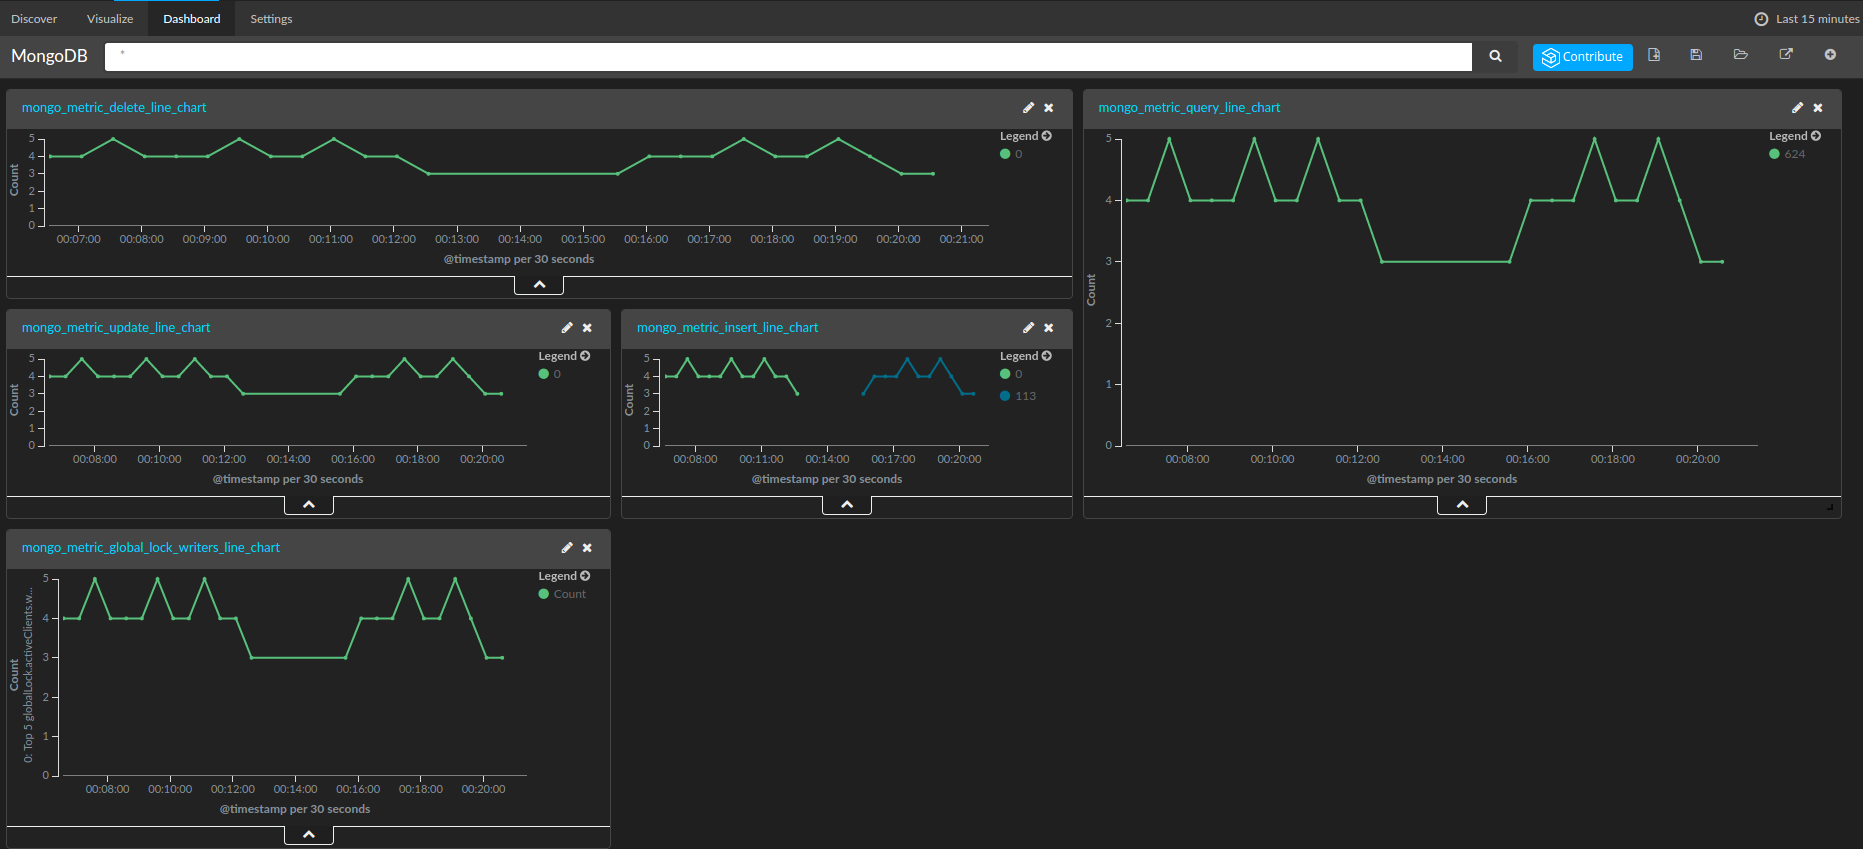
A dashboard with visualized throughput metrics
In a similar fashion, we can visualize the other metrics described in the MongoDB Metrics section.
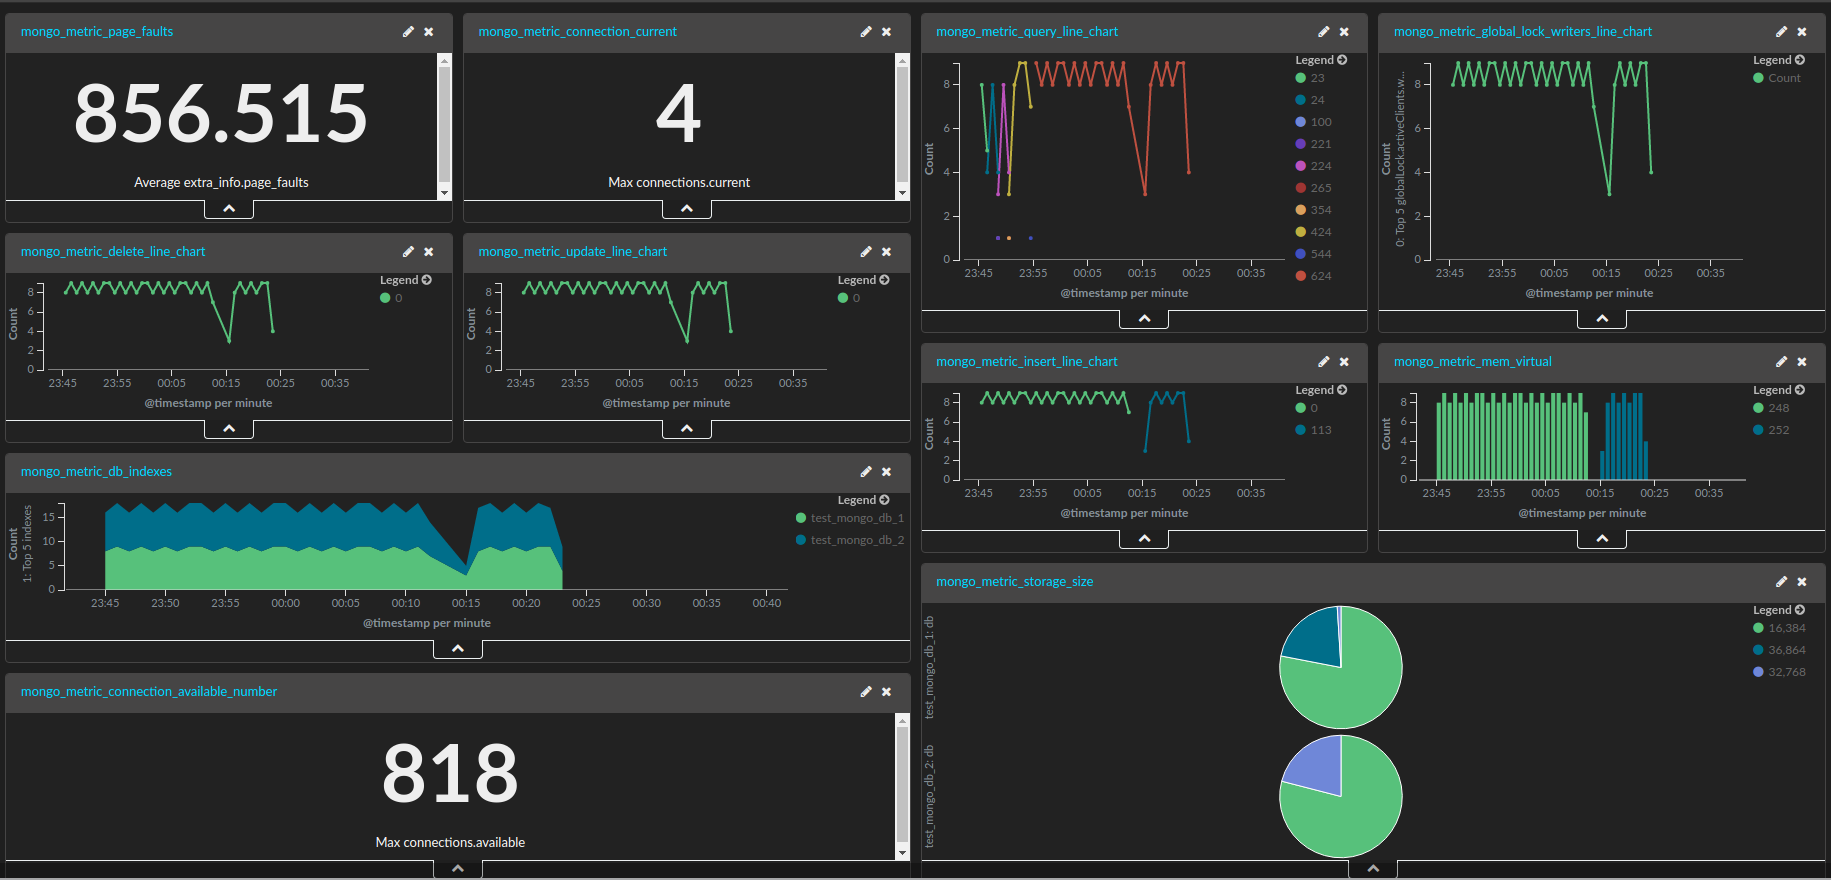
The final dashboard for MongoDB metrics
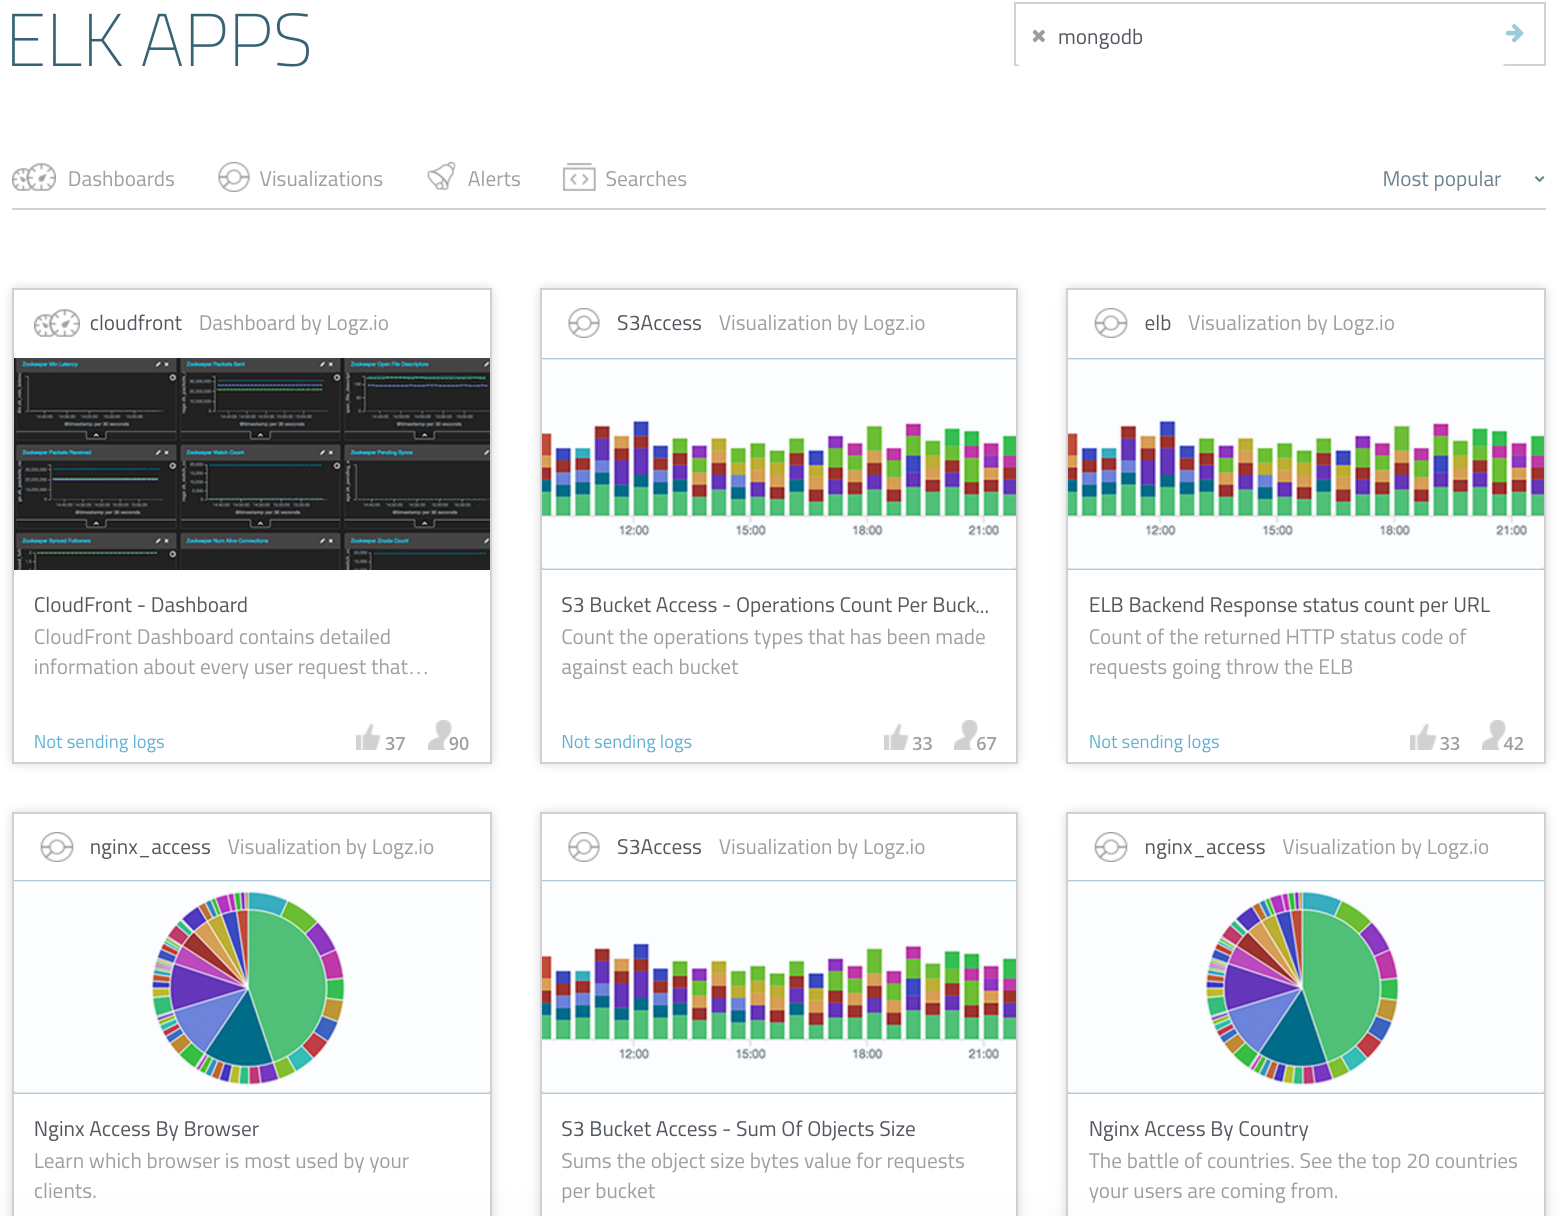
To help you to hit the ground running, we’ve added this dashboard to ELK Apps — our free library of ready-made visualizations and dashboards that can be installed in one click. Simply search for MongoDB in the ELK Apps page, and click to install.
Your job doesn’t necessarily stop there — set up alerts for the metrics that we have added here. Learn how to create alerts for the ELK Stack.

You Might Also Like

Getting Started with Logz.io: Sending Data Made Simple

