Network Security Monitoring with Suricata, Logz.io and the ELK Stack
February 18, 2019
Suricata is an open source threat detection system. Initially released by the Open Information Security Foundation (OISF) in 2010, Suricata can act both as an intrusion detection system (IDS), and intrusion prevention system (IPS), or be used for network security monitoring. More on the subject:
Suricata can be set up as a host-based IDS to monitor the traffic of a single machine, a passive IDS to monitor all the traffic passing through the network and to notify the analyst when malicious activity is detected, or as an active, inline IDS and IPS to monitor inbound and outbound traffic.
Suricata comes with built-in security rules but can also be complemented with external rule sets. These rules generate log data, or security events, and to be able to effectively ingest, store and analyze this data requires a security analytics platform that can act as a centralized logging system for Suricata data and all the other types of data flowing in from other security layers.
In this article, we will explore the steps for installing and integrating Suricata with Logz.io and the ELK Stack. You’ll need either a Logz.io account or your own ELK deployment to follow the procedures described here.
Installing Suricata
Our first step, is to set up Suricata.
Suricata can be installed on a variety of distributions using binary packages or compiled from source files. We’ll be installing Suricata on Ubuntu 16.04, and full installation instructions are available here.
Start with installing recommended dependencies:
apt-get install libpcre3 libpcre3-dbg libpcre3-dev build-essential libpcap-dev   \
                libyaml-0-2 libyaml-dev pkg-config zlib1g zlib1g-dev \
                make libmagic-dev
Next, define the PPA for installing latest stable release:
sudo add-apt-repository ppa:oisf/suricata-stable
Update your system and install Suricata with:
sudo apt-get update
sudo apt-get install suricata
Next, we’re going to install Suricata-Update — a tool for updating and managing Suricata rules. Suricate-Update is packaged with Suricata, so to use it simply use:
sudo suricata-update
The Emerging Threats Open ruleset is downloaded to /var/lib/suricata/rules/, and this is the command to use to update your rules.
Last but not least, start Suricata:
sudo service suricata start
Shipping Suricata data to the ELK Stack
After a minute or two, Suricata will begin to generate events in a file called ‘eve.json’ located at /var/log/suricata/eve.json.
All the data generated by Suricata, whether rule-based alerts, DNS or HTTP logs, will be sent into this file. You can configure what data is shipped into this file, define different log outputs per data type, and more, in the Suricata configuration file (/etc/suricata/suricata.yaml).
All the log types in the ‘eve.json’ file share a common structure:
{"timestamp":"2009-11-24T21:27:09.534255","event_type":"TYPE", ...tuple... ,"TYPE":{
... type specific content ... }}
Our next step is to ship this data into the ELK Stack for analysis. We will outline two methods — using Filebeat to ship to Logz.io and using a combination of Filebeat and Logstash for vanila ELK deployments.
Using Logz.io
If you’re a Logz.io user, all you have to do is install Filebeat and configure it to forward the suricata_ews.log file to Logz.io. Processing and parsing will be applied automatically.
To install Filebeat, use:
wget -qO - https://artifacts.elastic.co/GPG-KEY-elasticsearch | sudo apt-key add -
sudo apt-get install apt-transport-https

echo "deb https://artifacts.elastic.co/packages/6.x/apt stable main" | sudo tee -a
/etc/apt/sources.list.d/elastic-6.x.list

sudo apt-get update && sudo apt-get install filebeat
Before configuring Filebeat, download an SSL certificate for encryption:
wget
https://raw.githubusercontent.com/logzio/public-certificates/master/COMODORSADomainValidationSecureServerCA.crt

sudo mkdir -p /etc/pki/tls/certs

sudo cp COMODORSADomainValidationSecureServerCA.crt /etc/pki/tls/certs/
Next, open up the Filebeat configuration file at /etc/filebeat/filebeat.yml, and enter the following configuration:
filebeat.inputs:

- type: log
  paths:
    - /var/log/suricata/eve.json
  fields:
    logzio_codec: json
    token: <yourLogzioToken>
    type: suricata
  fields_under_root: true
  encoding: utf-8
  ignore_older: 3h

registry_file: /var/lib/filebeat/registry

output:
  logstash:
    hosts: ["listener.logz.io:5015"]
    ssl:
      certificate_authorities: ['/etc/pki/tls/certs/COMODORSADomainValidationSecureServerCA.crt']
Be sure to enter your Logz.io account token in the relevant field. You can find your token in the Logz.io UI, on the General page of your settings.
Save the configuration file and start Filebeat:
sudo service filebeat start
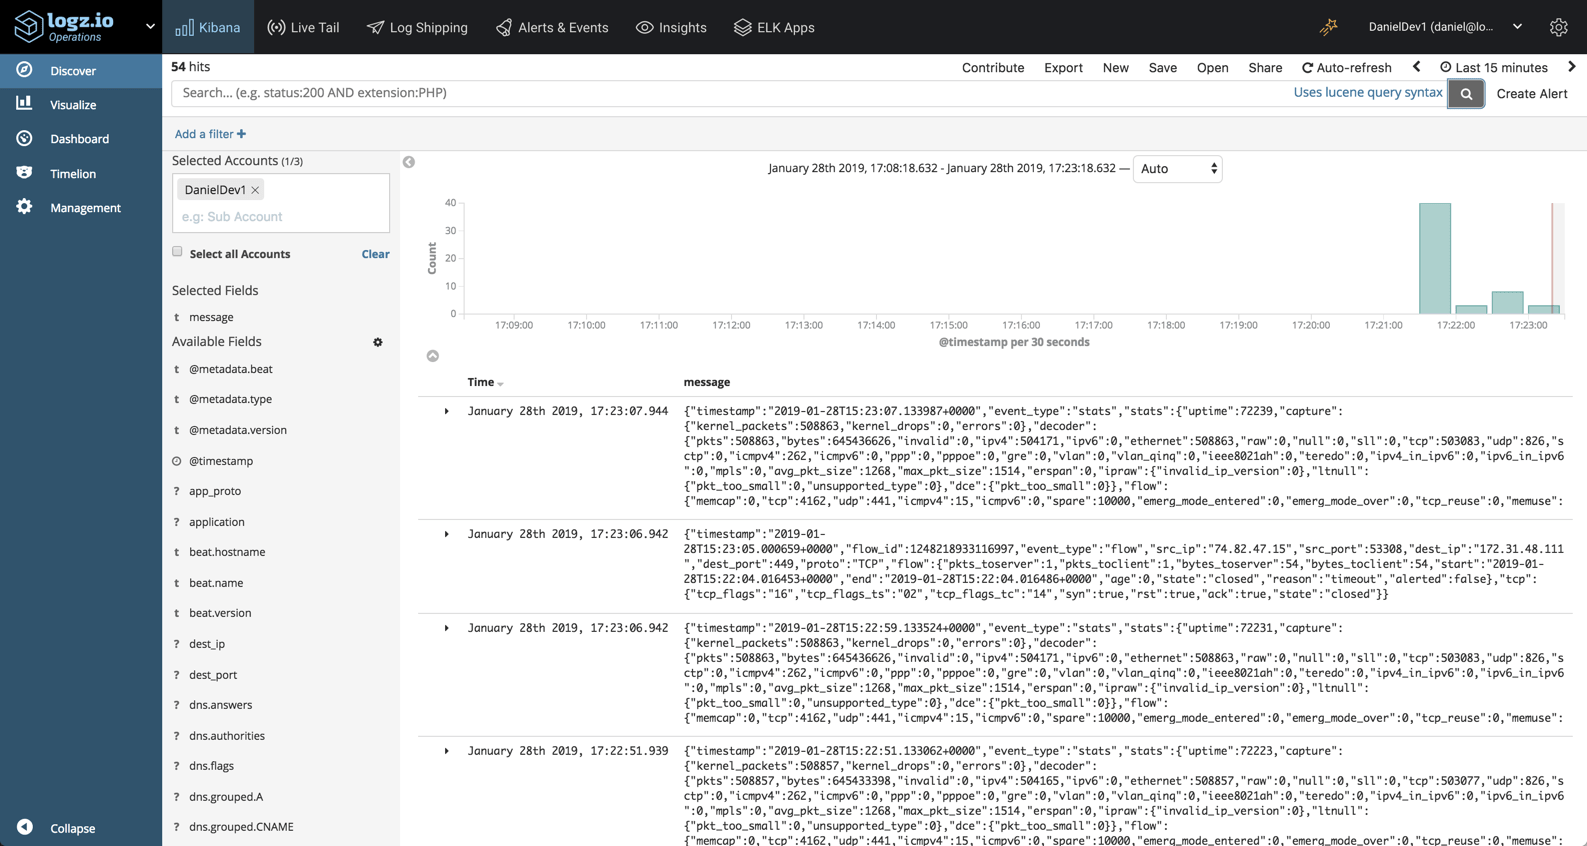
Wait a minute or two, you will begin to see the Suricata data in Logz.io:
Using Logstash
If you’re using your own ELK deployment you will want to add Logstash into the pipeline for processing the data.
First though, our Filebeat configuration file will look as follows:
filebeat:
 prospectors:
  - input_type: log
    paths:
     - "/var/log/suricata/eve.json"
    json.keys_under_root: true
    json.overwrite_keys: true
    fields:
      application: suricata

output:
 logstash:
  # The Logstash hosts
   hosts: ["localhost:5044"]
Next up, Logstash. This is a critical step in the process as we need to ensure the Suricata logs are broken up properly for easier analysis.
Since we will be using the geoip filter plugin, we need to first install it:
cd /usr/share/logstash
sudo bin/logstash-plugin install logstash-filter-geoip
Create a configuration file:
sudo vim /etc/logstash/conf.d/suricata.conf
The configuration defines beats as the input, Elasticsearch as the output and uses a variety of filter plugins to process the logs:
input {
  beats {
    port => 5044
    codec => "json_lines"
  }
}

filter {
  if [application] == "suricata" {
    date {
      match => [ "timestamp", "ISO8601" ]
    }
    ruby {
      code => "if event['event_type'] == 'fileinfo'; event['fileinfo']['type']=event['fileinfo']['magic'].to_s.split(',')[0]; end;"
    }
  }

  if [src_ip]  {
    geoip {
      source => "src_ip"
      target => "geoip"
      add_field => [ "[geoip][coordinates]", "%{[geoip][longitude]}" ]
      add_field => [ "[geoip][coordinates]", "%{[geoip][latitude]}"  ]
    }
    mutate {
      convert => [ "[geoip][coordinates]", "float" ]
    }
    if ![geoip.ip] {
      if [dest_ip]  {
        geoip {
          source => "dest_ip"
          target => "geoip"
          add_field => [ "[geoip][coordinates]", "%{[geoip][longitude]}" ]
          add_field => [ "[geoip][coordinates]", "%{[geoip][latitude]}"  ]
        }
        mutate {
          convert => [ "[geoip][coordinates]", "float" ]
        }
      }
    }
  }
}

output {
  elasticsearch {
    hosts => ["localhost:9200"]
  }
}
Start Logstash and Filebeat with:
sudo service logstash start
sudo service filebeat start
Within a minute or two, you should see a new Logstash index created in Elasticsearch:
curl -X GET "localhost:9200/_cat/indices?v"

health status index                     uuid                   pri rep docs.count docs.deleted store.size pri.store.size
green  open   .kibana_1                 Eb79G5FESxiadHz8WCoE9w   1   0        178            8    280.3kb        280.3kb
yellow open   logstash-2019.01.28       _53z4wLXSLiiW5v-OMSqRg   5   1       1157            0      2.3mb          2.3mb
In Kibana, you can then define the new index pattern to start your analysis:

Analyzing the data
So – what are we looking for? What can be done with Suricata logs?
The parsing applied to the logs parses out some important fields which we can use for monitoring our network for suspicious behavior. Below are a few examples of visualizations that can be built in Kibana for detecting malicious activity.
Suricata Alerts
Suricata rules (/etc/suricata/rules) will trigger alerts and send logs to Logz.io should the conditions defined in those rules be met. To understand what the actual rules mean, I would recommend you refer to Suricata docs.
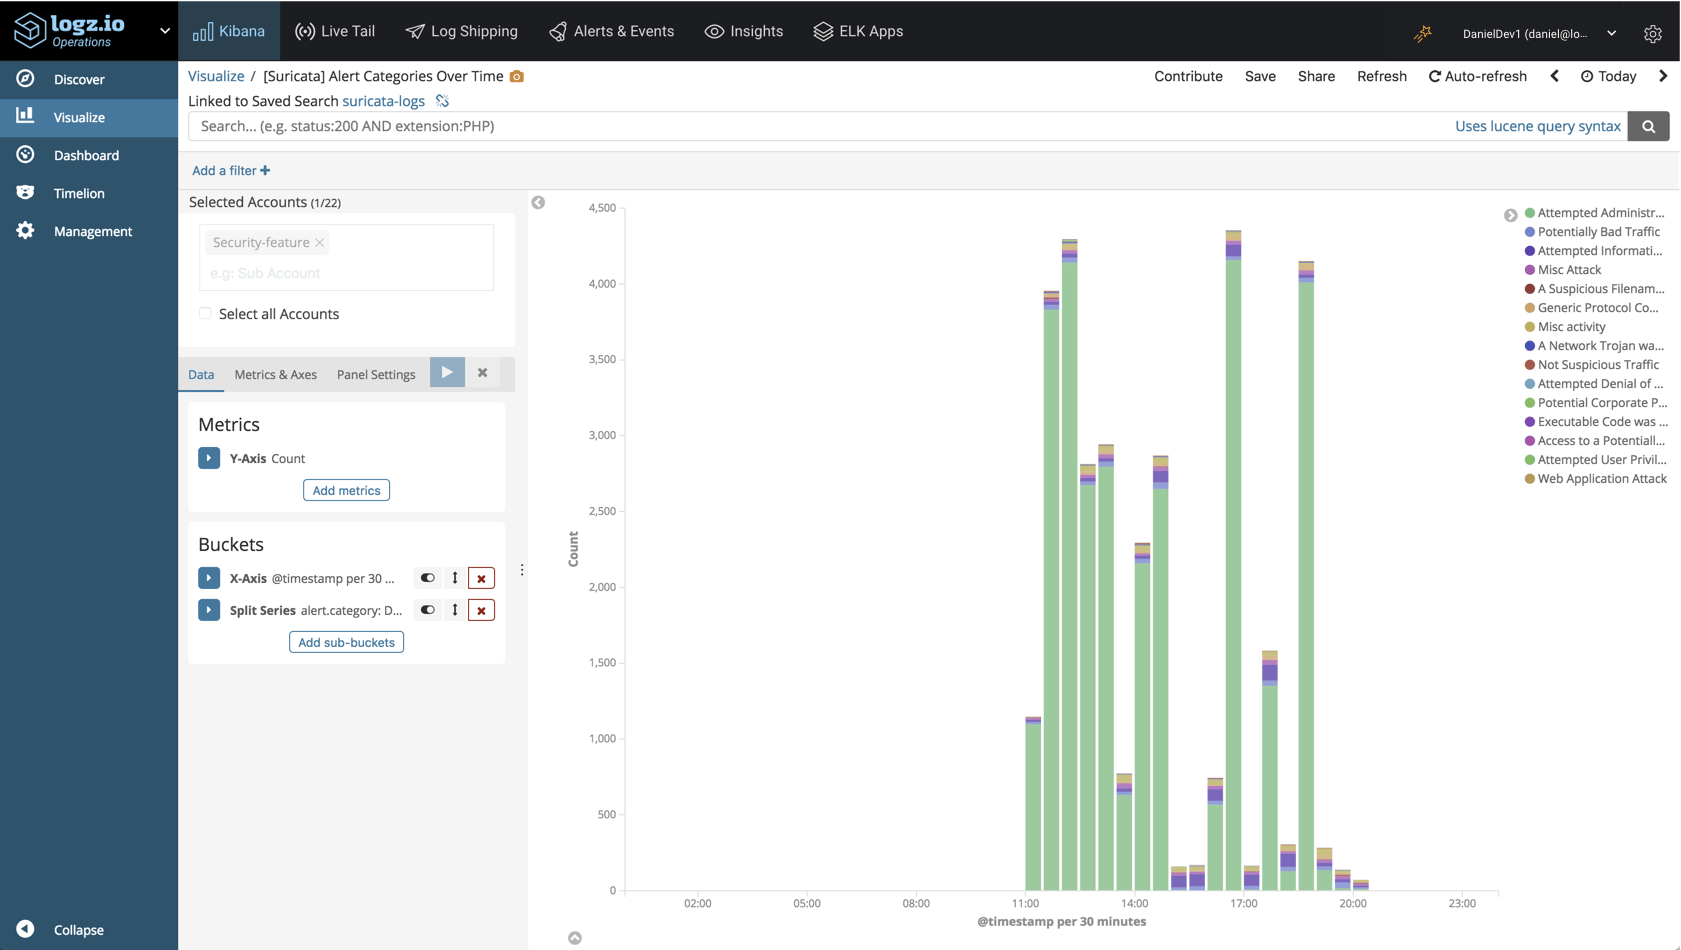
In the bar chart below, we are monitoring the different alert categories Suricata is logging over time:
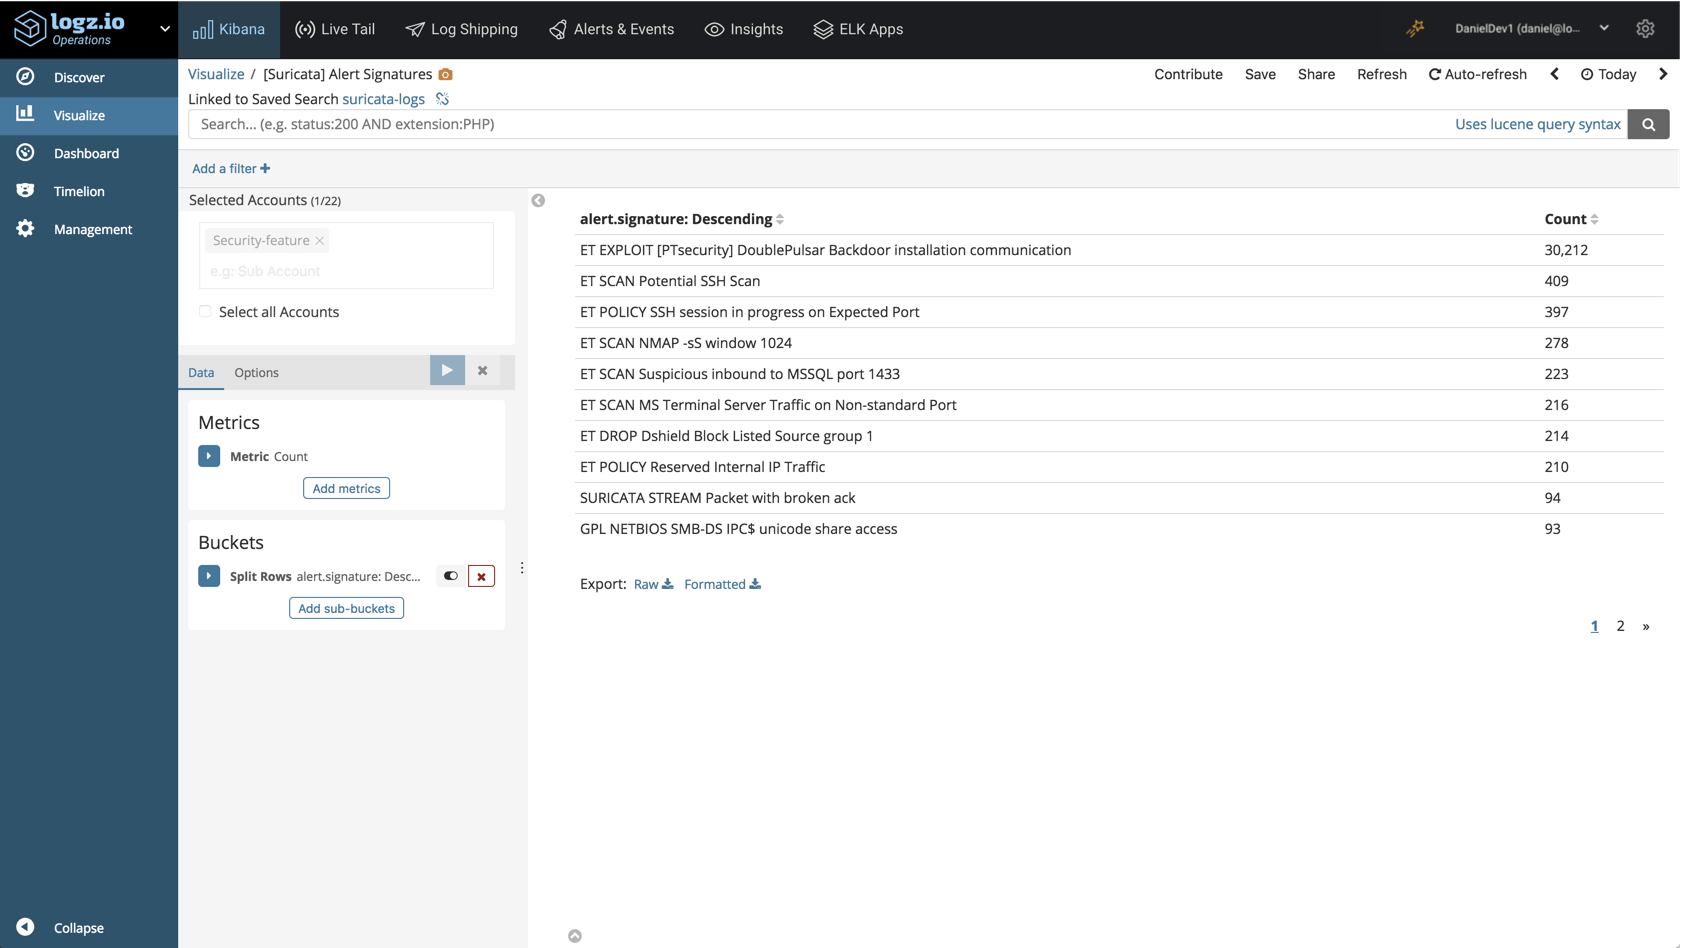
To monitor alert signatures, we could build a Data Table visualization:
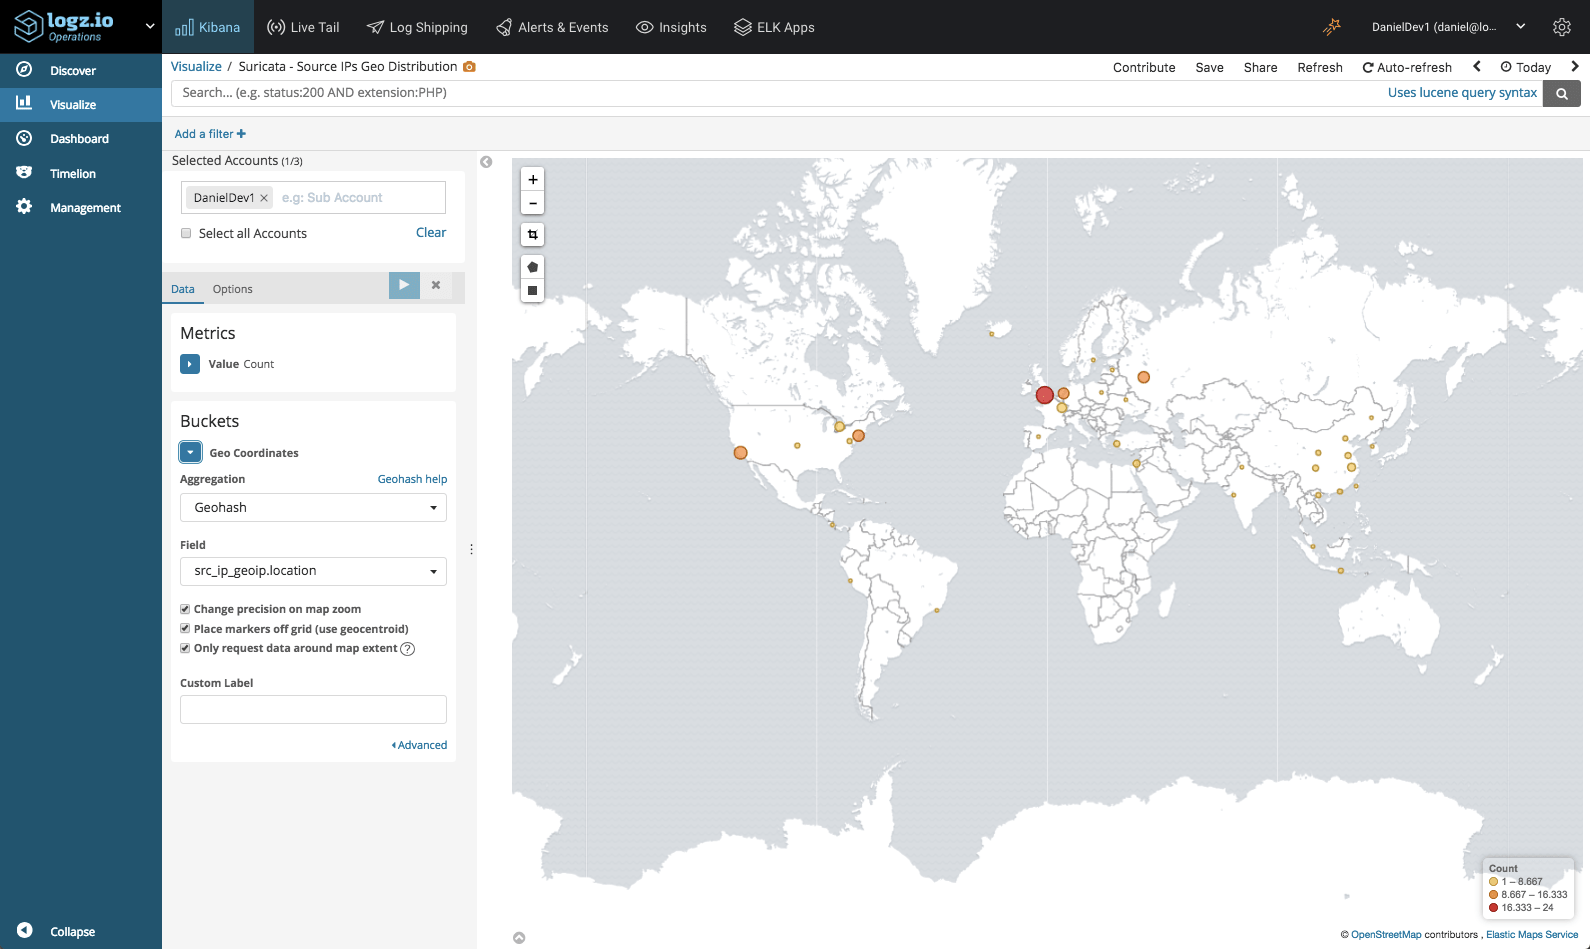
Traffic Geographic Distribution
We can monitor the geographical distribution of traffic coming into our system using Kibana’s Coordinate Map visualization. To do this we will make use of the geo enhancement applied to the src_ip field in Suricata logs.
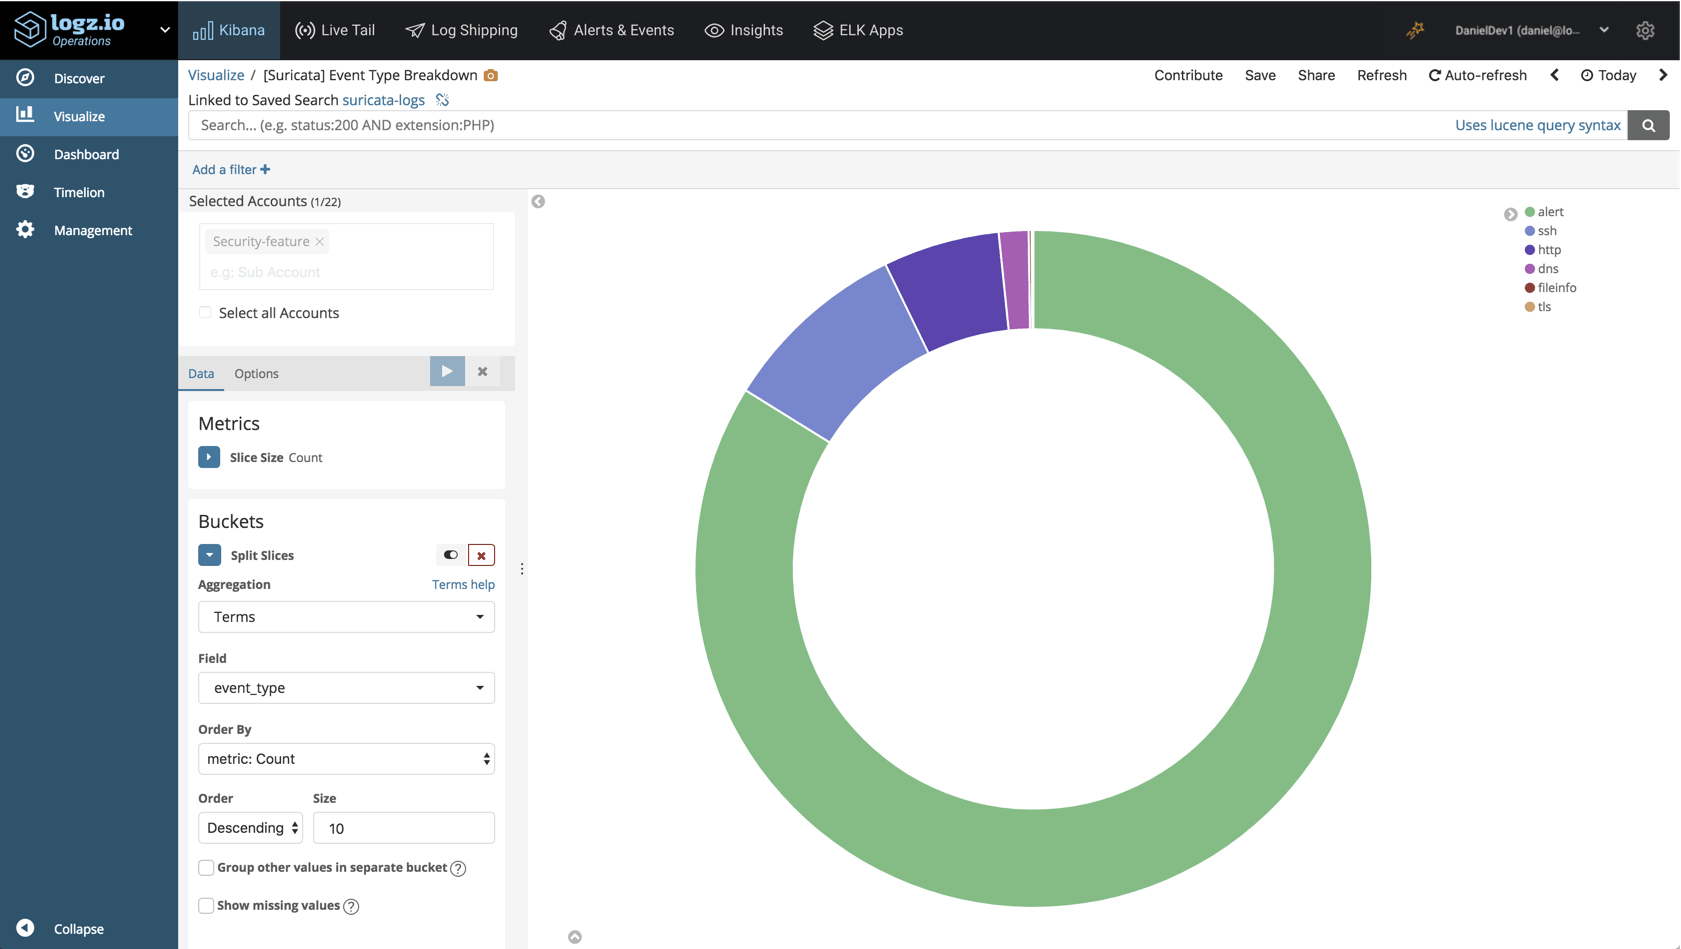
Suricata Event Types
The event_type field indicates the Suricata log type. With the help of a pie chart visualization, we can see a breakdown of the top log types recorded in the system:
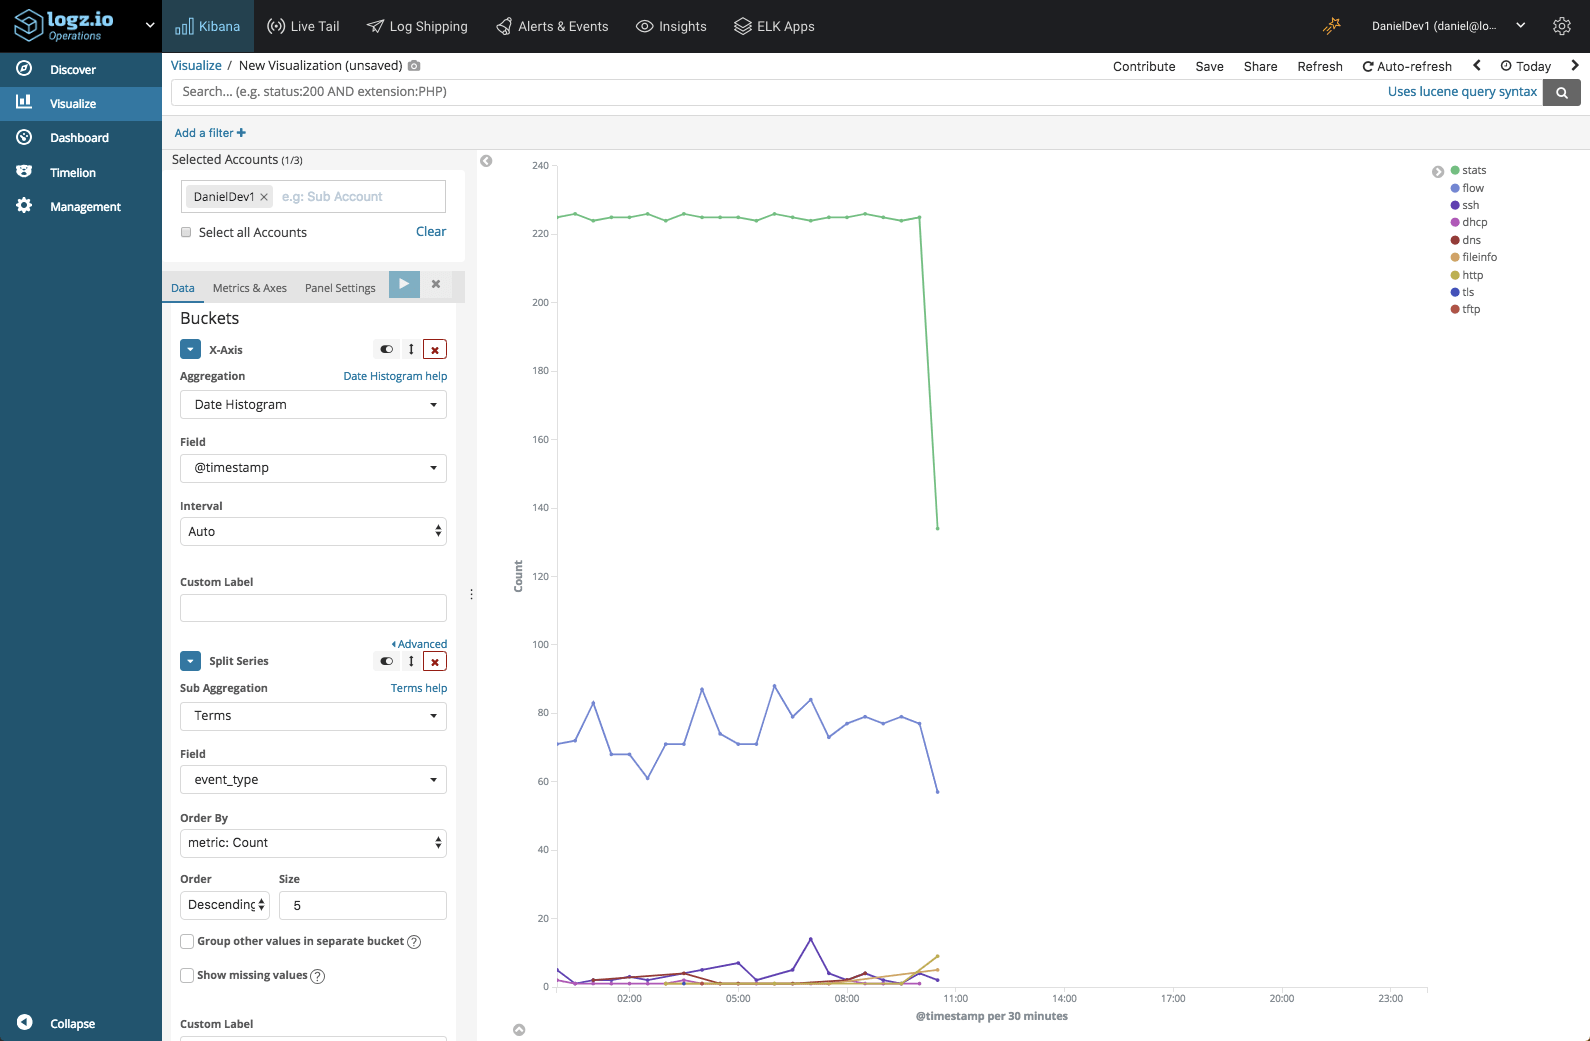
Line chart visualizations are great to monitor trends over time. In the visualization below, we’re looking at the top Suricata log types over time:
Once you’ve got all your visualizations lined up, you can add them into one comprehensive dashboard:
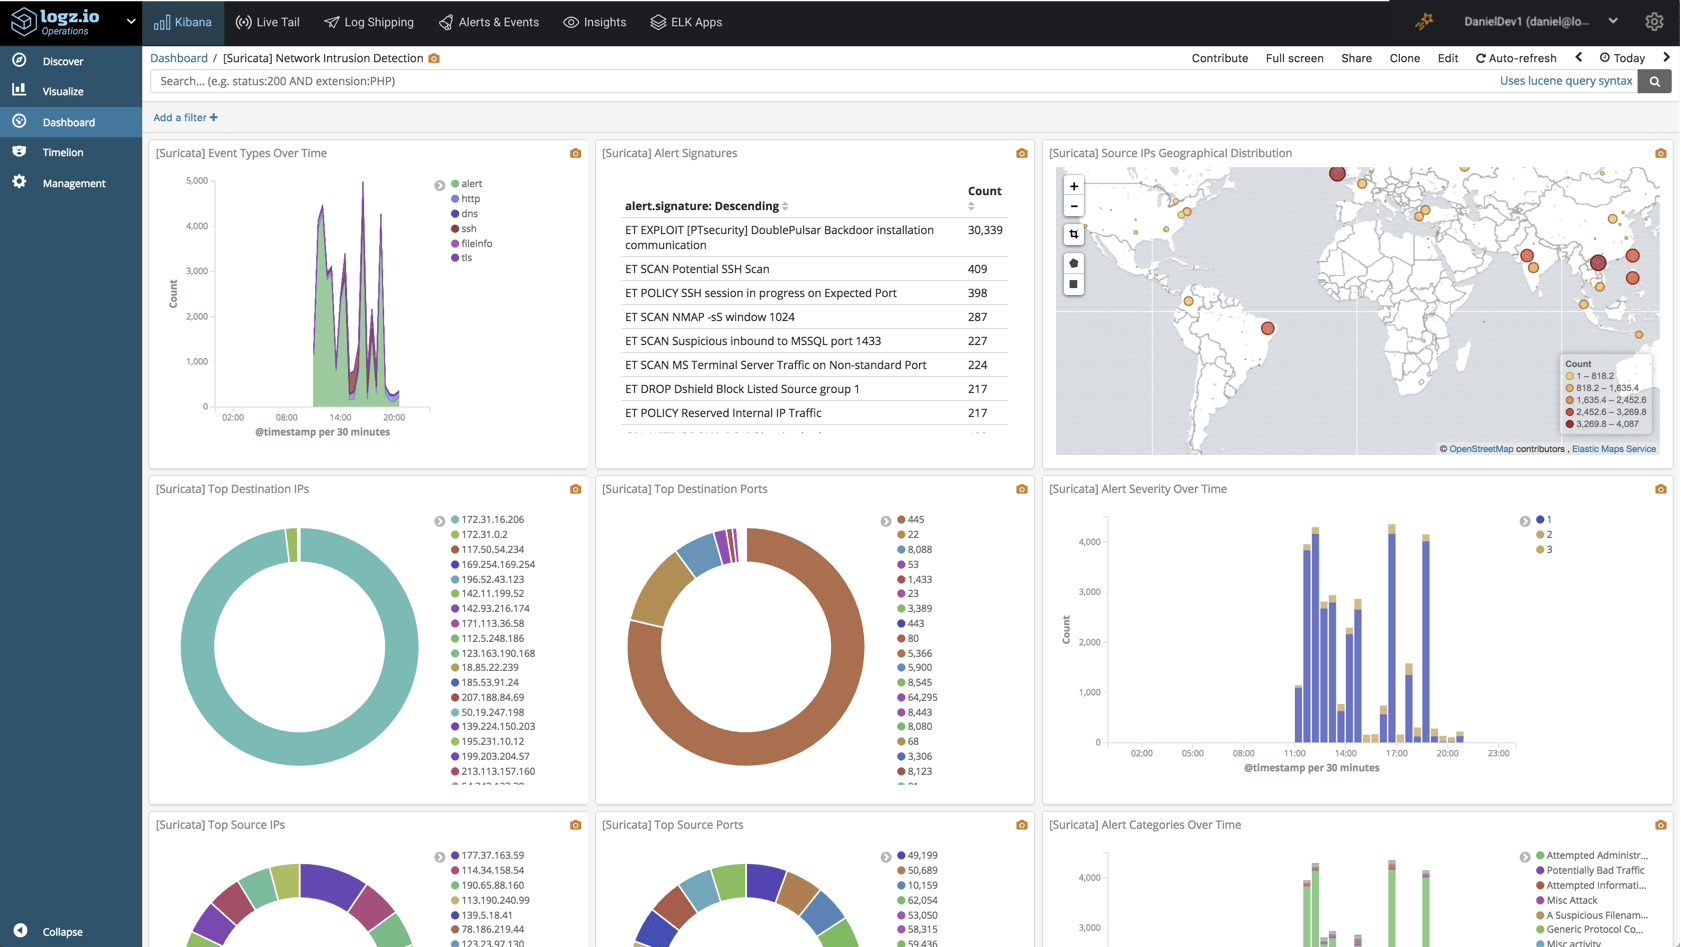
This dashboard is available in ELK Apps — Logz.io’s library of Kibana searches, alerts, visualizations and dashboards, together with other Suricata dashboards. Simply search for “Suricata” and install any of the listed dashboards in one click.
Endnotes
Suricata is a great open source option for monitoring your network for malicious activity. Still, it is just one layer in what must be a more comprehensive system deployed, rather than a complete solution for security issues.
Firewalls, endpoint monitoring, access monitoring, and more — these are additional layers that need to be put in place and integrated into your security architecture. Of course, a multi-layered system generates a huge volume of data which requires a security analytics platform that can ingest all the data, process it and give you the tools to effectively analyze it.
The integration with Logz.io provides you with aggregation and analytics capabilities necessary to make the most out of the logs and events that Suricata generates. We will be enhancing our Suricata integration with additional rules and dashboards in our Security Analytics platform so stay tuned!

You Might Also Like

What’s New at Logz.io – January 2026

