Will AWS X-Ray Become a New Relic Alternative?
May 9, 2017

The ability to look into what your application is doing can help you diagnose problems in its behavior or performance. Just like a doctor uses X-rays to see inside your body, Amazon now provides an analogically named tool to see inside our AWS usage. The approach isn’t anything new, but can it replace the established leaders in the market?
How to Tell If You Need Tracing
Any application more complicated than a “Hello World” program is likely to be ridden with bugs. Sooner or later, something will not work as expected, leaving the developers to spend their time debugging rather than writing and testing code.
The first and most obvious debugging option is to attach a program, known as a debugger, to a running process to check which operations it executes and how they are run. This method is not always the most convenient one. Interrupting the execution of an entire app to examine its instructions step-by-step is not ideal when running production code.
Tracing is what is needed if you want to know what happens under the hood without actually stopping the engine. Even if it sounds exotic, chances are you have been using it already. Putting print statements in code is a form of tracing, allowing you to watch the output of your application to know exactly what state it is in.
A slightly different approach is to use tools like strace and DTrace. They show what operations are being performed internally without intervening (as opposed to a debugger).
When Single-Point Tracing Is Not Enough
Problems arise when there is more than one process to watch. Microservices and multi-faceted systems usually link many different components together. It is necessary to trace a query from its beginning (at the load balancer perhaps) to the backend and back again to the user.
If we extended the print approach here, we would be left with a web of log files with not much correlation (other than timestamps) between them. We could discover how one microservice was performing, but it would be hard to determine how it affected the other components. Is tracing, therefore, limited to monolithic applications?
Dynamic Tracing to the Rescue
One problem with our previous hypothetical system was that we overlooked correlations between its different components. Dynamic tracing addresses this shortcoming. By instrumenting various elements and using consistent IDs for requests, you not only get the big picture but also a picture that is clear and precise.
Instead of just watching your application, you can monitor the whole environment in which it works. Such a holistic approach helps you pinpoint the offender much more quickly. You can see which requests perform badly and where exactly they struggle.
Don’t Ask If You Need It, Ask When You Need It
Even if a system may not benefit from all the possibilities that dynamic tracing offers, writing traceable software is always worthwhile. Once a system scales up, some bottlenecks may become apparent. Being able to identify the source of any problems quickly may be crucial to ensuring the system’s stability.
Having read this far, you are probably wondering what tools are available to help trace your particular application. We’re here to help.
To most, New Relic is the defining presence in this space. It provides great support for many different languages and integrates well with the infrastructures of various providers. Other players in this field are Dynatrace, Datadog, Stackify, and Instrumental. All provide paid services that can provide insight into an app’s internals. Each of them is a general purpose, which means that it should run regardless of which host is being used.
Enter AWS X-Ray
AWS recently arrived on the tracing scene. Their tool is called AWS X-Ray, and it offers some of New Relic’s features with a few exclusive ones as well. The selection of languages supported is quite modest at the moment — Java, .Net, or Node.JS — so not everyone can use it to check how an application will perform. Recently, AWS Lambda support was added.
DynamoDB and other commonly used database services that benefit from tracing — such as MySQL and PostgreSQL — are catered for. Services supported by X-Ray include EC2, ECS, and Elastic Beanstalk. Elastic Load Balancer (ELB) and Amazon API Gateway provide the frontend and initiate the tracing by providing a Trace-ID. You can even peek into messaging services thanks to its SQS and SNS support.
In short, if you are already committed to the AWS ecosystem and do not mind the vendor lock-in, X-Ray is an interesting dynamic tracing option to consider.
AWS X-Ray Implementation Examples
Deploying an example application with AWS X-Ray is a useful exercise for anyone wanting to become comfortable with its features. Let’s take a look at some sample codes to gain insights into how they work.
The AWS X-Ray SDK is available on NPM, so all you need to do to get started is to add it to your package.json file. The only framework supported out of the box by X-Ray’s middleware is Express, which we will be taking advantage of in the code.
The setup is pretty straightforward. Load the EC2 plugin, enable HTTP capturing, and set the name of your frontend. Afterward, create new SNS and DynamoDB instances, albeit with a twist — use XRay.captureAWSClient so that their usage will be traced.
XRay.config([XRay.plugins.EC2]);
 XRay.captureHTTPs(http);
 XRay.setDefaultName('myfrontend-dev');

 var app = express();
 var sns = XRay.captureAWSClient(new AWS.SNS());
 var ddb = XRay.captureAWSClient(new AWS.DynamoDB());
 var ddbTable =  process.env.STARTUP_SIGNUP_TABLE;
 var snsTopic =  process.env.NEW_SIGNUP_TOPIC;
Monitoring requests comprise three parts. First, call app.use(XRay.express.openSegment()). You would normally have to provide a name here, but we have set the default already. You can now use X-Ray SDK functions in our request handlers. Finally, call app.use(XRay.express.closeSegment()).
The information about the traced call is stored as JSON data in segments. If you want to trace the start and end of a function, add a subsegment for it using XRay.captureAsync() or AWSXRay.captureAsyncFunc() in recent SDK versions. For example, to find out how long it takes to render a resource, use:
app.get('/', function(req, res) {
    XRay.captureAsync('Page Render', function(seg) {
        res.render('index', {
            static_path: 'static',
            theme: process.env.THEME || 'flatly',
            flask_debug: process.env.FLASK_DEBUG || 'false'
        });
        seg.close();
    });

    res.status(200).end();
 });
You can also annotate segments to store some additional information:
var seg = XRay.getSegment();
seg.addAnnotation('theme', req.body.theme);
As you can see, modifying an existing application (provided that it is using a supported framework) is not complicated at all. The quickest implementation, measuring only AWS statistics, can be achieved with two additional lines for middleware injection and a few more lines for the setup. Neat!
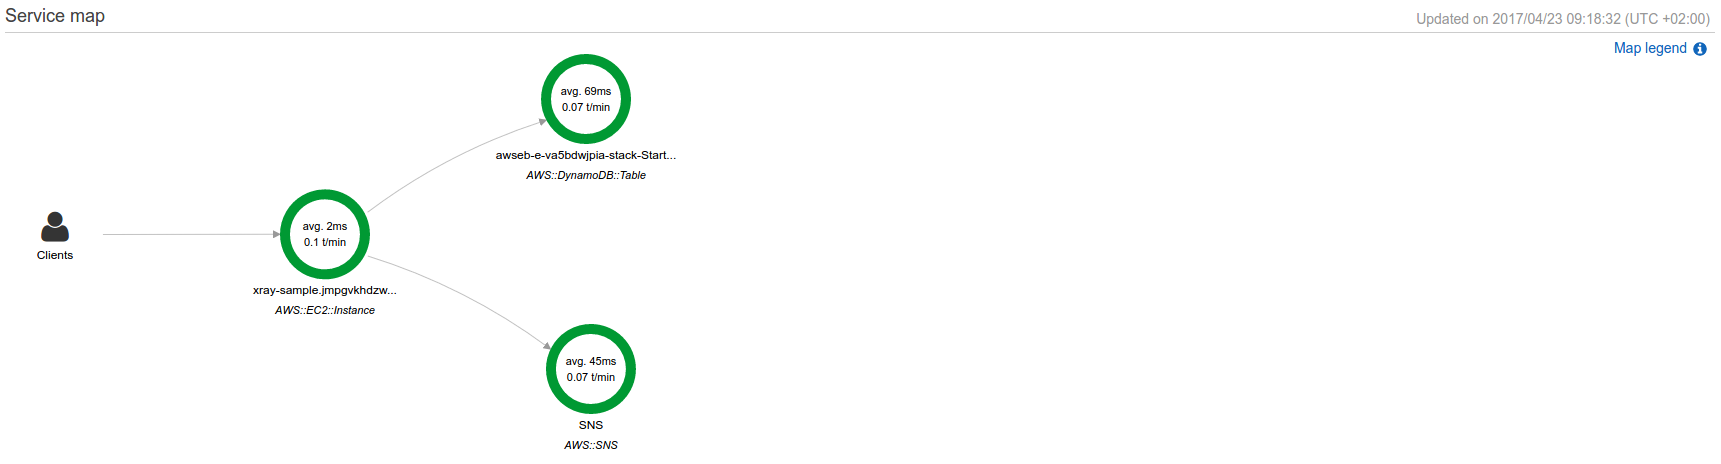
After collecting sample data, go to the X-Ray console to look into the details. The main screen shows a map of your service. You will see the frontend, DynamoDB instance, and SNS instance.
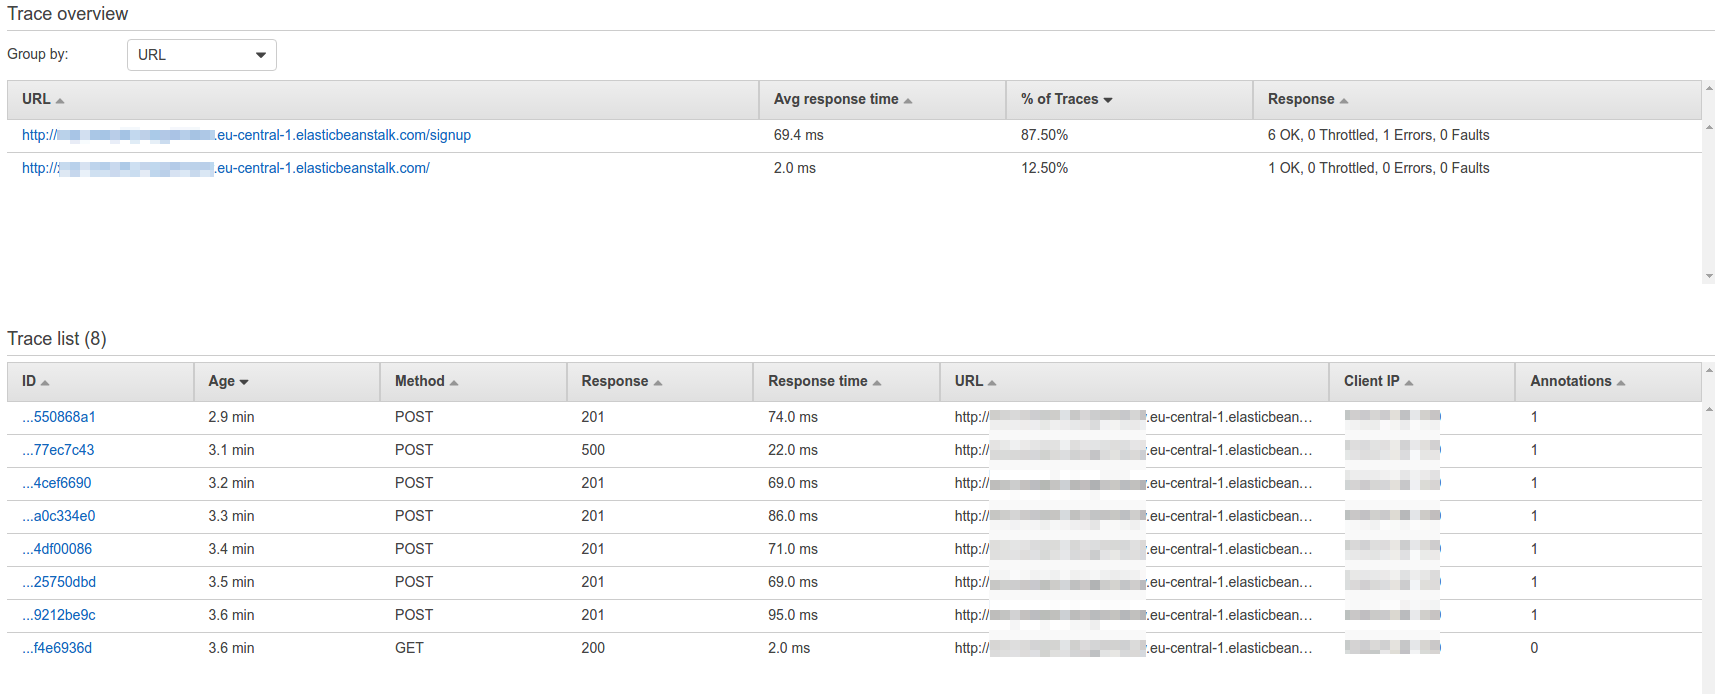
Selecting one of these services will give you detailed information about its processed data (here is an example shown for the frontend):
So is X-Ray Really an Alternative?
Even though AWS X-Ray and New Relic have similar scope, they should not be considered direct competitors. The former is a highly integrated product, tightly coupled to one platform. The latter is a general-purpose solution that works transparently across both cloud-based and self-hosted deployments.
More on the subject:
Clearly, the support for languages and frameworks is currently inferior in AWS X-Ray. However, it is worth bearing in mind that this is a recently launched product. New Relic has had far longer to build its offering, and we can assume that Amazon will continue to develop its service as well.
Considering the popularity of AWS services, X-Ray is certainly an interesting alternative to New Relic. Even though its niche is much narrower, it is still wide enough to lure customers, especially those that haven’t considered such a service before.

You Might Also Like

WebAssembly: The Next Frontier in Cloud-Native Evolution

