
Getting Started with Kubernetes using MicroK8s
December 11, 2019
Single-node deployments of Kubernetes are more common than what one would expect. In some scenarios, single-node clusters make much more sense. For development purposes or testing, there’s no need to deploy a full-blown production-grade cluster. Single-node deployments are also handy for appliances and IoT applications since they have a much smaller footprint.
Enter MicroK8s, a tool by Canonical that enables you to easily deploy a lightweight single-node cluster in your local environment.
But wait, doesn’t Minikube already allow me to do just this? Well, I’m glad you asked! Yes, Minikube also allows you to deploy a single-node Kubernetes cluster locally but with one key difference — it’s VM-based, and thus will work best running within a VM, primarily on Mac and Windows but also on Linux. MicroK8s, on the other hand, were designed for Linux and does not require a VM. Instead, it can be easily be installed as a snap package using one simple command. Because it doesn’t require a VM, there are more resources available on the given machine to run applications, which makes MicroK8s a perfect fit for edge installations. You can even use it to install Kubernetes on Raspberry Pi!
Let’s take a closer look.
Installing MicroK8s
The recommended way for installing MicroK8s is on Linux. Specifically, any Linux distribution that supports snapd. There are also alternative installation methods available for Mac and Windows but I cannot attest to how well these scenarios will work.
I will be installing MicroK8s on an Ubuntu 18.04 EC2 instance as Ubuntu supports snapd by default (both are Canonical-led projects) and is also my preferred distro. If you’re using a different Linux distro, go to snapd docs to install it.
To install MicroK8s, use this one simple command:
sudo snap install microk8s --classic --channel=1.16/stable
MicroK8s will be installed in a snap and within a few seconds you should see this message displayed:
microk8s (1.16/stable) v1.16.3 from Canonical✓ installed
To make sure MicroK8s is running, you can use this status command:
sudo microk8s.status
And the output:
microk8s is running
addons:
cilium: disabled
dashboard: disabled
dns: disabled
fluentd: disabled
gpu: disabled
helm: disabled
ingress: disabled
istio: disabled
jaeger: disabled
knative: disabled
linkerd: disabled
metrics-server: disabled
prometheus: disabled
rbac: disabled
registry: disabled
storage: disabled
As you can see, MicroK8s is running as expected and we can see a long list of addon components that are disabled which we will discuss in the next step.
MicroK8s ships with kubectl so we can use this familiar CLI to interact with our Kubernetes cluster, and to monitor and operate it.
As an example:
microk8s.kubectl get nodes

NAME               STATUS   ROLES    AGE     VERSION
ip-172-31-52-245   Ready       7m38s   v1.16.3
Optionally, if you want to use kubectl in your commands instead of microk8s.kubectl, you can add an alias:
sudo snap alias microk8s.kubectl kubectl
Enabling addons
To make MicroK8s as lightweight as possible, the default installation includes a barebones Kubernetes deployment, which includes the api-server, controller-manager, scheduler, kubelet, cni and kube-proxy.
Our single-node deployment, however, can be easily extended by enabling the provided addons we saw in the previous step. For example, you can enable Istio services or deploy a private Docker registry. Addons can be easily enabled and disabled whenever you like and are pre-configured to work out-of-the-box.
For the sake of demonstration in this tutorial, we’ll add the dashboard addon that provides the well-known user interface to monitor and operate Kubernetes clusters. We’ll also enable two other addons that will support the dashboard — dns and ingress.
To do this, we’ll use this command:
sudo microk8s.enable dns dashboard ingress
Next, we’ll set up a proxy to pass and allow external requests to the dashboard:
sudo microk8s.kubectl proxy --accept-hosts=.* --address=0.0.0.0 &
To allow access to the dashboard without requiring a token, I’m going to edit the deployment file for the dashboard service:
sudo microk8s.kubectl -n kube-system edit deploy kubernetes-dashboard -o yaml
Here, I’m going to add the –enable-skip-login flag to the deployment’s specs:
spec:
  progressDeadlineSeconds: 600
  replicas: 1
  revisionHistoryLimit: 10
  selector:
    matchLabels:
      k8s-app: kubernetes-dashboard
  strategy:
    rollingUpdate:
      maxSurge: 25%
      maxUnavailable: 25%
    type: RollingUpdate
  template:
    metadata:
      creationTimestamp: null
      labels:
        k8s-app: kubernetes-dashboard
    spec:
      containers:
      - args:
        - --auto-generate-certificates
        - --namespace=kube-system
        - --enable-skip-login
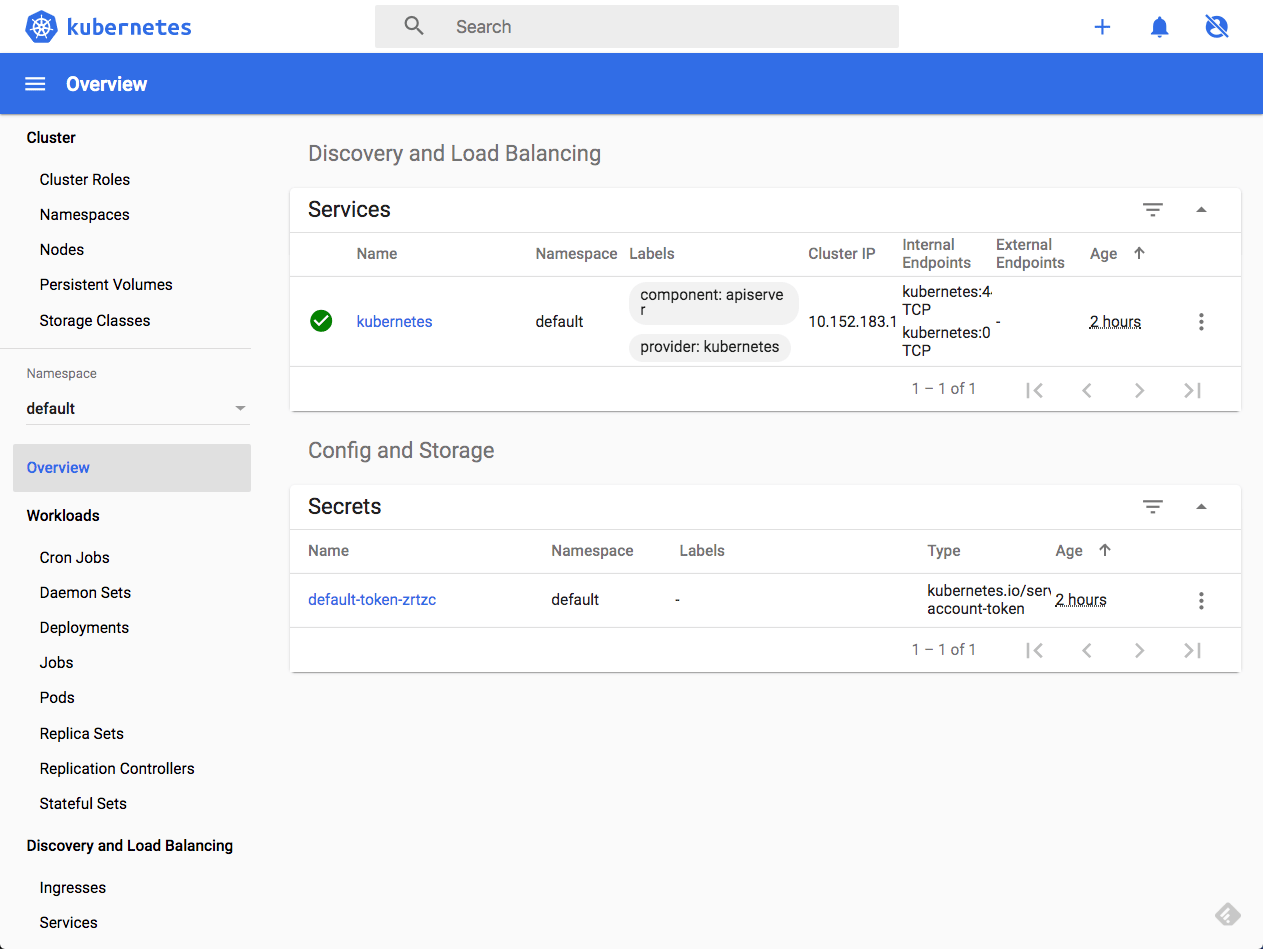
Once we save the file, we’ll be able to access the dashboard by entering the following URL:
http://{IP_address}:8001/api/v1/namespaces/kube-system/services/https:kubernetes-dashboard:/proxy/

Just hit the Skip button to access the dashboard:
Logging in MicroK8s
You can easily set up a local EFK Stack (Elasticsearch, Fluentd and Kibana) using the provided fluentd addon. Note, that the default images will deploy versions 6.3 of Elasticsearch and Kibana:
sudo microk8s.enable fluent
This creates three pods, one for each component of the stack:
sudo microk8s.kubectl get services -n kube-system
NAME                        TYPE        CLUSTER-IP       EXTERNAL-IP   PORT(S)                  AGE
dashboard-metrics-scraper   ClusterIP   10.152.183.71            8000/TCP                 144m
elasticsearch-logging       ClusterIP   10.152.183.183           9200/TCP                 138m
heapster                    ClusterIP   10.152.183.208           80/TCP                   144m
kibana-logging              ClusterIP   10.152.183.65            5601/TCP                 138m
kube-dns                    ClusterIP   10.152.183.10            53/UDP,53/TCP,9153/TCP   144m
kubernetes-dashboard        ClusterIP   10.152.183.84            443/TCP                  144m
monitoring-grafana          ClusterIP   10.152.183.163           80/TCP                   144m
monitoring-influxdb         ClusterIP   10.152.183.125           8083/TCP,8086/TCP        144m
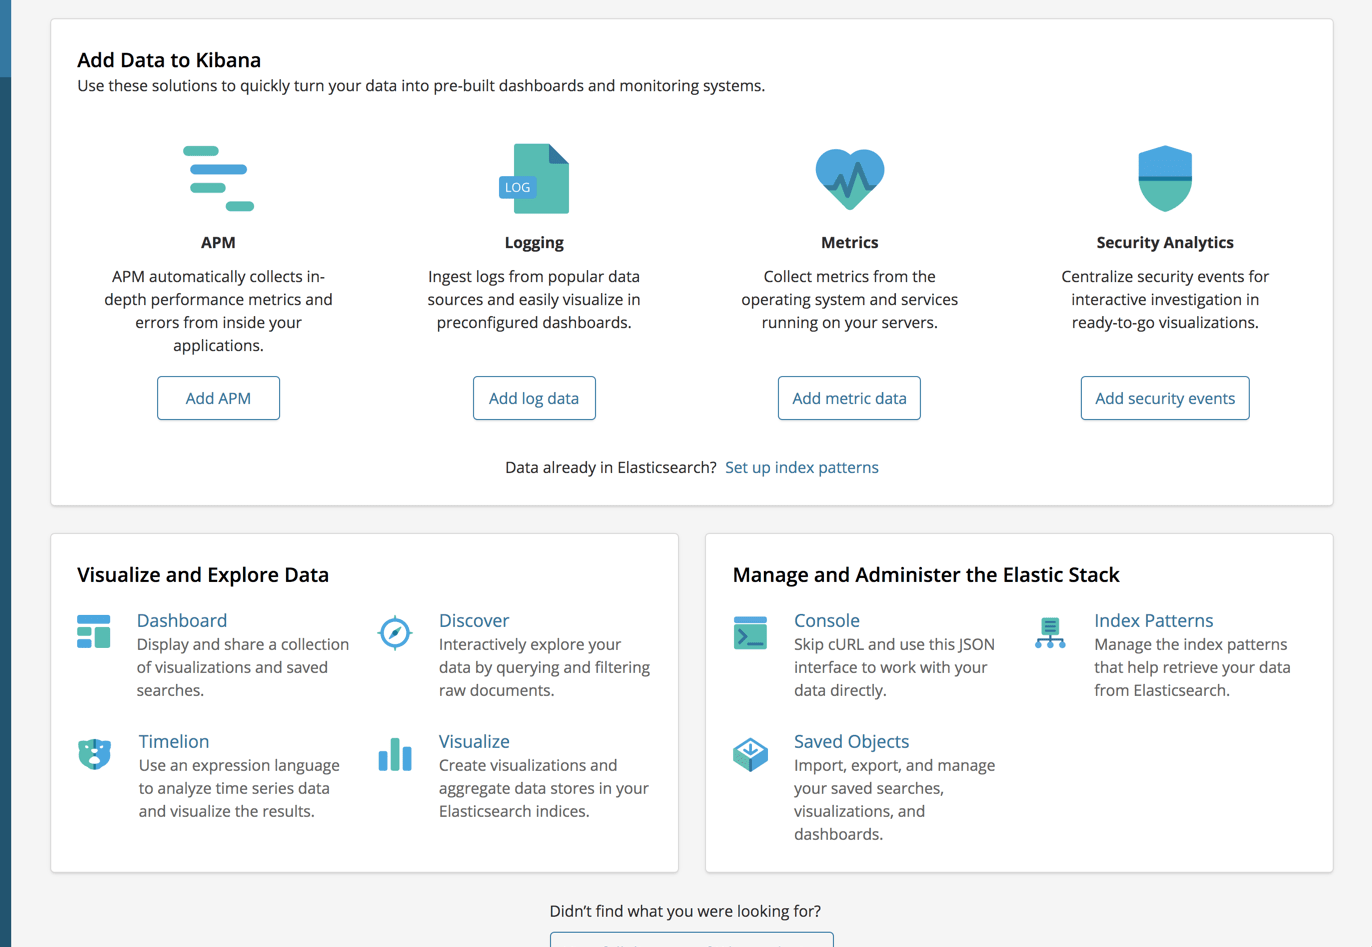
To access Kibana, we can use the same URL we used to access the dashboard with the name of the Kibana service:
http://{IP_address}:8001/api/v1/namespaces/kube-system/services/kibana-logging/proxy/app/kibana
Endnotes
MicroK8s is by far the easiest way I’ve encountered to setup a single-node Kubernetes cluster for a test environment. Yes, it’s Linux-oriented, which might be a bit of hurdle for most developers working with a Mac, but there are options to set MicroK8s on Mac as well as Windows. Installing on a VM and a remote machine are also very simple options, as seen in this example.
While MicroK8s is a quick and easy way to set up a single-node cluster, it already has added the ability to cluster up by adding more worker nodes. This is still somewhat premature but as it stands now, this might be a perfect solution for setting up a multi-node Kubernetes cluster, albeit for development purposes only. More about this option soon.

You Might Also Like

Introducing Scheduled Reporting

