
Integrating Bro IDS with the ELK Stack – Part 2
March 13, 2018

In part 1 of this series, we described how to set up the integration between Bro and the ELK Stack. In this part, we will look into some examples of how to make use of Kibana’s analysis and visualization capabilities to gain insight from the log data Bro makes available.
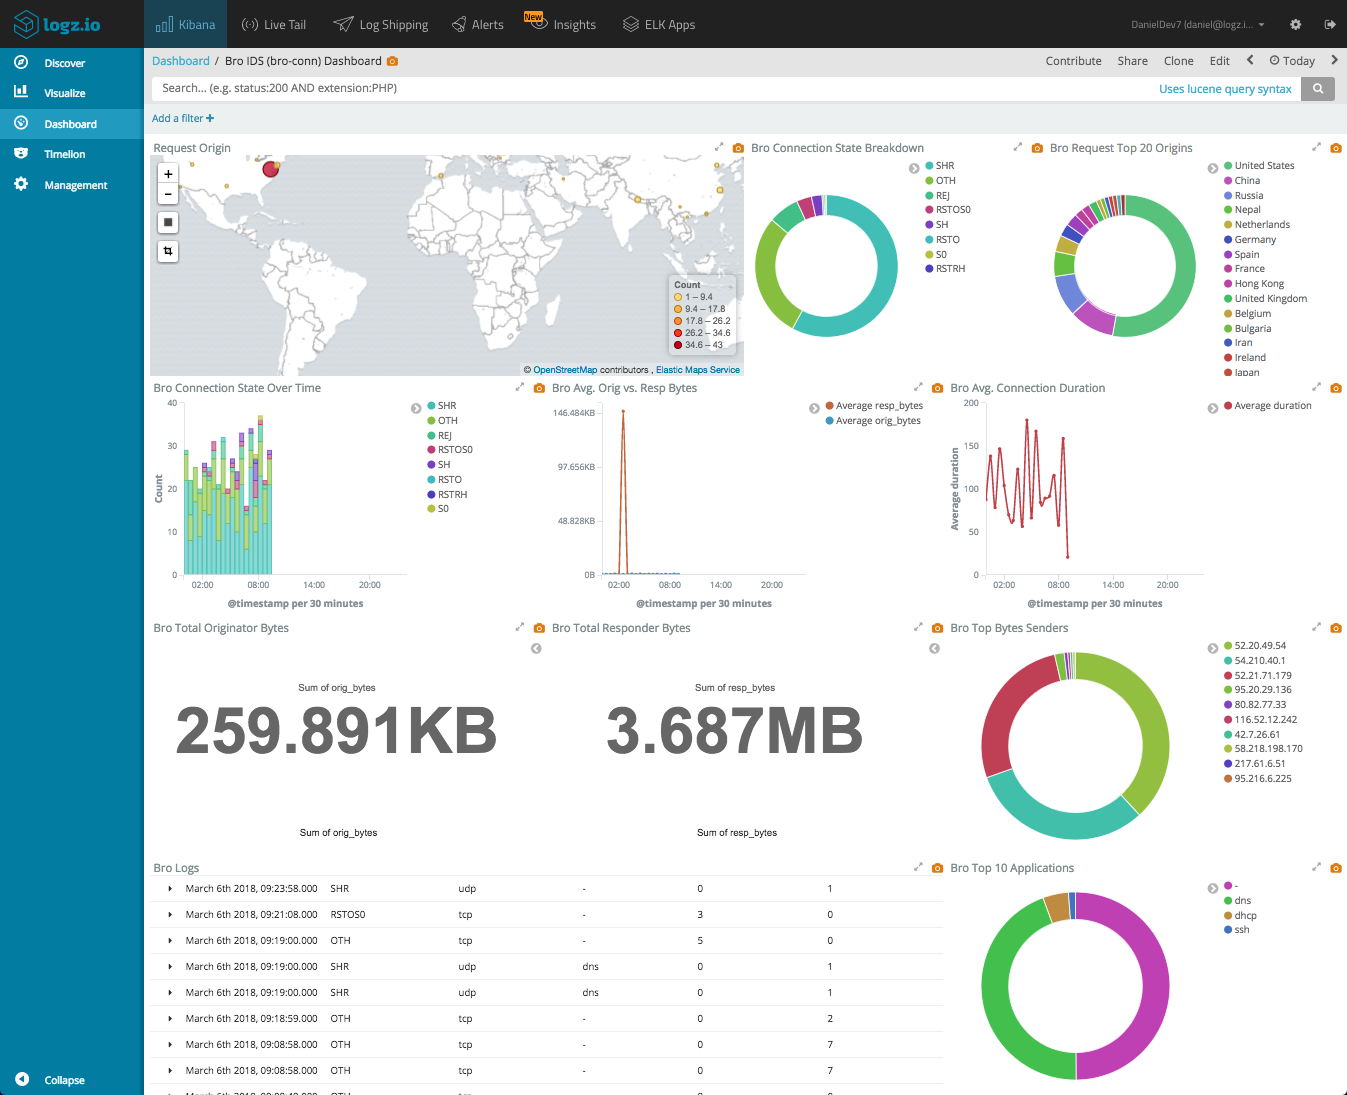
Let’s start with the end-result. Using Kibana, you can set up a comprehensive dashboard that gives you a nice overview of your network traffic. The dashboard below was created for the conn.log we shipped in the previous article, reporting on a network’s TCP/UDP/ICMP connections.

network’s TCP/UDP/ICMP connections dashboard
But let’s begin with the basics.
Querying Bro logs
You’ve got your Bro logs flowing into Elasticsearch and displayed in Kibana. What now?
First, it’s important you understand what you’re looking at and what the different fields parsed by Logstash (or Logz.io) signify.
Bro’s documentation on the subject can help with that, so first be sure to do some research.
Next, start reviewing the data in the Discover page in Kibana. You can open one message as an example and take a look at the fields and their values.
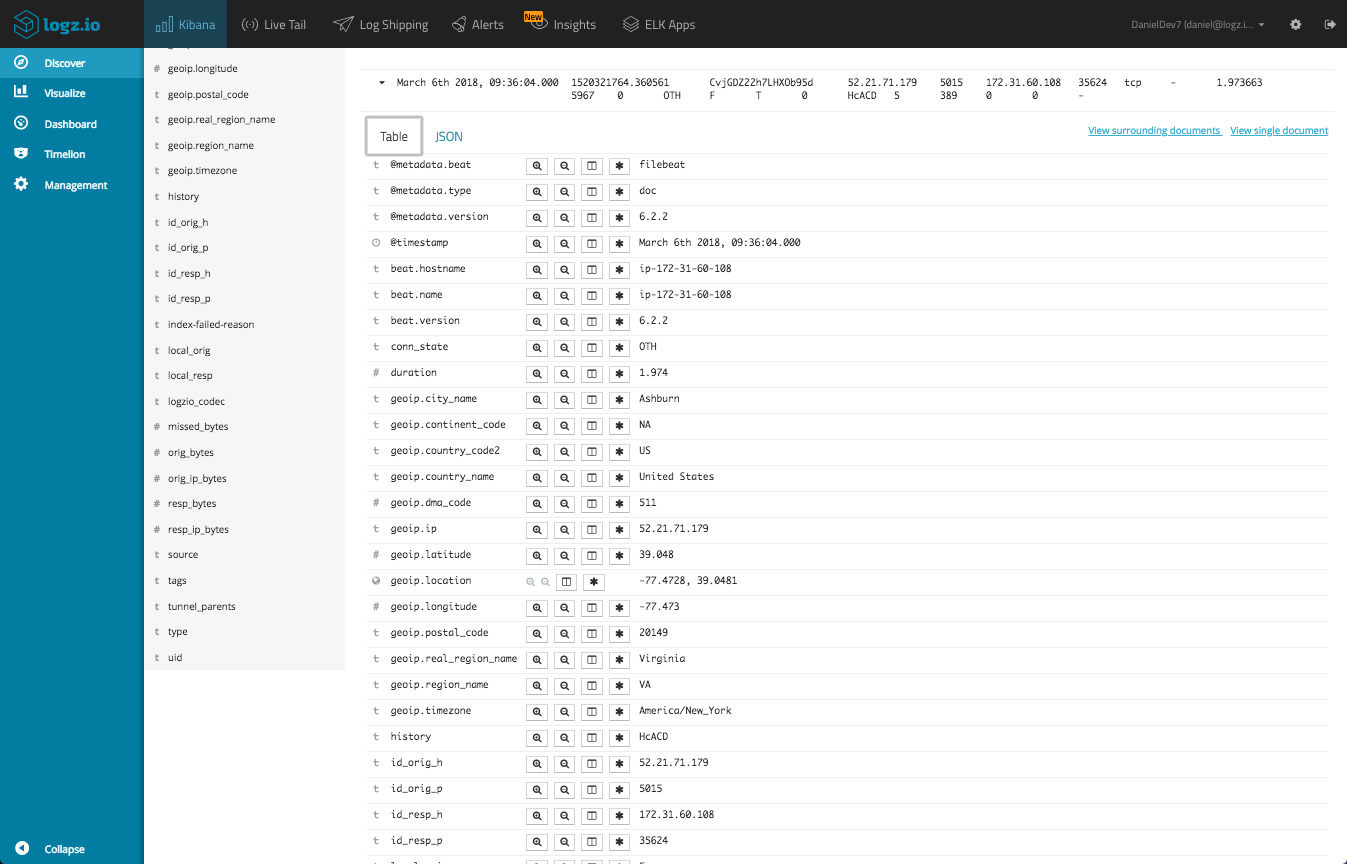
We can see the geographical fields that were added to our messages based on the enrichment we performed in our pipeline configurations.More on the subject:
Here is a list of some of the useful fields available in these logs:
- conn_state – a Bro-assigned state of the connection.
- service – the application protocol being sent over the connection (e.g. DNS).
- duration – how long the connection lasted.
- protocol – transport layer protocol of the connection (e.g. TCP/UDP).
- orig_bytes – number of bytes the originator sent.
- resp_bytes – number of bytes the responder sent.
- orig_pkts – number of packets the originator sent.
- resp_pkts – number of packets the responder sent.
- Ip_orig_h – address of the originator (the field we geo-enriched).
- History – the state history of connections (displayed as a string of letters).
Select some fields from the list of available fields — this will give you some visibility into the messages in the main display area. For example, select the protocol, conn_state and uid fields (we can remove the message field from the list).
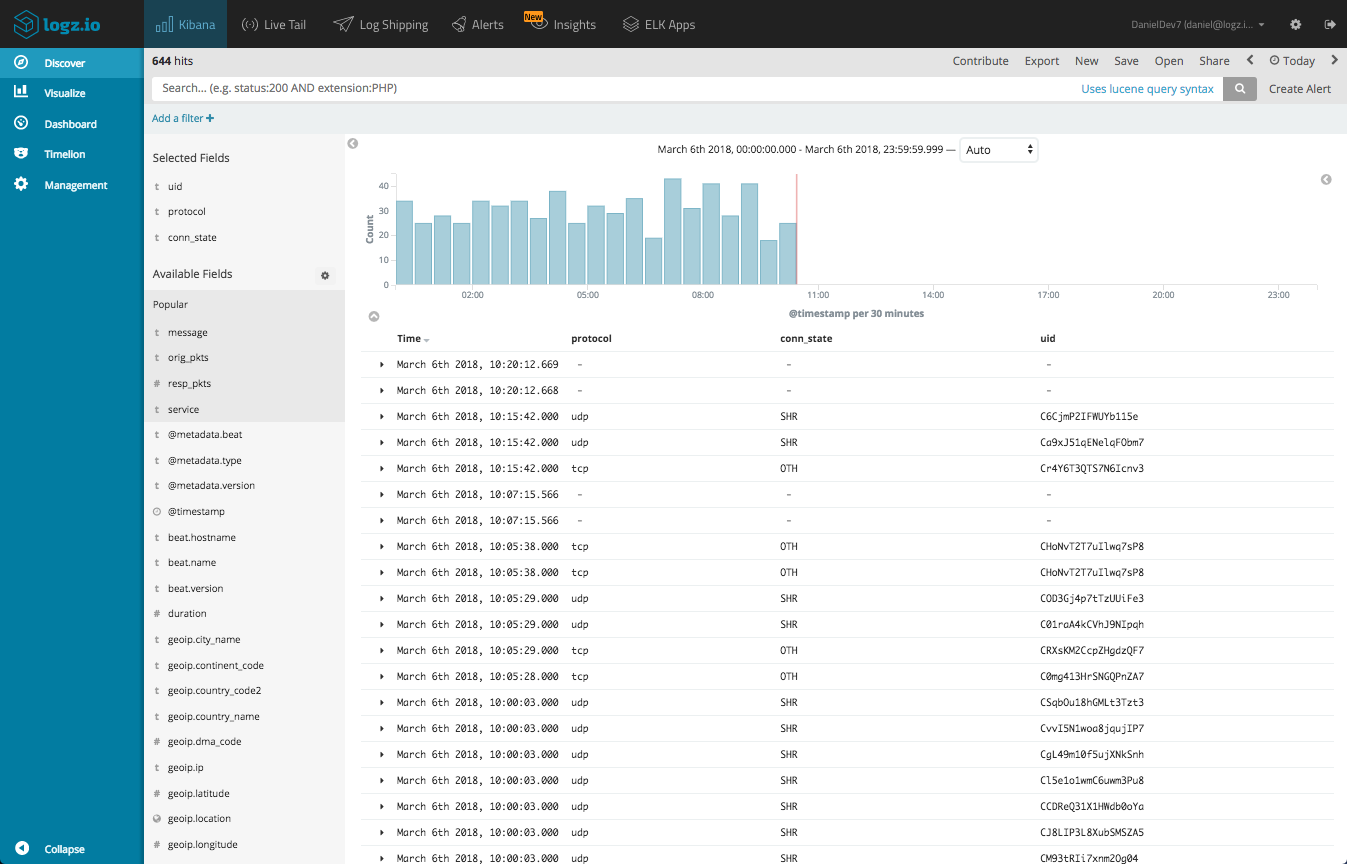
We can enter some queries to search for specific events. For example, say you want to look for TCP connections only:
protocol:tcp
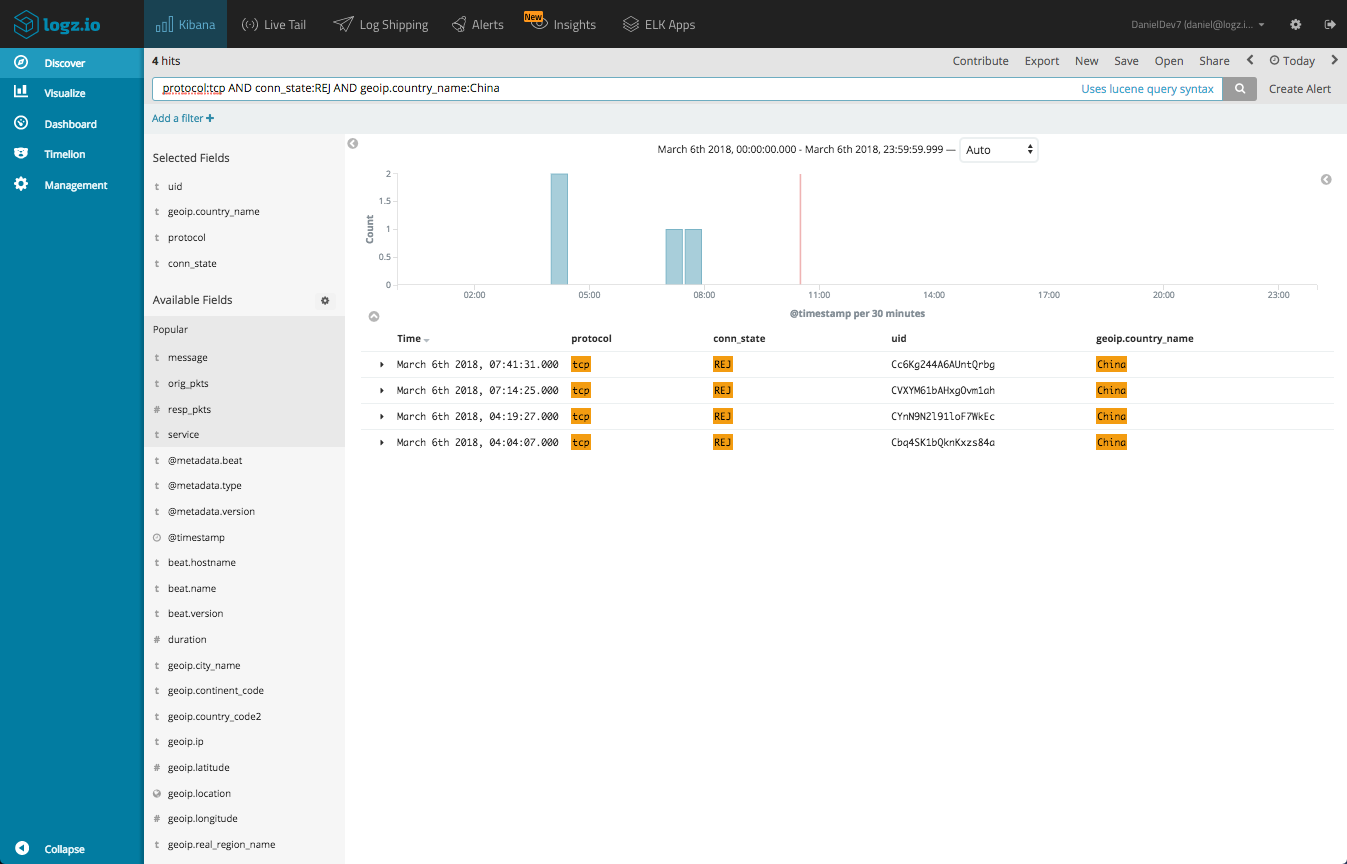
Or, perhaps rejected TCP connections:
protocol:tcp AND conn_state:REJ
Or, rejected TCP connections originating from China:
Visualizing Bro logs
Once you’re more acquainted with your data, you will find it easier to visualize it. Kibana is renowned for its visualization capabilities, allowing you to slice and dice your data in any way you want.
Here are some examples.
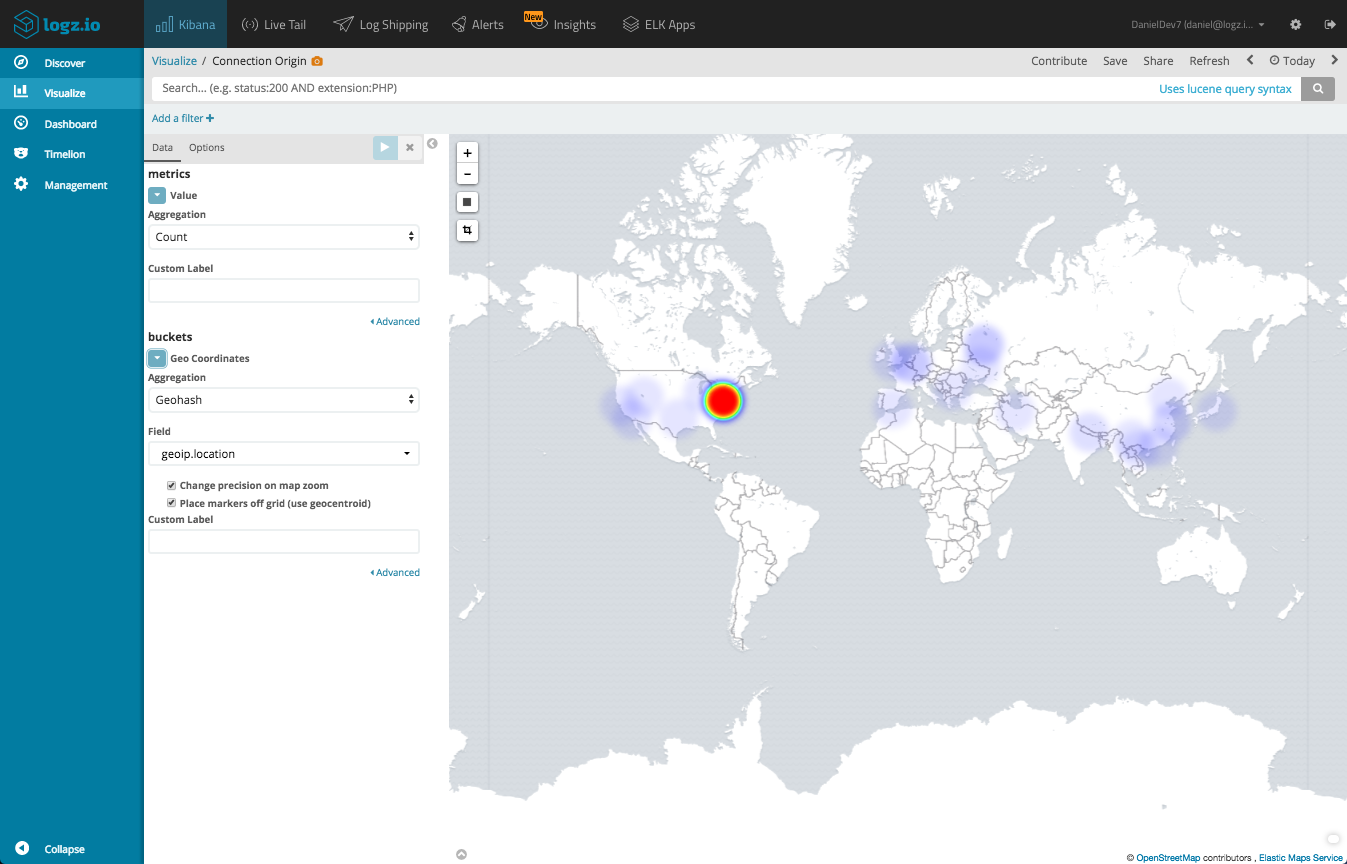
Map of connection originators
Using our geographical fields, we can create a Coordinate Map visualization that gives us a depiction of where in the world connections to our network our originating from.
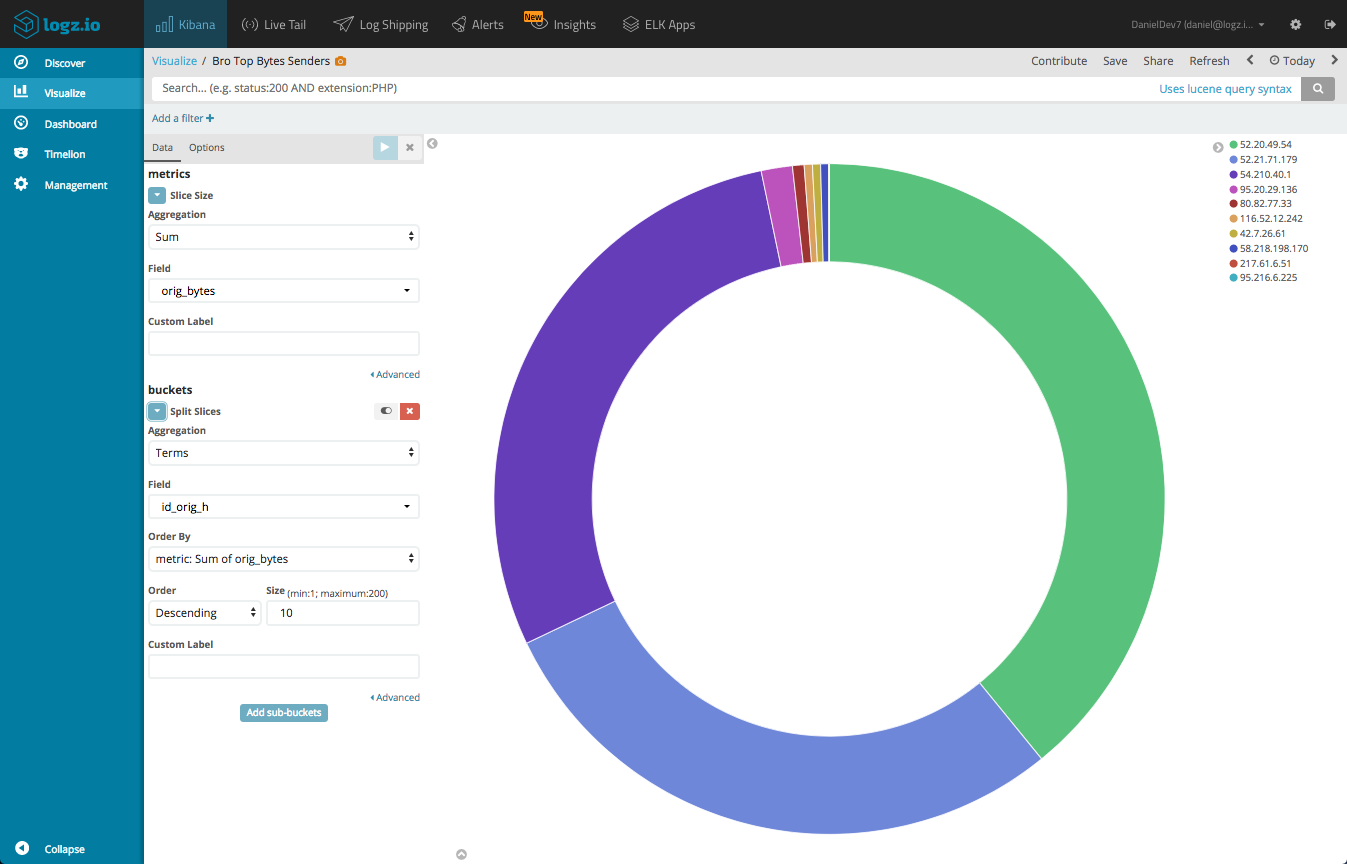
Top IPs per bytes sent
We can create a simple Pie Chart visualization that gives us a breakdown of the IPs sending the most bytes. This is useful for identifying potential malicious behavior. To do this, we will use a Sum aggregation of the orig_bytes field, and a Terms aggregation of the id_orig_h field.
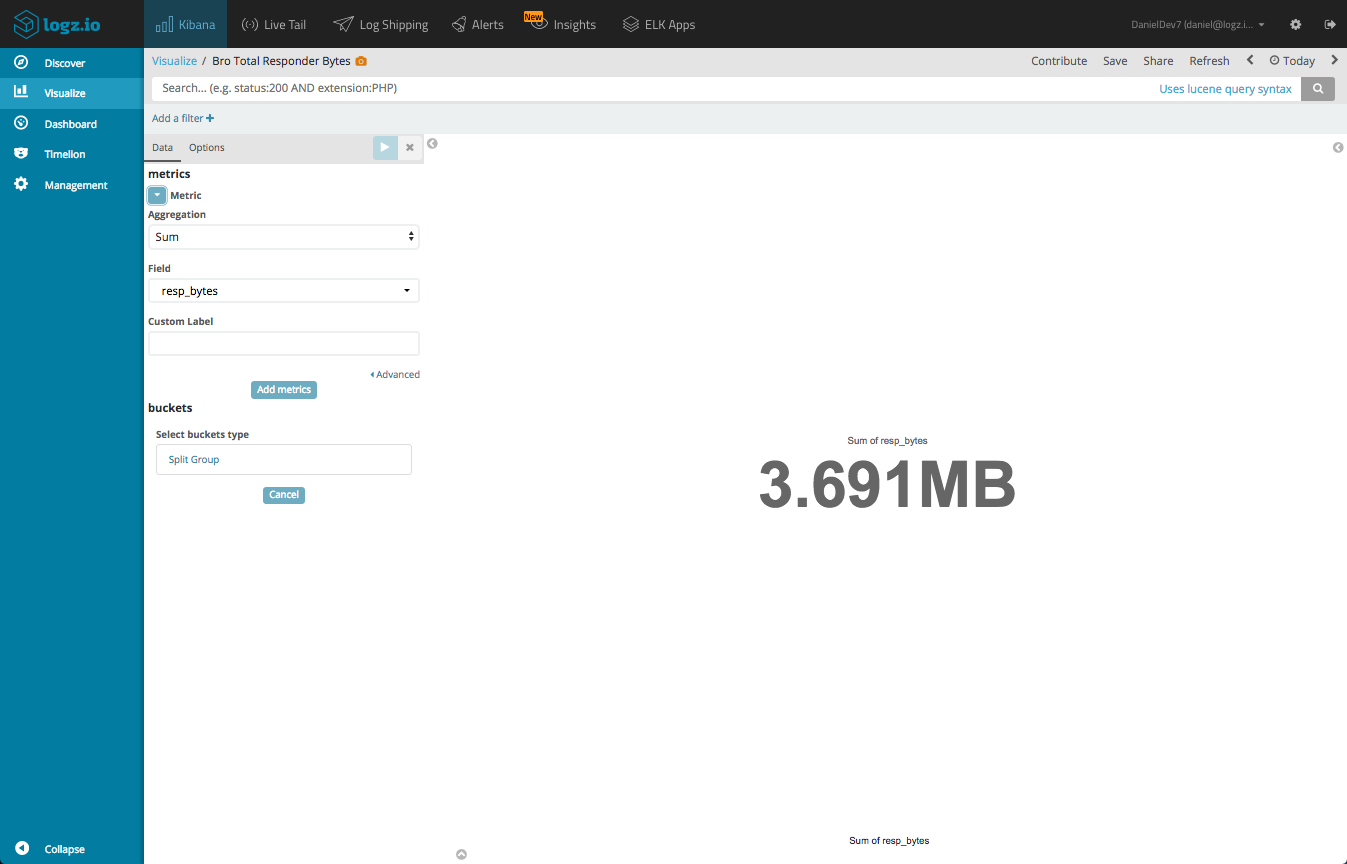
Bytes/Packets Transmitted
Using Metric visualizations, we can sum up key indicators of traffic volume. Here is an example of a metric visualization summing up resp_bytes. We could do the same for the other bytes/packets metrics.
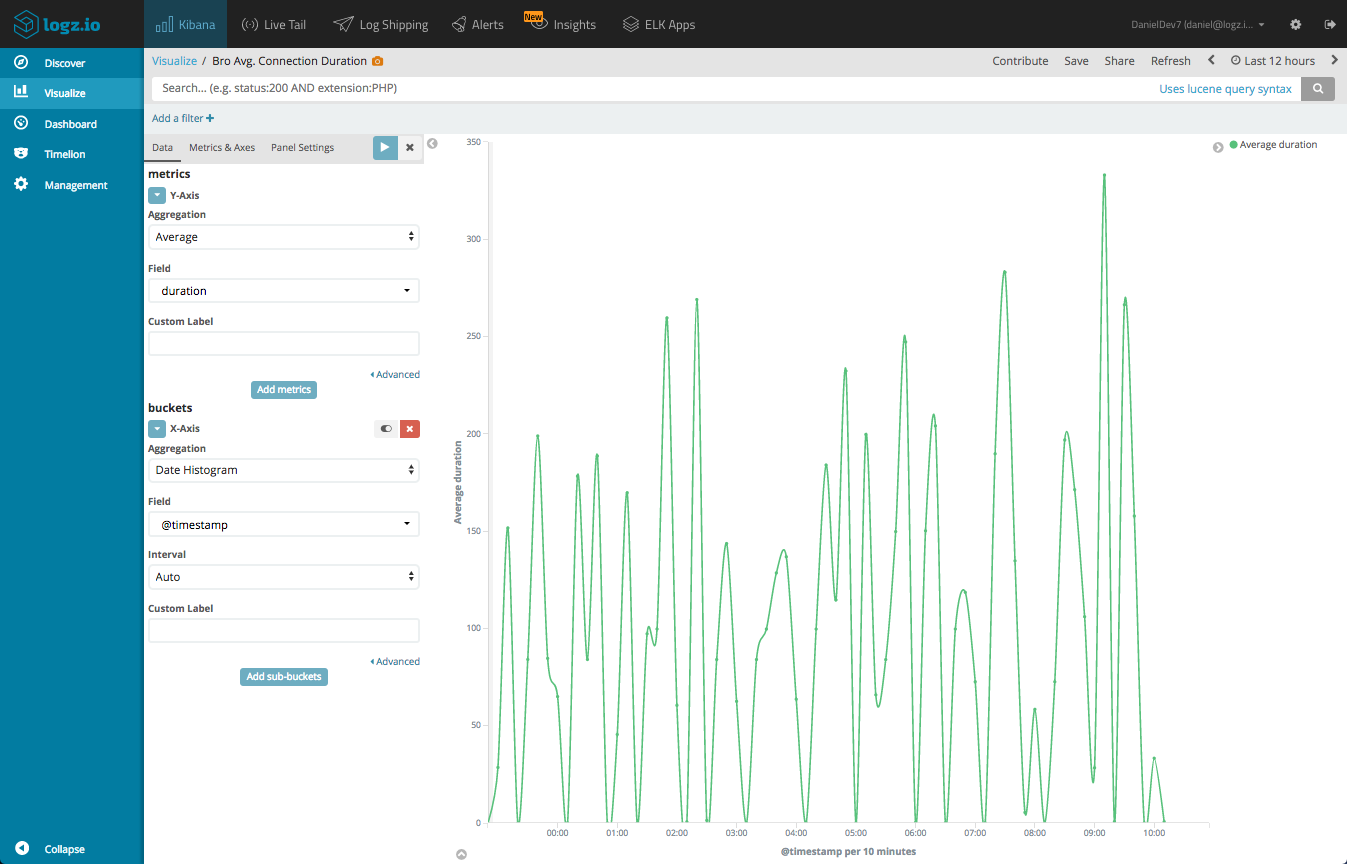
Connection duration
A Line Chart visualization can be created to depict the average duration of connections over time. Again, this could be useful for identifying abnormal network activity. We will use an Average of the duration field, and a Date Histogram for the X Axis.
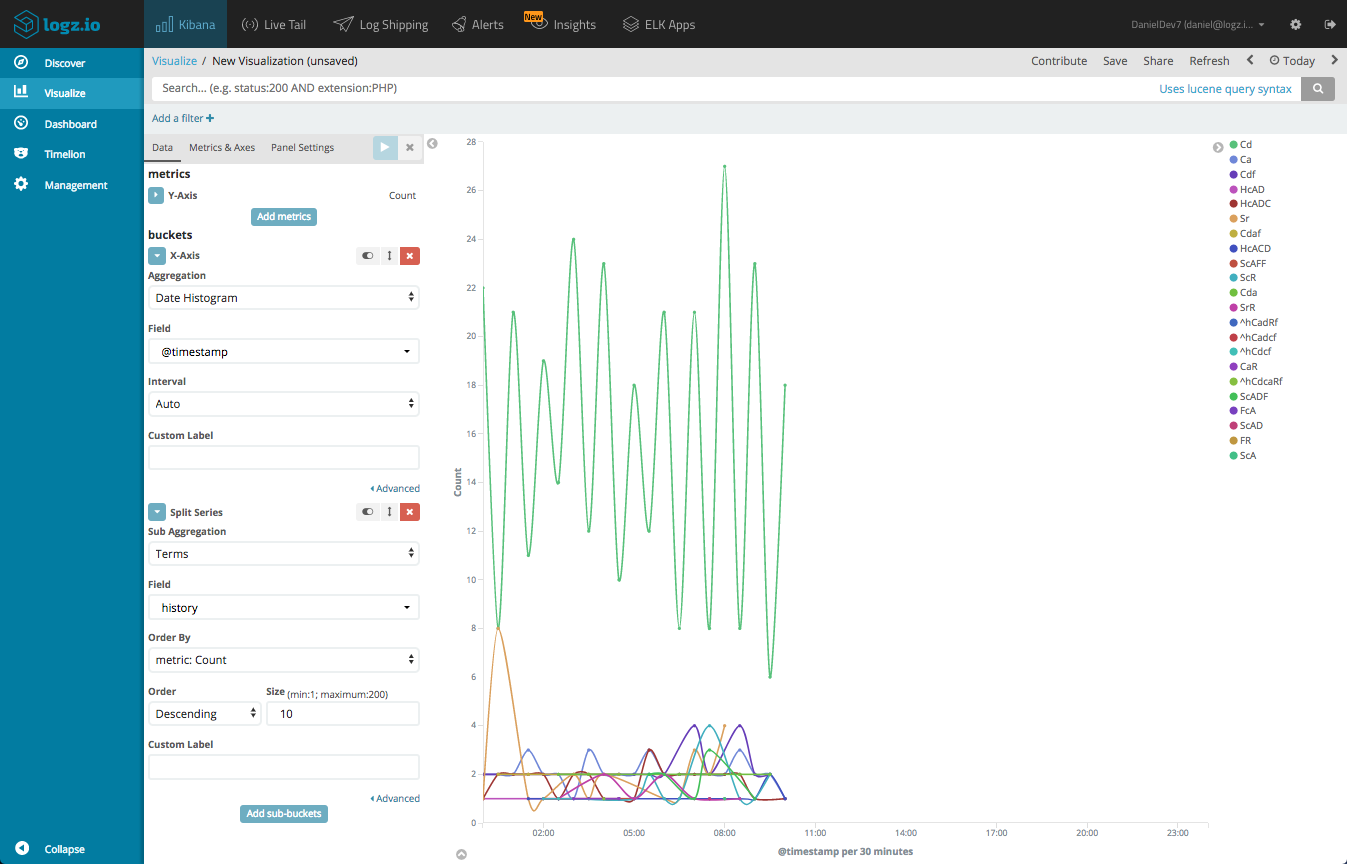
Connection State History
The history field records the state history of connections as a string of letters, each signifying a different event type. For example, a connection with a history value of Cd means that there was a bad checksum from the originator and a payload attached.
You can create a Line Chart visualization that gives you a breakdown of the different connections states over time.
Again, these are just examples. Kibana has plenty more tools to use for visualizing the data and exploring these options is part of the fun. Once you have your separate visualizations lined up, add them all into one dashboard.
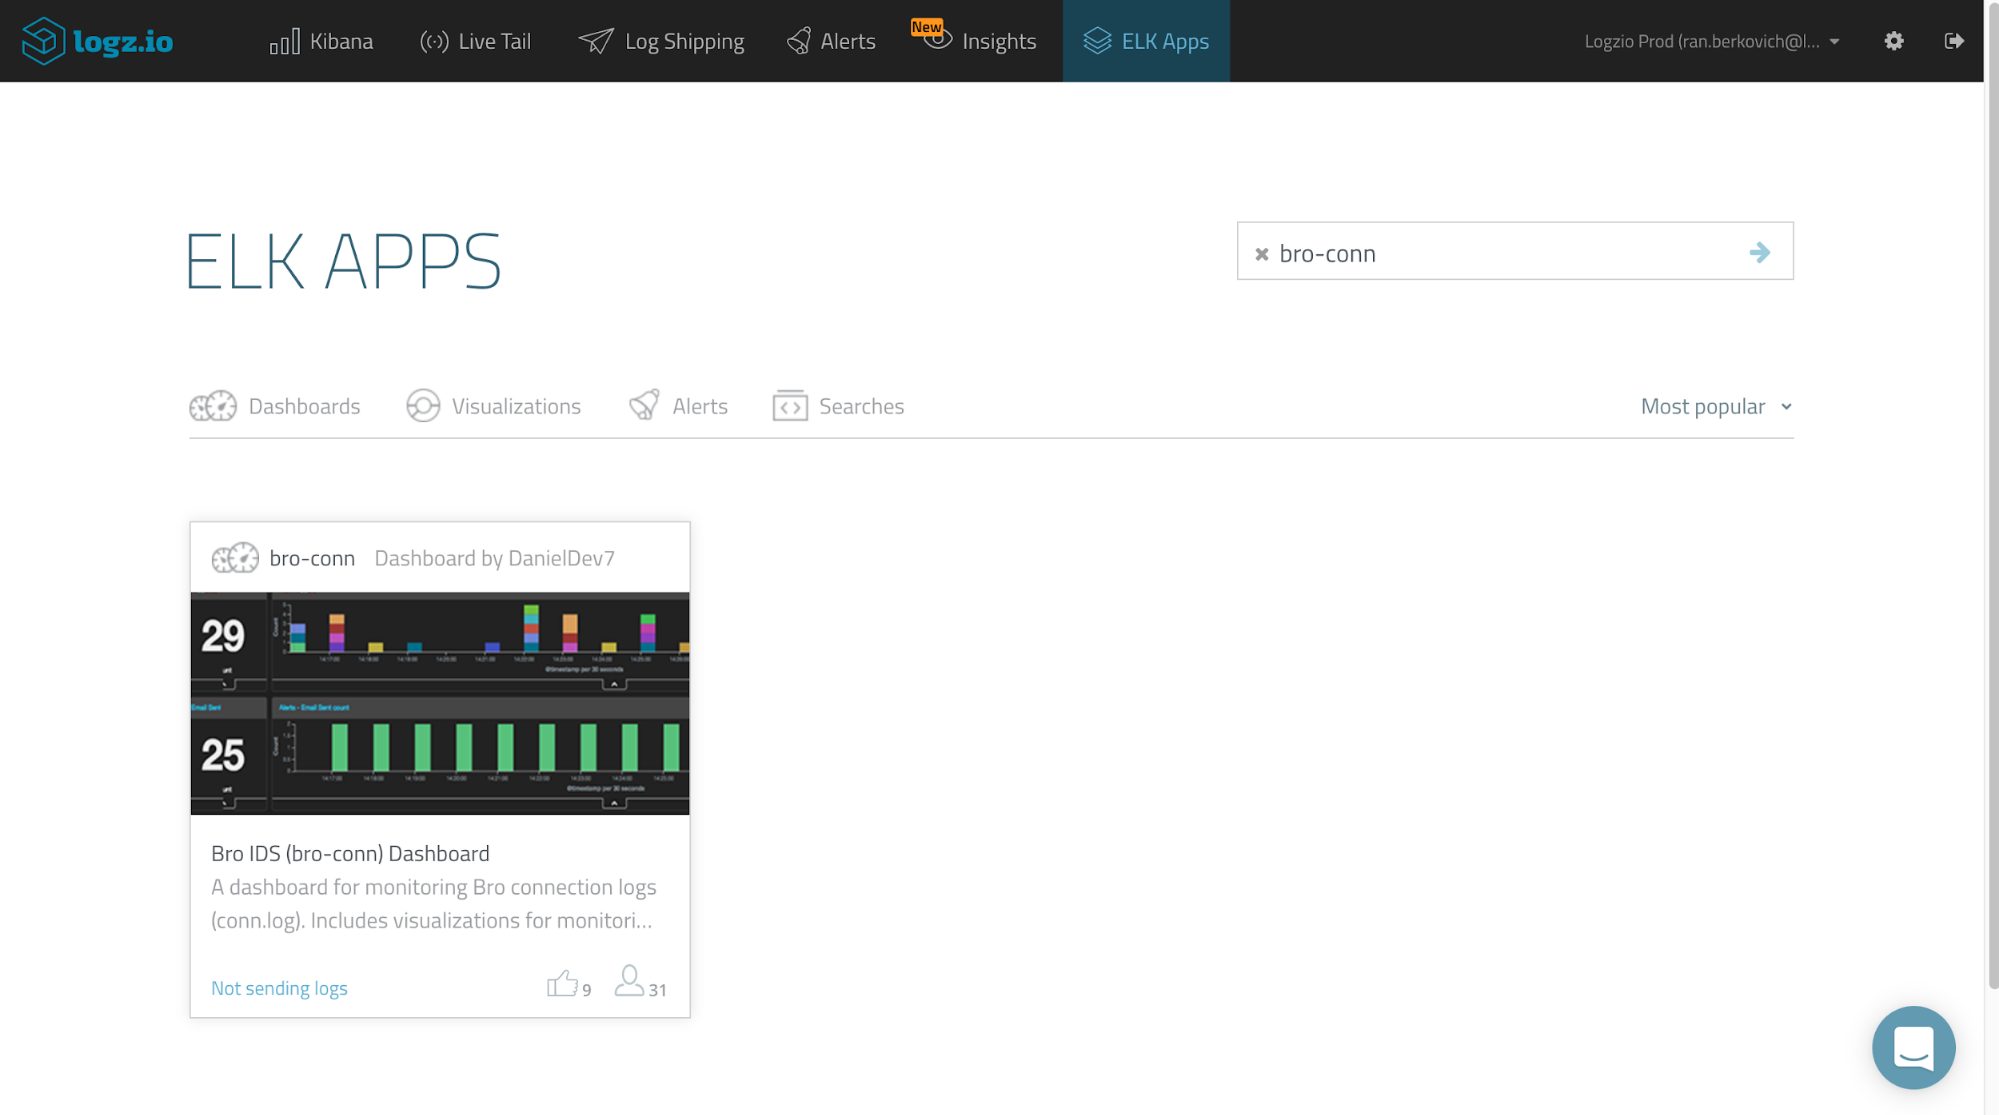
To help you get started, this dashboard is available in ELK Apps — Logz.io’s library of pre-made visualizations and dashboards. Simply open the ELK Apps page, search for “bro-conn” and install the dashboard with one click.
Summary
Bro is an extremely powerful NIDS tool, and logging is one of its major components. In this series we analyzed only one single log type — Bro connection logs, but as mentioned, the tool offers many more log types that can be analyzed and monitored. For example, Bro logs HTTP traffic from your network to an http.log file which can also be used for analysis and auditing purposes.
In any case, hooking up Bro with a centralized logging platform such as the ELK Stack is necessary for easier analysis and visualization, and to make the most out of this data.
To complement the “traditional” analysis steps described in this series with proactive methodologies, you will want to implement an alerting mechanism that will notify you in real-time whenever there is suspicious or abnormal network activity. Bro’s notification framework can be used for this purpose, but requires some configuration and is somewhat limited in scope.
Alerting does not exist in the open source ELK Stack, unless you decide to use the X-Pack or configure your own workaround. Logz.io provides a built-in alerting engine that allows you to configure and create query-based alerts that will notify you either email or any other messaging application you might be using. Future posts will delve into this aspect further.

You Might Also Like

Increasing Implications: Adding Security Analysis to Kubernetes 360 Platform

