Installing the ELK Stack on Alibaba Cloud: Step by Step Guide
June 24, 2019
The ELK Stack is the world’s most popular open source log analytics and log management platform. Together, the four main components of the stack — Elasticsearch, Logstash, Kibana and Beats, provide users with a powerful tool for aggregating, storing and analyzing log data.More on the subject:
In production environments, the ELK Stack requires an infrastructure flexible and powerful enough to power it. This infrastructure needs to be scalable enough to handle data growth and bursts and preferably also be cost-efficient. Providing scalability, on-demand and high-performance resources, as well as flexible pricing models, has made the cloud a popular deployment setup for the ELK Stack.
While Amazon, and increasingly Azure, are the most common ELK deployment scenarios, other clouds are also slowly becoming popular — Google Cloud Platform, Oracle Cloud and Alibaba Cloud. In this article, we will provide instructions for setting up ELK on the latter.
Environment settings
To perform the steps below, we set up a single Alibaba Ubuntu 18.04 machine on an ecs.g5.large instance using its local storage. We set up the security group to enable access from anywhere using SSH and TCP 5601 and 9200 for accessing Kibana and Elasticsearch.

For more information on adding security group rules, read Alibaba’s docs here.
Accessing the Alibaba instance
Depending on your operating system and network type, there are various methods you can use to access Alibaba instances. To connect to our Ubuntu machine from my Mac, I used an SSH keypair that I created when deploying the instance. You can also use password credentials if you like.
To access the machine, first attach the required permissions to the key file:
chmod 400 <pathTofile>
And then use the following command to access:
ssh -i <pathTofile> ubuntu@<publicIP>
You should see the following output in your terminal:
Welcome to Ubuntu 18.04.2 LTS (GNU/Linux 4.15.0-48-generic x86_64)

 * Documentation:  https://help.ubuntu.com
 * Management:     https://landscape.canonical.com
 * Support:        https://ubuntu.com/advantage

Welcome to Alibaba Cloud Elastic Compute Service !
Installing Elasticsearch
The first component of the ELK Stack we will install is Elasticsearch — the heart of the stack.
First, add Elastic’s signing key so that the downloaded package can be verified (skip this step if you’ve already installed packages from Elastic):
wget -qO - https://artifacts.elastic.co/GPG-KEY-elasticsearch | sudo apt-key
add -
Next, we need to then install the apt-transport-https package:
sudo apt-get update
sudo apt-get install apt-transport-https
We will now add the repository definition to your system:
echo "deb https://artifacts.elastic.co/packages/7.x/apt stable main" | sudo
tee -a /etc/apt/sources.list.d/elastic-7.x.list
To install a version of Elasticsearch that contains only features license under Apache 2.0 (aka OSS Elasticsearch):
echo "deb https://artifacts.elastic.co/packages/oss-7.x/apt stable main" |
sudo tee -a /etc/apt/sources.list.d/elastic-7.x.list
All that’s left to do is to update your repositories and install Elasticsearch:
sudo apt-get update && sudo apt-get install elasticsearch
Before we start the Elasticsearch service, we need to enter some basic Elasticsearch configurations. This is done in the Elasticsearch configuration file (On Linux: /etc/elasticsearch/elasticsearch.yml):
sudo su

vim /etc/elasticsearch/elasticsearch.yml
Since we are installing Elasticsearch on Alibaba, we will bind Elasticsearch to localhost. Also, we need to define the private IP of our instance as a master-eligible node:
network.host: "localhost"
http.port:9200
cluster.initial_master_nodes: ["<PrivateIP>"]
Save the file and run Elasticsearch with:
sudo service elasticsearch start
To confirm that everything is working as expected, point curl or your browser to http://localhost:9200, and you should see something like the following output (give Elasticsearch a minute to run):
{
  "name" : "iZt4n7jqxrkqwc2g9wqigjZ",
  "cluster_name" : "elasticsearch",
  "cluster_uuid" : "5-p-7ChvQau4TG0x9XgQzA",
  "version" : {
    "number" : "7.1.1",
    "build_flavor" : "default",
    "build_type" : "deb",
    "build_hash" : "7a013de",
    "build_date" : "2019-05-23T14:04:00.380842Z",
    "build_snapshot" : false,
    "lucene_version" : "8.0.0",
    "minimum_wire_compatibility_version" : "6.8.0",
    "minimum_index_compatibility_version" : "6.0.0-beta1"
  },
  "tagline" : "You Know, for Search"
}
Installing Logstash
Logstash requires Java 8 or Java 11 to run so we will start the process of setting up Logstash with:
sudo apt-get install default-jre
Verify java is installed:
java -version

openjdk version "11.0.3" 2019-04-16
OpenJDK Runtime Environment (build 11.0.3+7-Ubuntu-1ubuntu218.04.1)
OpenJDK 64-Bit Server VM (build 11.0.3+7-Ubuntu-1ubuntu218.04.1, mixed mode, sharing)
Since we already defined the repository in the system, all we have to do to install Logstash is run:
sudo apt-get install logstash
Before you run Logstash, you will need to configure a data pipeline. We will get back to that once we’ve installed and started Kibana.
Installing Kibana
As before, we will use a simple apt command to install Kibana:
sudo apt-get install kibana
Open up the Kibana configuration file at: /etc/kibana/kibana.yml, and make sure you have the following configurations defined:
server.port: 5601
elasticsearch.url: "http://localhost:9200"
These specific configurations tell Kibana which Elasticsearch to connect to and which port to use.
Now, start Kibana with:
sudo service kibana start
Open up Kibana in your browser with: http://localhost:5601. You will be presented with the Kibana home page (Kibana may take a minute or two to load, be patient):

Installing Beats
The various shippers belonging to the Beats family can be installed in exactly the same way as we installed the other components.
As an example, let’s install Metricbeat:
sudo apt-get install metricbeat
To start Metricbeat, enter:
sudo service metricbeat start
Metricbeat will begin monitoring your server and create an Elasticsearch index which you can define in Kibana. In the next step, however, we will describe how to set up a data pipeline using Logstash.
More information on using the different beats is available on our blog: Filebeat, Metricbeat, Winlogbeat, Auditbeat.
Shipping some data
For the purpose of this tutorial, we’ve prepared some sample data containing Apache access logs that is refreshed daily.
Next, create a new Logstash configuration file at: /etc/logstash/conf.d/apache-01.conf:
sudo vim /etc/logstash/conf.d/apache-01.conf
Enter the following Logstash configuration (change the path to the file you downloaded accordingly):
input {
  file {
    path => "/home/ubuntu/apache-daily-access.log"
    start_position => "beginning"
    sincedb_path => "/dev/null"
  }
}

filter {
    grok {
      match => { "message" => "%{COMBINEDAPACHELOG}" }
    }
    date {
    match => [ "timestamp" , "dd/MMM/yyyy:HH:mm:ss Z" ]
  }
    geoip {
      source => "clientip"
    }
}

output {
  elasticsearch {
    hosts => ["localhost:9200"]
  }
}
Start Logstash with:
sudo service logstash start
If all goes well, a new Logstash index will be created in Elasticsearch, the pattern of which can now be defined in Kibana.
In Kibana, go to Management → Kibana Index Patterns. Kibana will automatically identify the new “logstash-*” index pattern (along with the Metricbeat index if you followed the steps for installing and running Metricbeat).
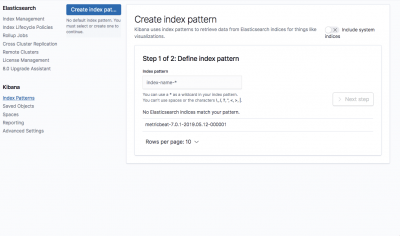
Enter “logstash-*” as the index pattern, and in the next step select @timestamp as your Time Filter field.

Hit Create index pattern, and you are ready to analyze the data. Go to the Discover tab in Kibana to take a look at the data (look at today’s data instead of the default last 15 mins).
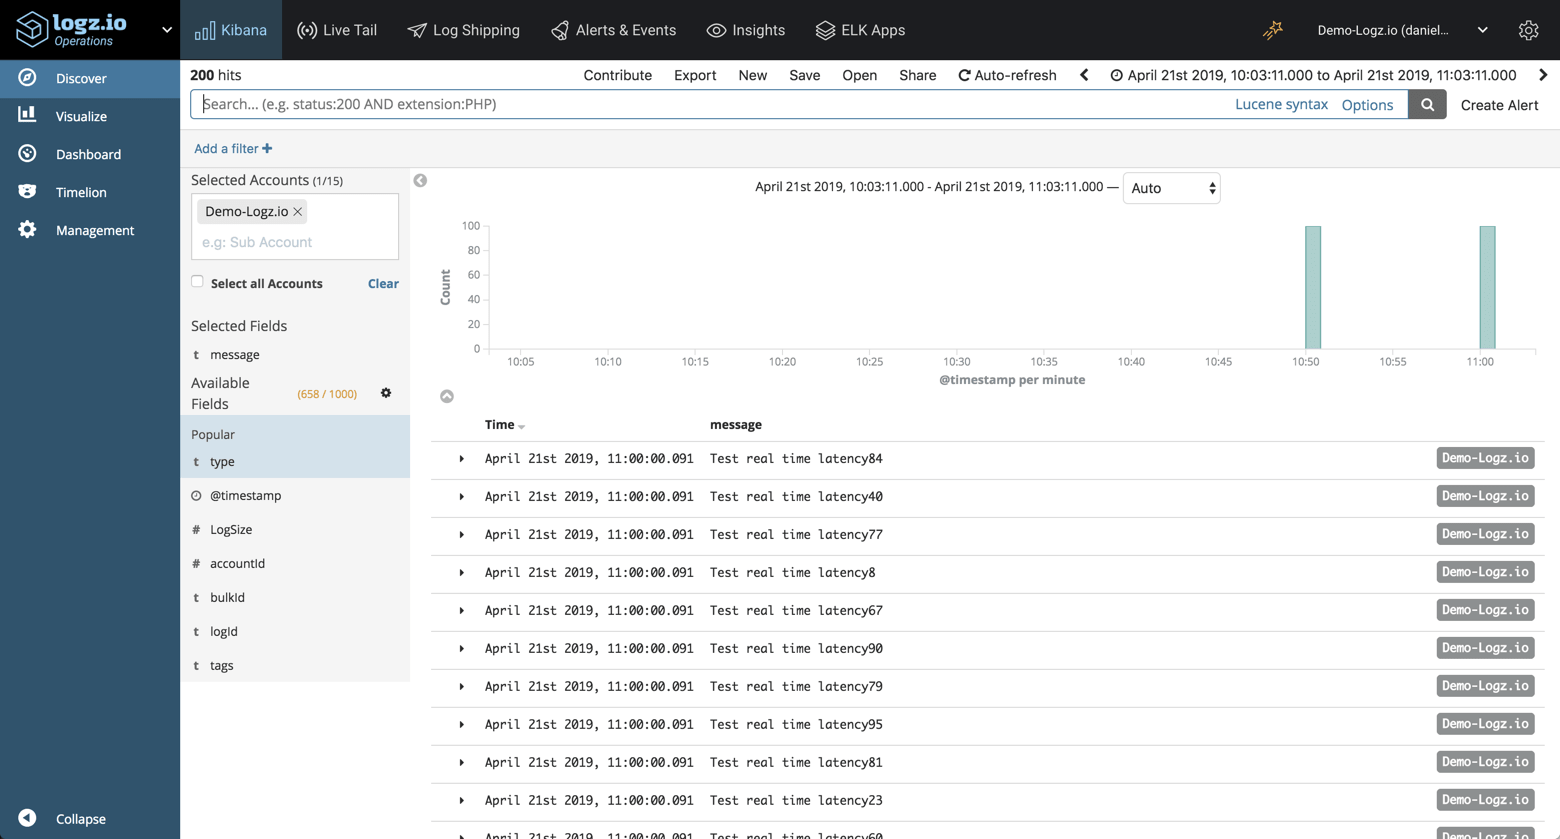
Congratulations! You have successfully installed ELK on Alibaba and set up your first data pipeline!
What’s next?
Working with ELK involves learning the different components comprising the stack — Elasticsearch, Logstash, Kibana and Beats. The more you learn, the easier it will be to build more complex data pipelines and analyze the data itself. To help get started, I recommend reading some of the following articles on our blog:
Once your data grows, the ELK Stack can become a bit more difficult to handle. The following resources can help out with building a more resilient and scalable stack:
Enjoy!

You Might Also Like

Logz.io™ Platform Demo