
Logging Cloud Foundry Applications with the ELK Stack
July 31, 2017
Cloud Foundry is one of the leading cloud PaaS solutions out there today, allowing users to easily develop and deploy applications by doing all the worrying about the underlying infrastructure of your applications for you.
Nothing in life is totally care-free, and if you’re running apps on Cloud Foundry you still need to take care of troubleshooting and monitoring them. This requires extra planning, configuration and implementation.
Cloud Foundry’s Loggregator component captures logs from the various components and applications running on the platform, aggregates these logs, and gives users full access to the data either via CLI or the management console. Cloud Foundry can also be configured to export the log data to an external logging solution, and in this article, we will look into exporting this data into the ELK Stack (Elasticsearch, Logstash, Kibana).
There a few basic requirements for following the steps outlined below:
- Cloud Foundry – you will need a Pivotal account to be able to deploy your Cloud Foundry application.
- ELK – you will need either your own ELK deployment or a Logz.io account. The steps below describe shipping logs to both, so take your pick.
Let’s get started.
Deploying a Sample Application to Cloud Foundry
The first step is to deploy a sample Spring application.
To do this we need to first install the Cloud Foundry’s command line utility, cf-cli (commands below apply to install on Debian):
$ wget -q -O - https://packages.Cloud Foundry.org/debian/cli.Cloud Foundry.org.key | sudo apt-key add -

$ echo "deb https://packages.Cloud Foundry.org/debian stable main" | sudo tee /etc/apt/sources.list.d/Cloud Foundry-cli.list

$ sudo apt-get update

$ sudo apt-get install cf-cli
Next, we’re going to deploy Cloud Foundry’s sample Spring app:
$ git clone https://github.com/Cloud Foundry-samples/cf-sample-app-spring.git

$ cd cf-sample-app-spring
Log into your Pivotal account with your email and password, and deploy the app:
$ cf login -a https://api.run.pivotal.io

$ cf push
The application will then be installed. You should see the following lines at the end of the generated output in your terminal:
state   since                 cpu   memory         disk         details

#0  running   2017-07-10 12:25:00 PM   50.9%   248.9M of 768M   153.8M of 1G
Open the Pivotal console in your browser, you will see the Spring application running:
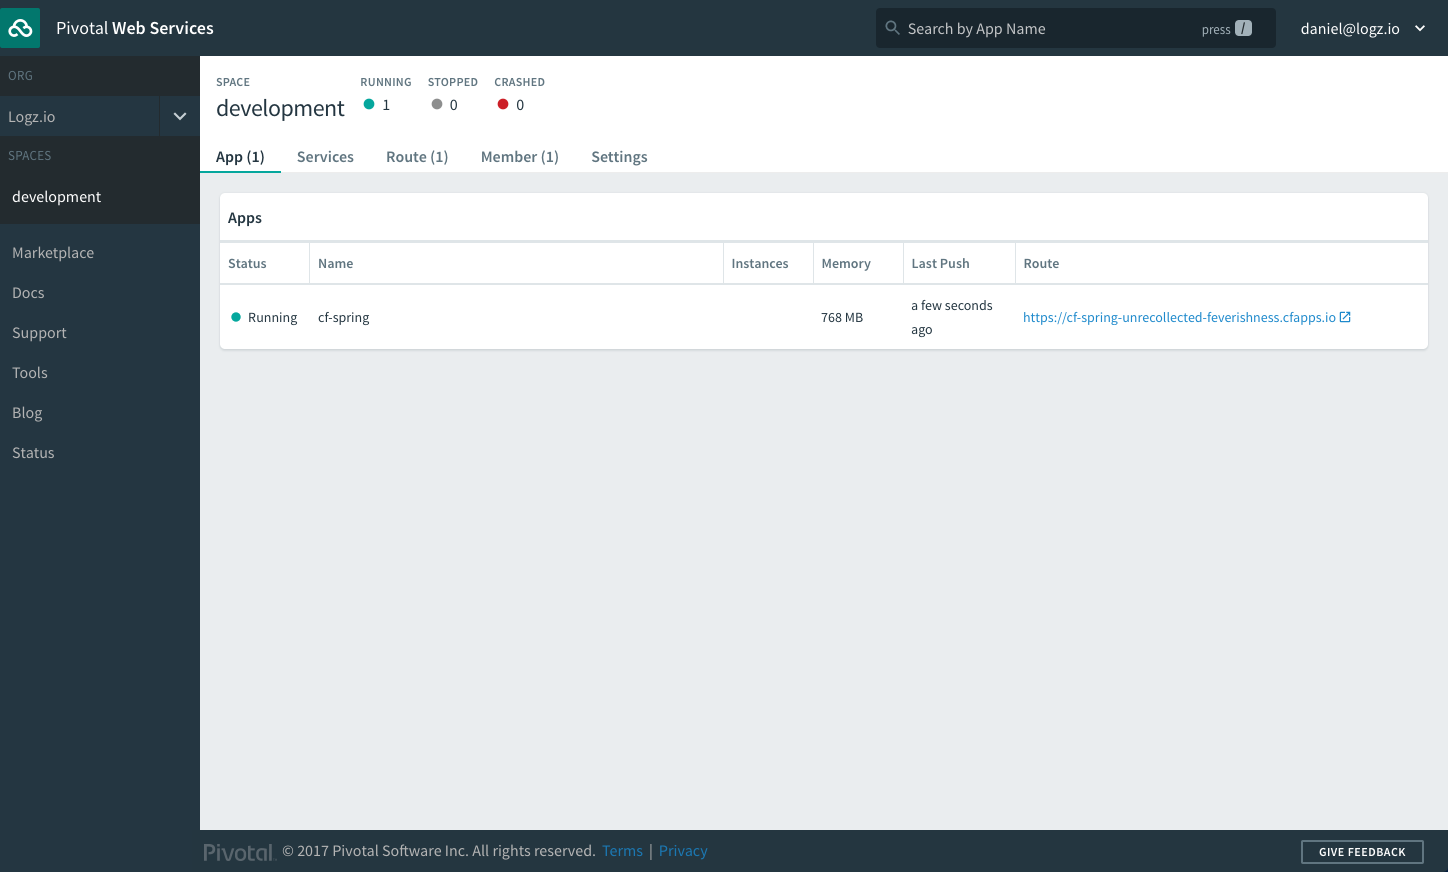
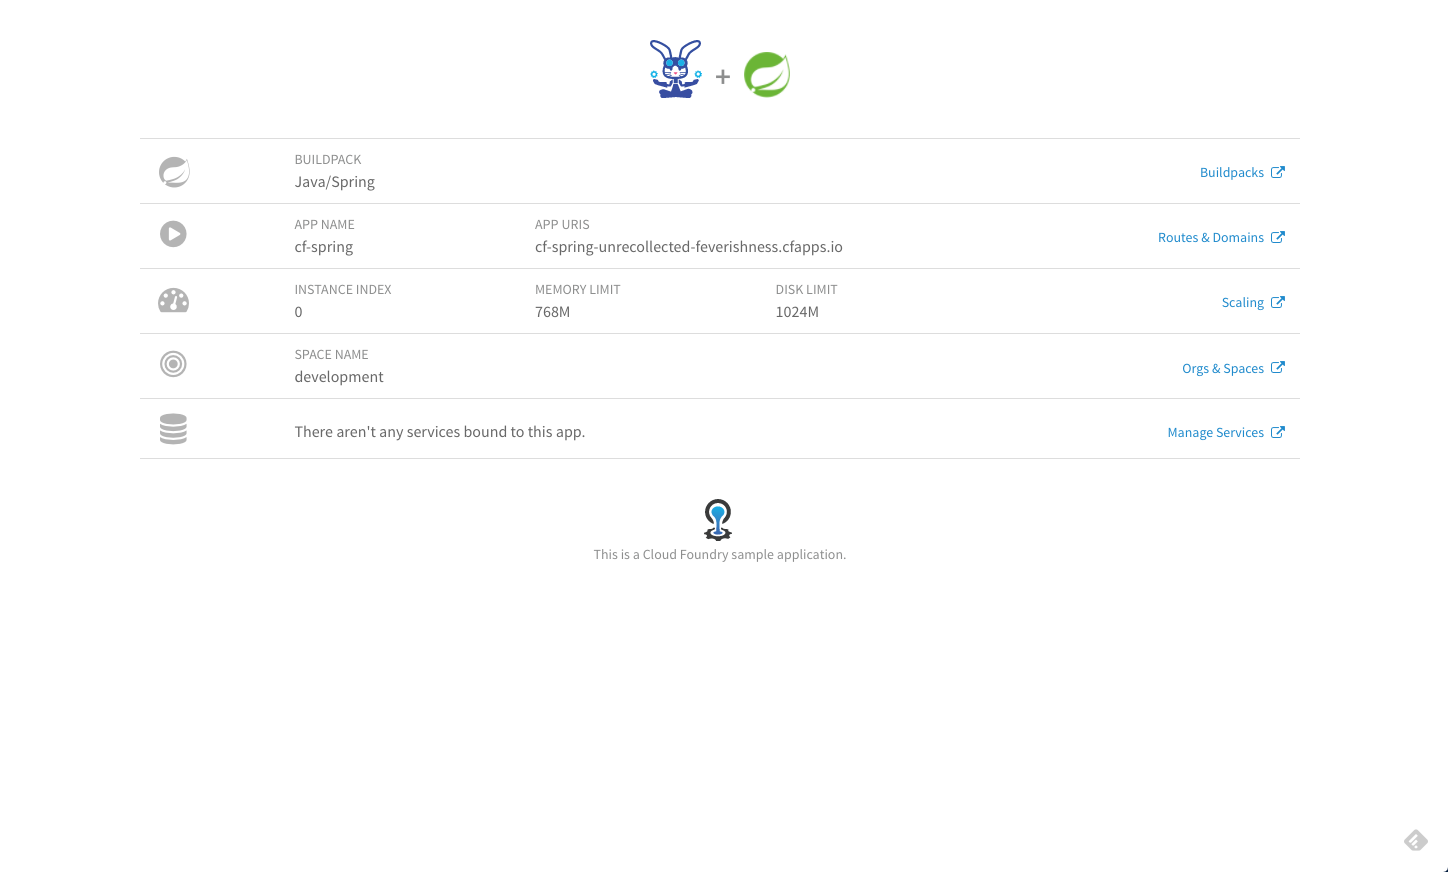
Click on the supplied URL to view the application (the URL is also displayed in the command output when deploying the app):
Cloud Foundry Logging
Cloud Foundry aggregates application logs and gives you access to them either in the Pivotal management console or within CLI. These logs include HTTP access logs, as well as output from app operations such as scaling, restarting, and re-staging.
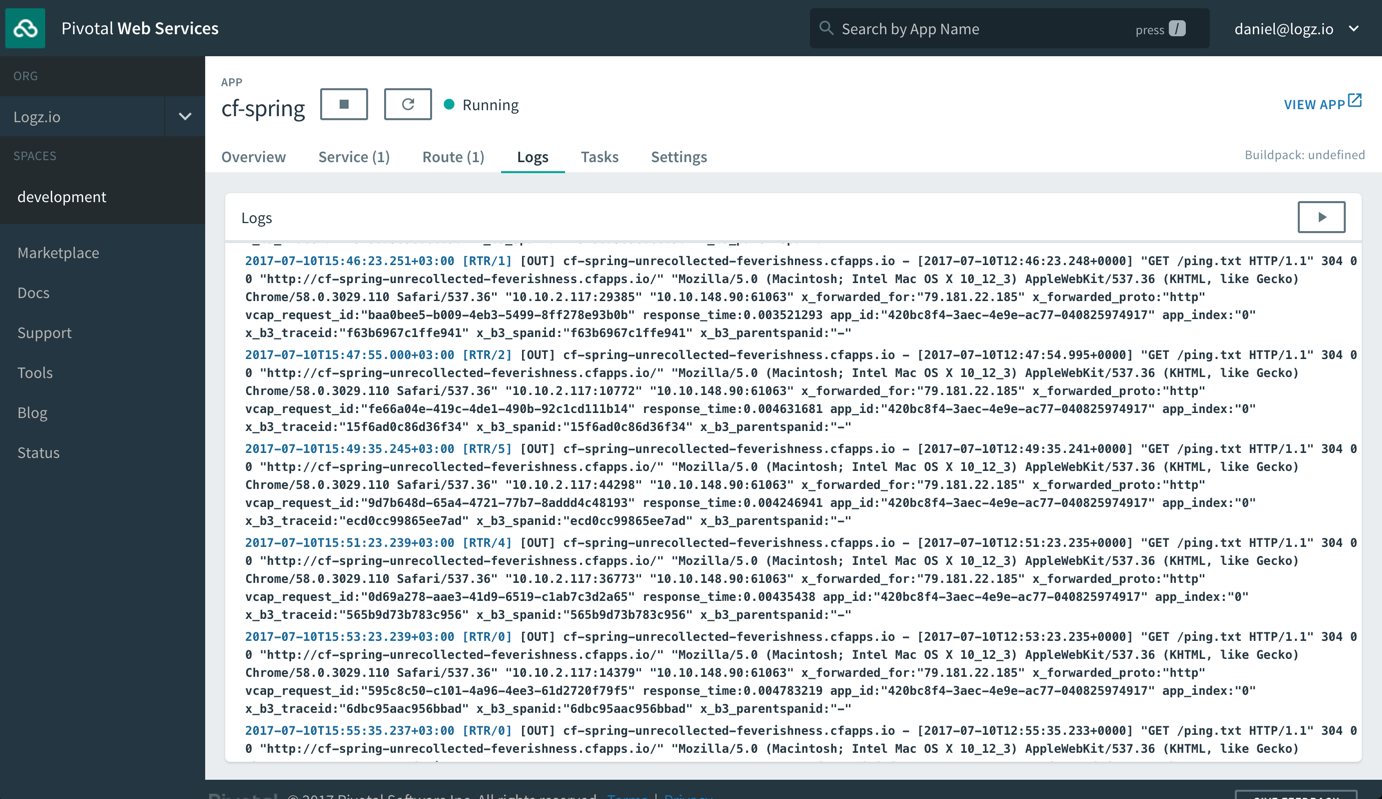
The logs will usually contain four fields: Timestamp, log type, channel and message. From within cf-cli, you can view or tail the logs using these commands:
cf logs cf-spring --recent

cf logs cf-spring
Shipping to ELK
On the premise that you already have an ELK Stack running, shipping Cloud Foundry logs to ELK consists of two main steps: configuring Logstash and creating/binding a log draining service.
Configuring Logstash
To make sure your logs are parsed correctly, you need to configure the Logstash configuration file.
Cloud Foundry formats logs according to the RFC5424 syslog standard and the configuration example below uses the syslog input plugin to tell Logstash to listen on port 5000, and various filter plugins to parse the data:
input {
 tcp {
 port => 5000
 type => syslog
 }
 udp {
 port => 5000
 type => syslog
 }
 }

filter {
 if [type] == "syslog" {
 grok {
 match => { "message" => "%{SYSLOG5424PRI}%{NONNEGINT:syslog5424_ver} +(?:%{TIMESTAMP_ISO8601:syslog5424_ts}|-) +(?:%{HOSTNAME:syslog5424_host}|-) +(?:%{NOTSPACE:syslog5424_app}|-) +(?:%{NOTSPACE:syslog5424_proc}|-) +(?:%{WORD:syslog5424_msgid}|-) +(?:%{SYSLOG5424SD:syslog5424_sd}|-|) +%{GREEDYDATA:syslog5424_msg}" }
 }
 syslog_pri { }
 date {
 match => [ "syslog_timestamp", "MMM  d HH:mm:ss", "MMM dd HH:mm:ss" ]
 }
 if !("_grokparsefailure" in [tags]) {
 mutate {
 replace => [ "@source_host", "%{syslog_hostname}" ]
 replace =>[ "@message", "%{syslog_message}" ]
 }
 }
 mutate {
 remove_field => [ "syslog_hostname", "syslog_message", "syslog_timestamp" ]
 }
 }
 }

output {
 elasticsearch { hosts > ["localhost:9200"]}
 }
Save the file and start Logstash.
Creating and Binding a Logging Service
The next step is to create a Cloud Foundry logging service that will drain the logs to syslog and then bind this service to our application.
Create the service with (replace <logstash-server> with the IP of the server where your Logstash instance is installed):
$ cf cups log-drain -l syslog://<logstash-serve>:5000
Bind the new logging service to the application with these commands:
$ cf bind-service cf-spring log-drain
$ cf restart cf-spring
If all works as expected, you will be able to define the logstash-* index pattern in Kibana and subsequently begin seeing logs within a minute or two.

Shipping to Logz.io
Shipping to the Logz.io ELK Stack does not differ all too much than the procedure described above except that parsing is handled by Logz.io automatically so all that is needed is to configure and bind a logging service.
IMPORTANT! Logz.io automatic parsing for Cloud Foundry logs is not complete and is still being developed. The logs may not appear as expected.
Use this command, and insert your Logz.io user token in the right placeholder (the token can be retrieved from the Settings page in the UI):
$ cf cups my-log-drain -l https://listener.logz.io:8081?token=your-logz.io-token
$ cf bind-service cf-spring my-log-drain
$ cf restart cf-spring
After a short delay, logs begin to flow automatically. Be sure to refresh mapping from the Setting page.
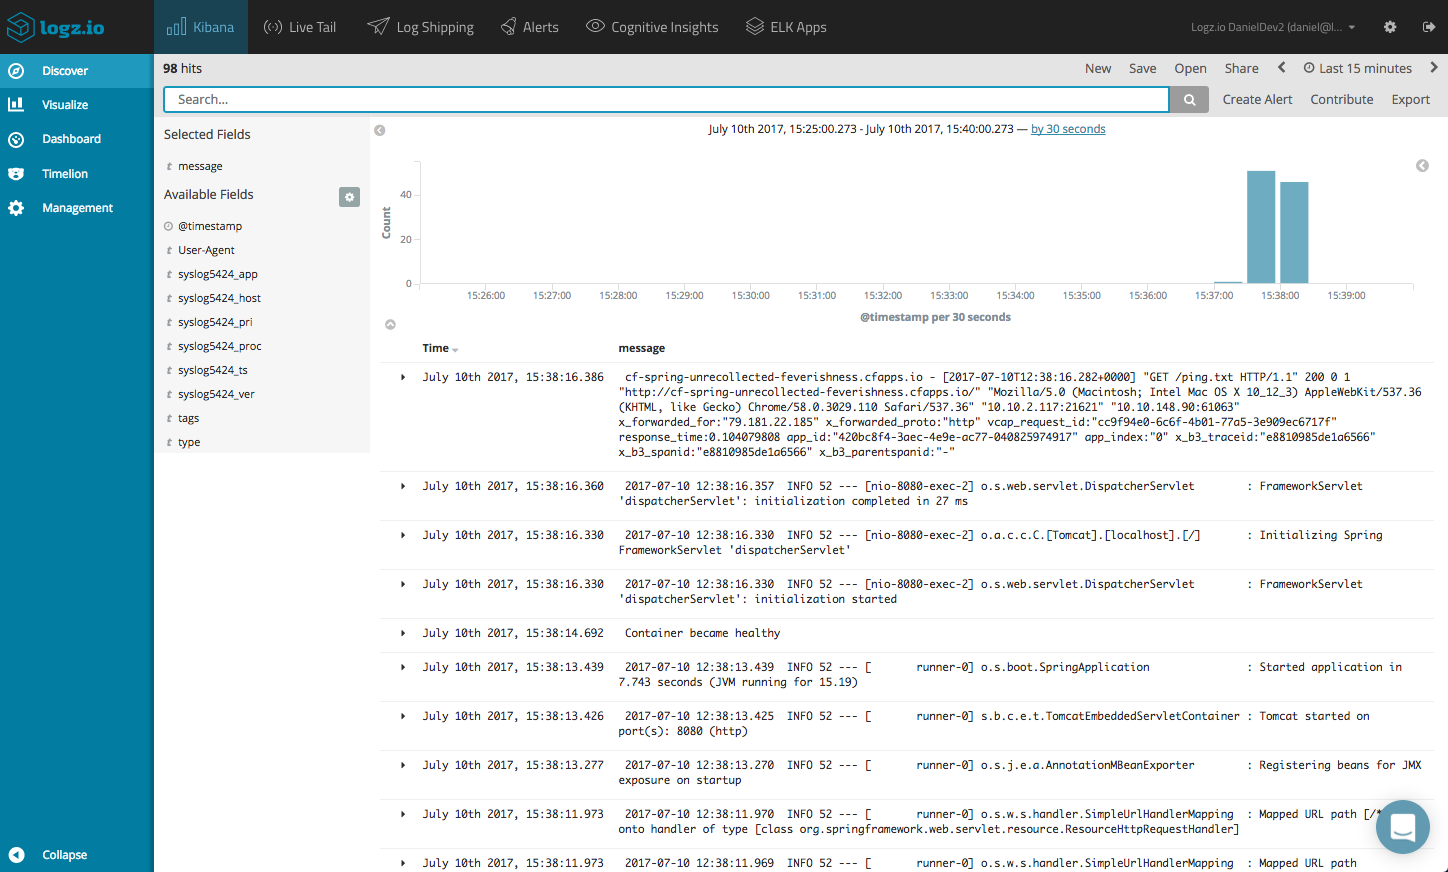
Analyzing and Visualizing the Logs
Slicing and dicing data in Kibana is an art unto itself. Depending on what application you have deployed on Cloud Foundry and how you’ve set up logging from within your code will ultimately change the way analysis is performed.
Here are some basic examples of what can be done with Kibana with the Cloud Foundry logs (screenshots are from the Logz.io version of Kibana).
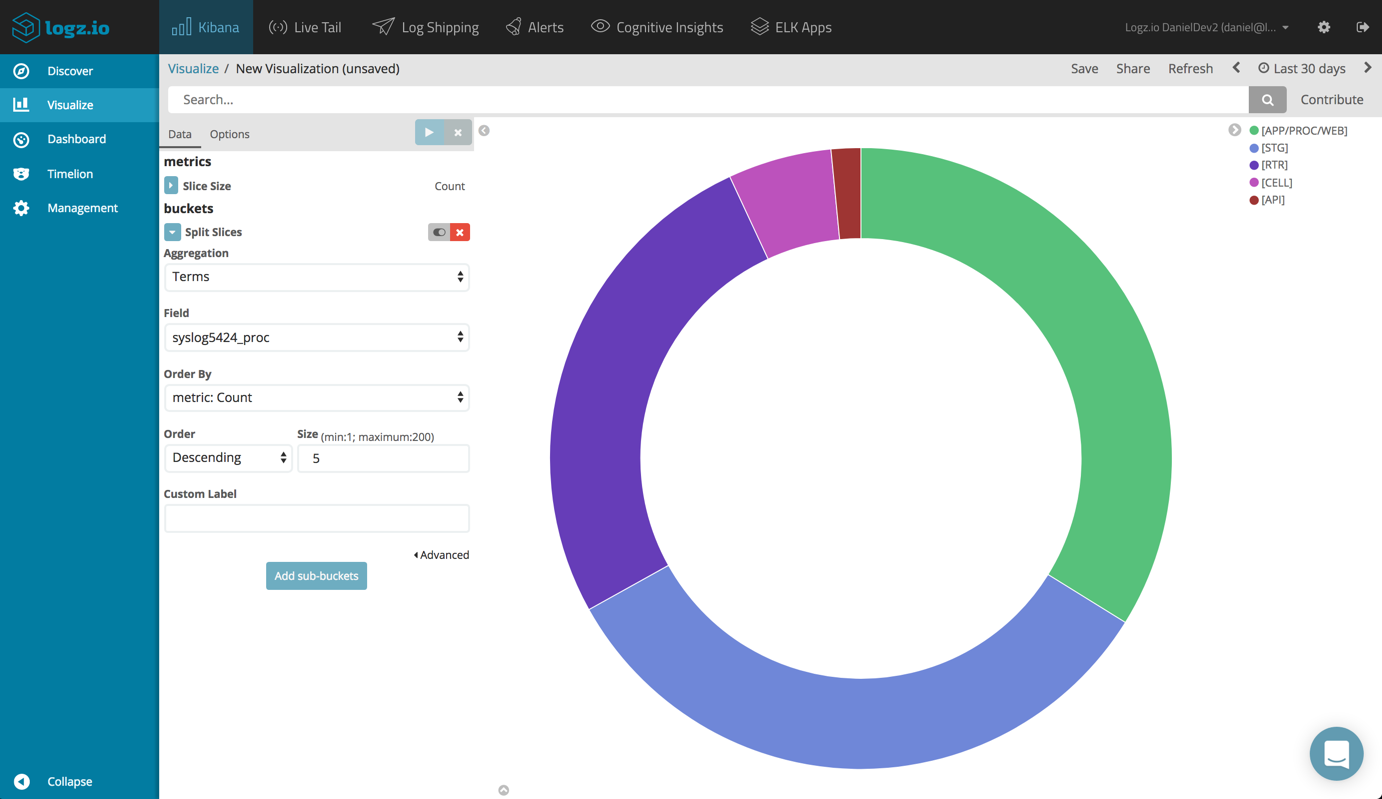
Log types
Cloud Foundry attaches a log type to each log message depending on its origin. For example, HTTP requests going through the router will get the RTR log type. Application logs will be assigned the APP log type. You can read more about these types here.
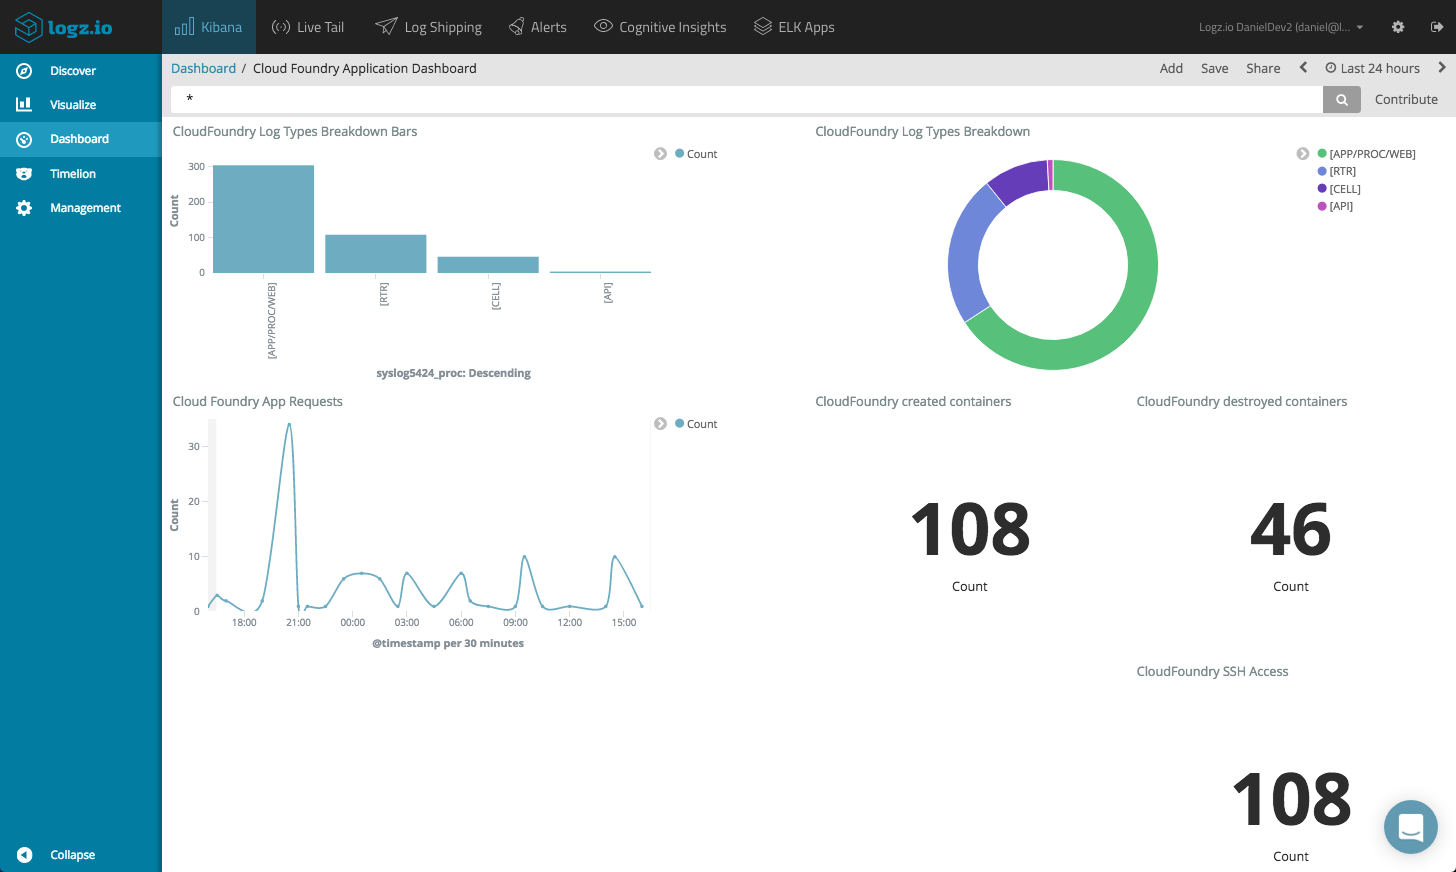
A basic pie chart visualization using the syslog5424_proc field will give you a nice breakdown of the different logs.
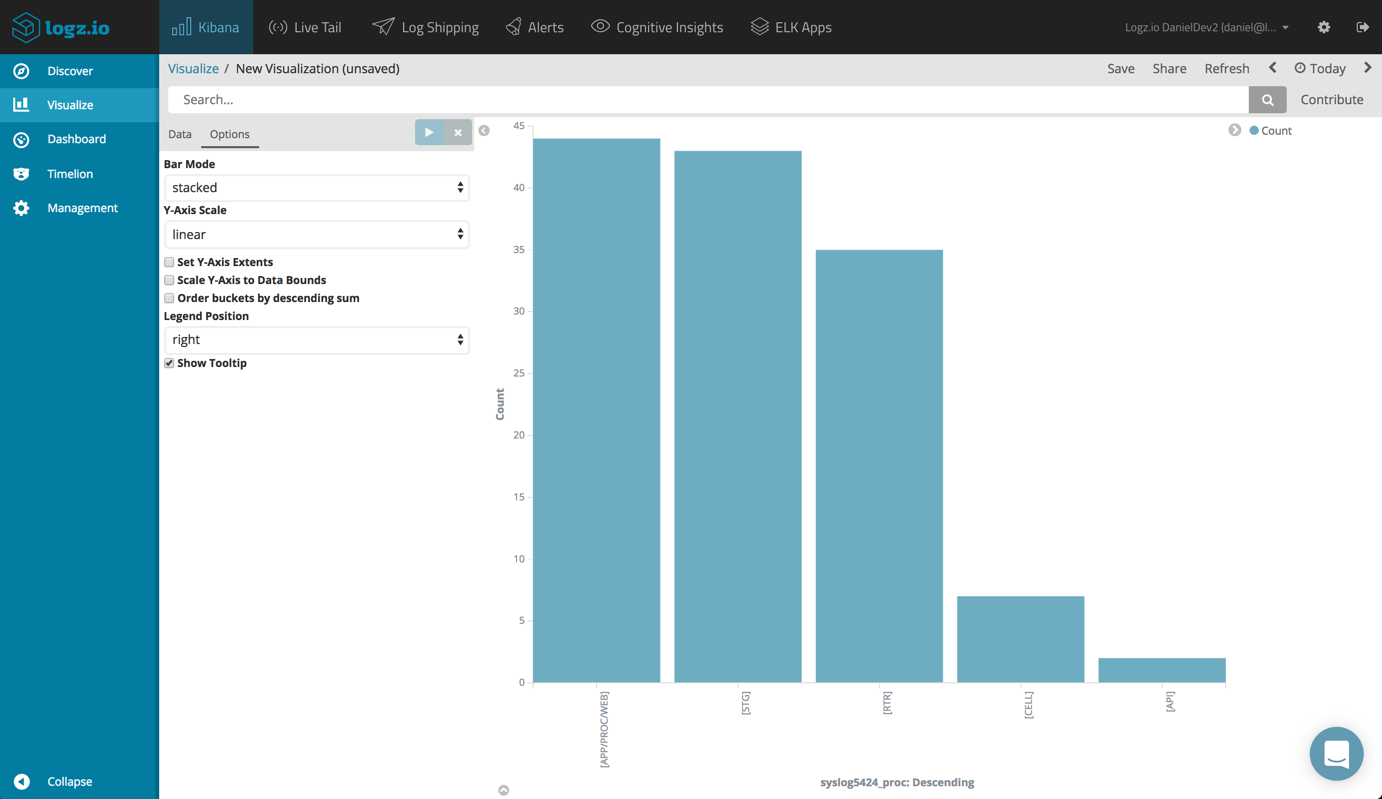
You can build a bar chart visualization depicting the same:
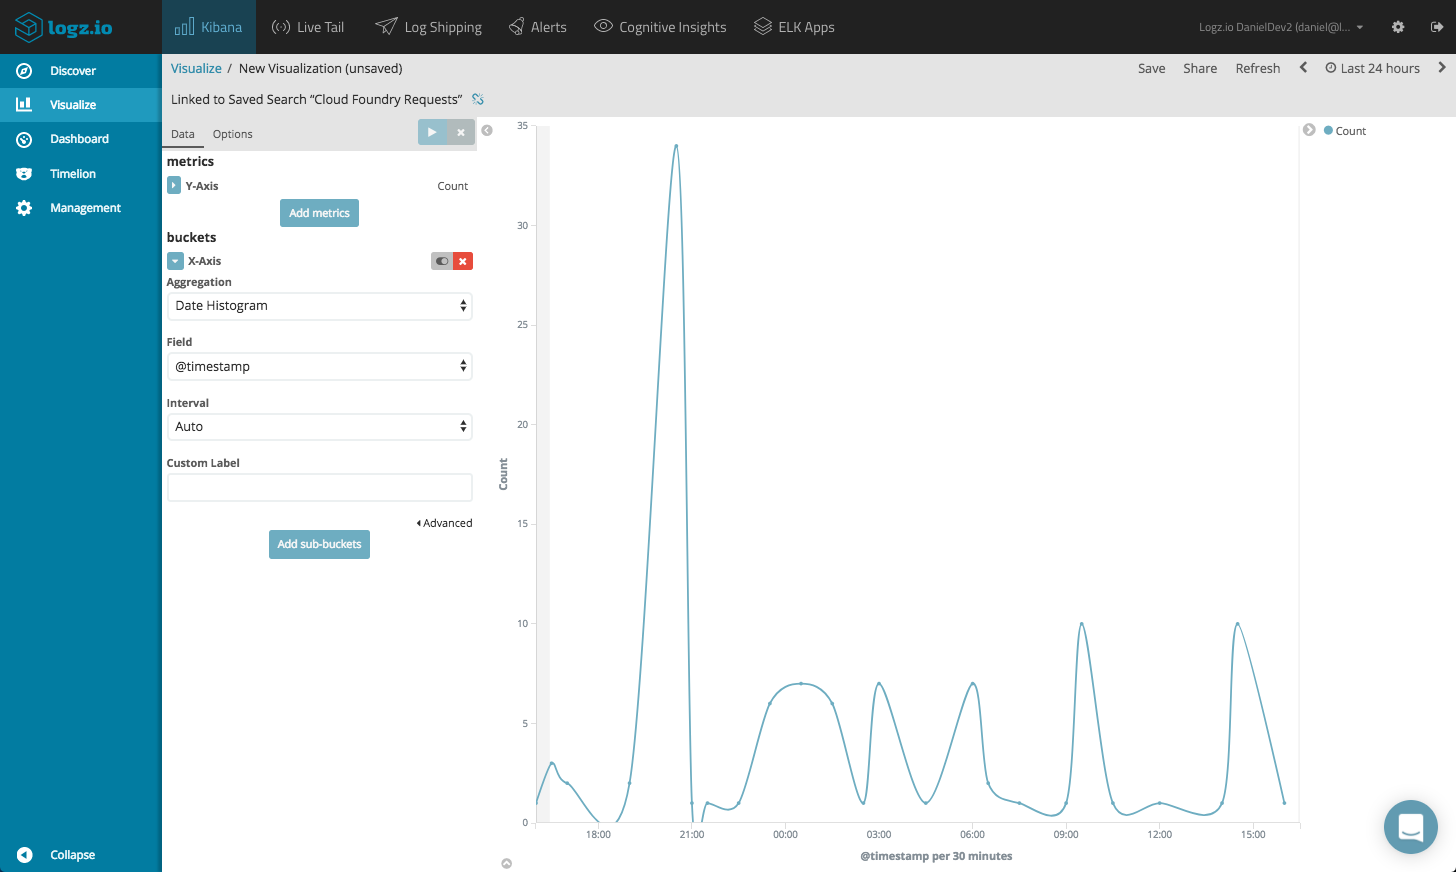
Application Requests
As mentioned above, the Cloud Foundry router generates RTR logs when it routes HTTP requests to the app.
Using a line chart visualization, you can identify spikes in traffic. You will need to use the Discover tab to drill down into RTR logs, and then create the visualization based on the saved search. Use a count aggregation as the Y-Axis and a Date Histogram for the X-Axis.
Application Actions
Cloud Foundry’s container management system is called Diego, and it generates what is called CELL logs each time an application is started or stopped by you. Diego also generates log messages when an app crashes.
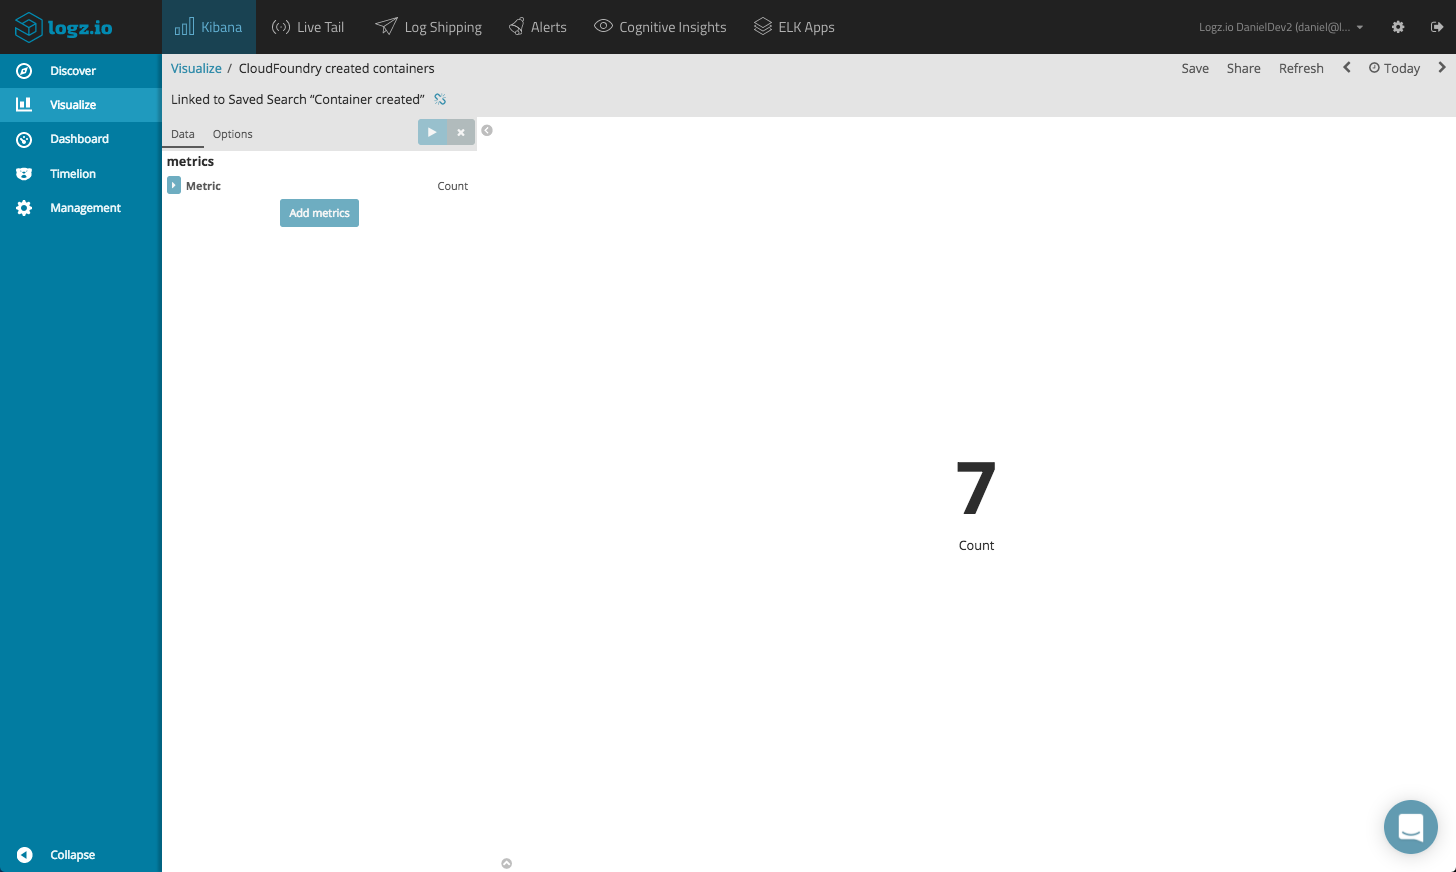
You can monitor these occurrences in a number of ways using Kibana visualizations. A basic metric visualization can indicate for example, how many times containers were started and stopped.
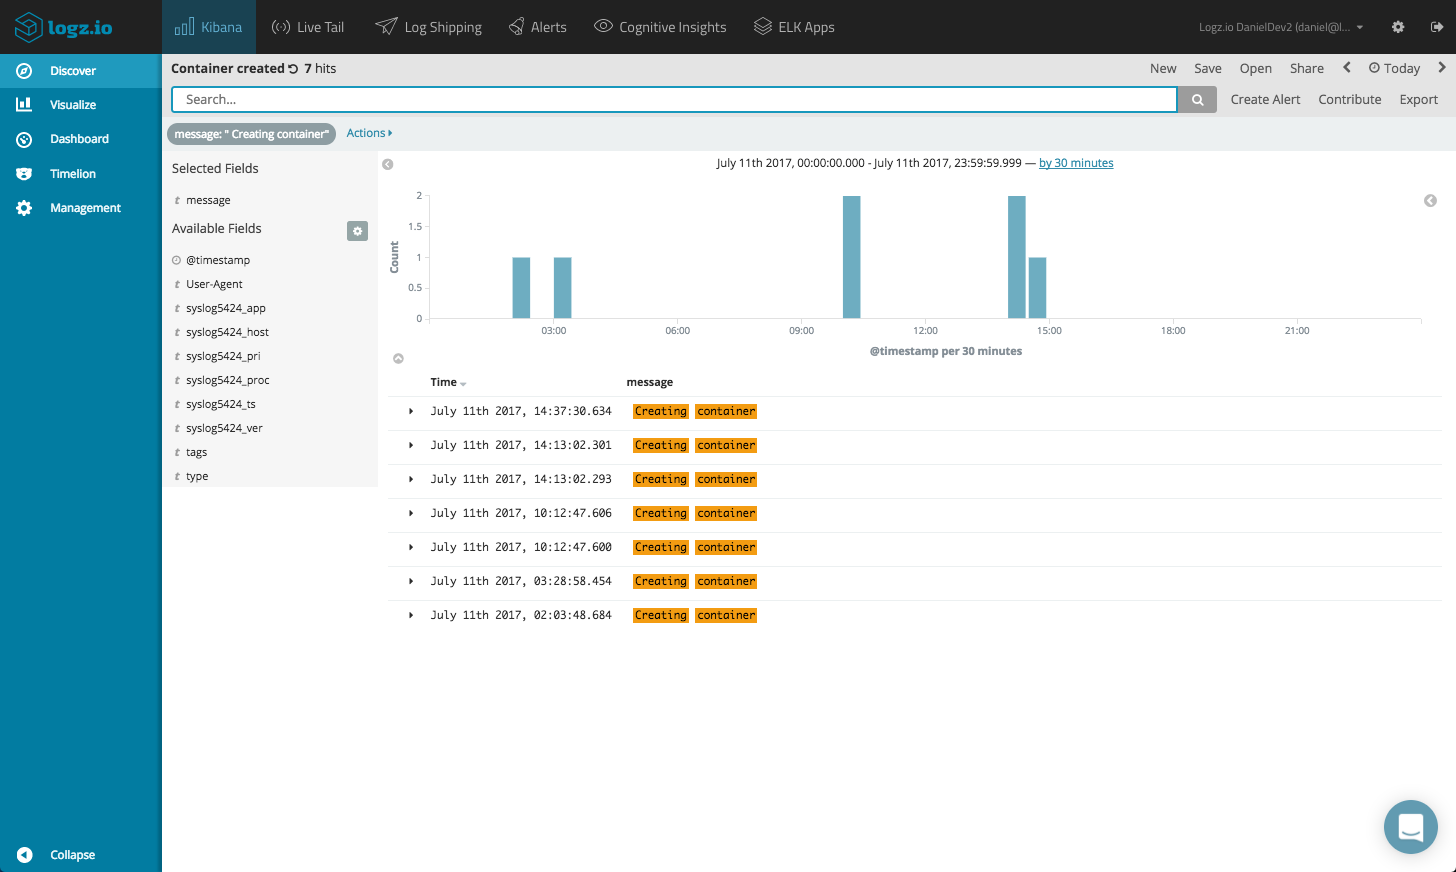
Drill down into these specific logs in the Discover tab in Kibana and save the search. Based on this search, create a simple metric visualization using the count aggregation.
Endnotes
Again, how you visualize your Cloud Foundry application depends on your specific application. The visualizations above are just a basic example showing the capabilities of adding ELK as a centralized logging layer on top of Cloud Foundry.
More on the subject:
For development and small-sized applications, using the supplied logging services in Cloud Foundry might suffice despite the fact that deeper analysis and visualization are not part of the package. For larger environments though, you need to think in terms of a centralized logging solution.
Using ELK, you will be able to easily store all the logs being generated and aggregated by Cloud Foundry and create a monitoring dashboard for your application. The only tricky part is the parsing step, which may require some fine-tuning in Logstash.

You Might Also Like

Modern Observability 101

