
AWS Log Analysis with the ELK Stack
April 13, 2016

Amazon Web Services log data is an extremely valuable resource that can be used to gain insight into the various services that comprise your environment.
The problem is that AWS-based architectures often use multiple components, each of which can potentially produce a huge amount of log files per second (depending on the environment that you have set up).
Not only that, the monitoring services provided by AWS do not offer a complete logging solution. Making correlations between the various layers of your application is crucial in troubleshooting problems in real-time but the functionalities of CloudTrail and CloudWatch in this context are extremely limited. These services cannot be used to analyze application logs and are missing other features such as querying and visualization capabilities.
More on the subject:
This article describes a different approach — defining S3 as the endpoint for all AWS logs and ingesting them into our Logz.io cloud-based ELK Stack (Elasticsearch, Logstash, Kibana), which is the world’s most popular open source log analysis platform. We chose Logz.io for reasons of simplicity, but you can use your own open source ELK Stack in the exact same way.
Prerequisites
To follow the steps, you will need AWS and Logz.io accounts and a basic knowledge of AWS architecture.
Important! Please note that this article assumes you have full permissions and access to your S3 buckets. If not, you will need to configure permissions to allow S3 integration with Logz.io.
Writing Logs to S3
Your first step is to make sure that your AWS instances are writing their access logs to S3. This can be to a separate bucket or a directory within a bucket. These log files will then be pulled into Logz.io for analysis and visualization.
In most cases, logging for your instances is disabled by default. To enable logs, you will need to access the management console for the service and manually enable logs. You will then be required to set the interval for shipping logs to S3 from the instance and the name of the S3 bucket. You can also use the AWS CLI to do the same.
In any case, I recommend referring to the AWS documentation for specific instructions, as they may vary based on the type of instance and service.
Analyzing S3 Bucket Logs
Once you’ve made sure that instance logs are being written to S3 buckets, the process for shipping these logs to Logz.io for analysis is simple.
First, access the Logz.io interface and open the Log Shipping tab.
Then, go to the AWS -> S3 Bucket section, and enter the details of the S3 bucket from which you would like to ingest log files:

Enter the following information:
- S3 bucket – the name of the S3 bucket.
- Prefix – the directory within the bucket that contains the log files. This field is optional and you can leave it empty if you are pulling from the root directory of the bucket.
- S3 access key – your S3 access key ID.
- S3 secret key – the S3 secret access key.
Be sure to select the log type (such as “ELB”) — this makes sure that the log files are parsed and enriched as they are ingested into Logz.io.
Click Save to save your bucket configurations. Log files will be shipped into Logz.io and displayed in the Kibana user interface within a minute or two.
If you are using your own open source, ELK Stack, you will need to add relevant input and output configurations to your Logstash instance.
Here’s an example of what that configuration would look like for ELB logs:
input {
s3 {
bucket => "elb-logs"
credentials => [ "my-aws-key", "my-aws-token" ]
region_endpoint => "us-east-1"
# keep track of the last processed file
sincedb_path => "./last-s3-file"
codec => "json"
type => "elb"
}
}

filter {
if [type] == "elb" {
grok {
match => [ "message", "%{TIMESTAMP_ISO8601:timestamp} %{NOTSPACE:loadbalancer} %{IP:client_ip}:%{NUMBER:client_port:int} (?:%{IP:backend_ip}:%{NUMBER:backend_port:int}|-) %{NUMBER:request_processing_time:float} %{NUMBER:backend_processing_time:float} %{NUMBER:response_processing_time:float} (?:%{NUMBER:elb_status_code:int}|-) (?:%{NUMBER:backend_status_code:int}|-) %{NUMBER:received_bytes:int} %{NUMBER:sent_bytes:int} "(?:%{WORD:verb}|-) (?:%{GREEDYDATA:request}|-) (?:HTTP/%{NUMBER:httpversion}|-( )?)" "%{DATA:userAgent}"( %{NOTSPACE:ssl_cipher} %{NOTSPACE:ssl_protocol})?" ]
}
grok {
match => [ "request", "%{URIPROTO:http_protocol}" ]
}
geoip {
source => "client_ip"
target => "geoip"
add_tag => [ "geoip" ]
}
useragent {
source => "userAgent"
}
date {
match => ["timestamp", "ISO8601"]
}
}

output {
elasticsearch_http {
host => "localhost"
port => "9200"
}
}
Analyzing S3 Access Logs
S3 buckets produce logs themselves each time they are accessed, and the log data contains information on the requester, bucket name, request time, request action, response status, and error code (should an error occur).
Analyzing these logs is used to help to understand who is using the buckets and how. Access log data can also be useful for security and access audits, and they play a key role in securing your AWS environment.
So, how do you ship these access logs to the Logz.io ELK Stack?
Your first step is to enable access logs for a specific bucket. To do this, select your S3 bucket in the S3 Console and then open the Logging section in the Properties pane:
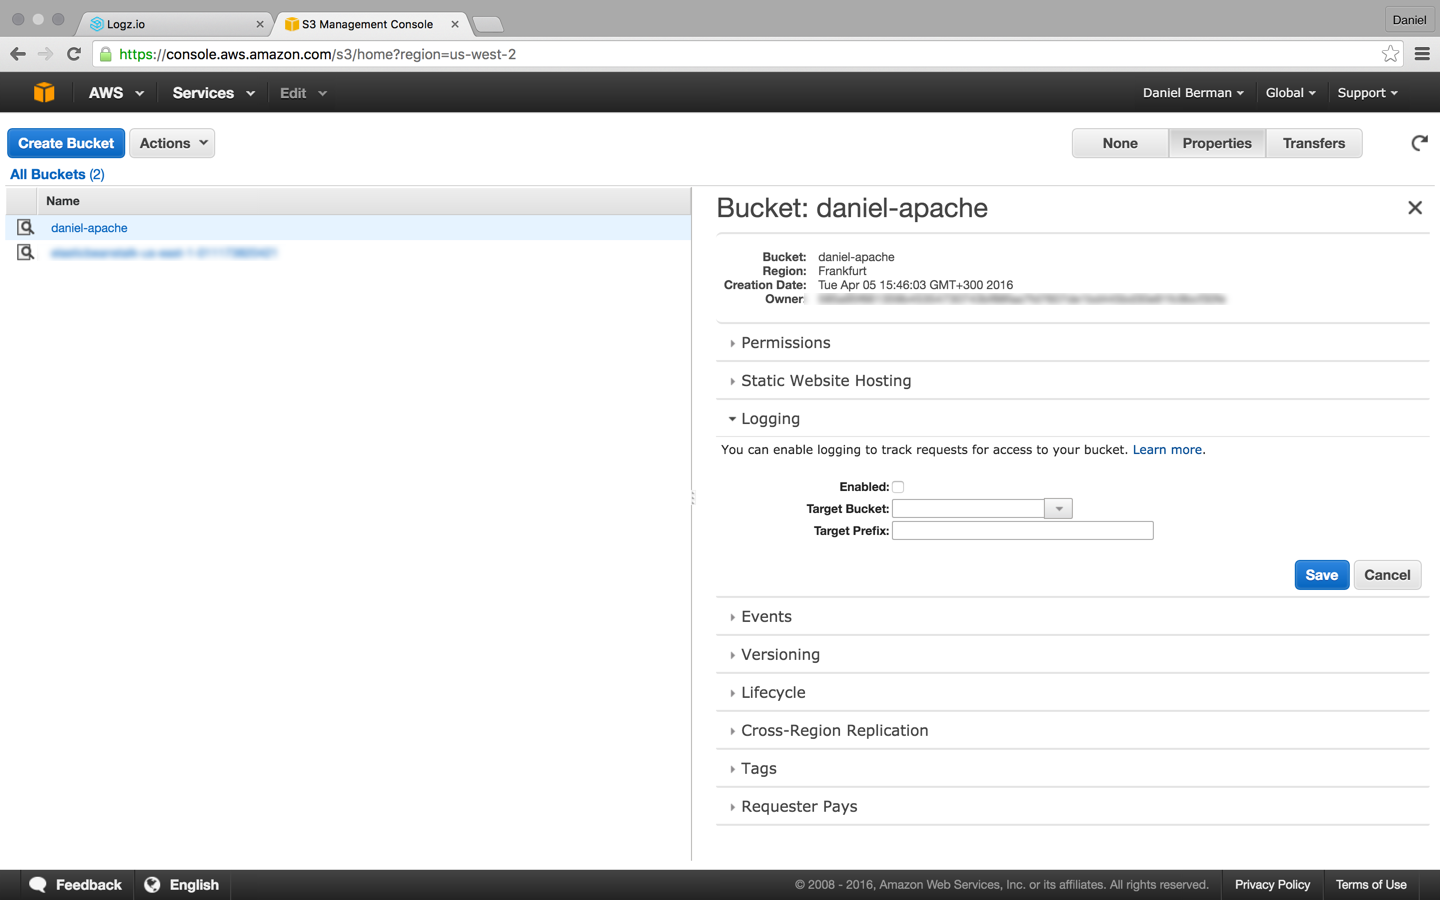
Enable logging, and select the name of the target bucket in which you want Amazon S3 to save the access logs as objects. You can have logs delivered to any bucket that you own, including the source bucket. AWS recommends that you save access logs in a different bucket so that you can easily manage the logs.
Once saved, S3 access logs are written to the S3 bucket that you had chosen. Your next step is to point Logz.io to the relevant S3 Bucket.
In the Log Shipping tab in Logz.io, open the AWS -> S3 Access configurations:

Add the details of the S3 bucket that you selected as the target bucket as well as your S3 secret and access keys.
Once saved, your S3 access data will begin to appear in Kibana.
Again, if you’re using your own open source, ELK Stack, you’ll need to add the correct configuration to your Logstash instance (the same configuration, as shown above, would apply in this case).
Installing and Using AWS ELK Apps
Once your logs have arrived, you can begin to use Kibana to query Elasticsearch. Querying Elasticsearch is an art in itself, and this tutorial on Elasticsearch queries does a good job at describing the main query types and options.
You can then create visualizations to visualize the data you’re interested in.
To hit the ground running, you can install an AWS-specific ELK App. ELK Apps is our free library of pre-made searches, visualizations, and dashboards tailored to specific log types. There are countless ELK Apps for AWS services including for S3, CloudTrail, and VPC Flow.
To install an ELK App, open the ELK Apps tab in Logz.io, and use the search box in the top-right corner of the page (more information about the library is here:

Click Install for any one of the available apps and then Open to have it displayed in Kibana. You can, of course, customize the app to suit your individual environment and personal preferences.

You Might Also Like

DevOps and SRE Metrics: R.E.D., U.S.E., and the “Four Golden Signals”

