A Filebeat Tutorial: Getting Started
April 12, 2018

This Filebeat tutorial seeks to give those getting started with it the tools and knowledge they need to install, configure and run it to ship data into the other components in the ELK stack. We’ll also take a look at Logz.io’s Filebeat configuration Wizard, which simplifies implementation.
What is Filebeat?
Filebeat is a log shipper belonging to the Beats family — a group of lightweight shippers installed on hosts for shipping different kinds of data into the ELK Stack for analysis. Each beat is dedicated to shipping different types of information — Winlogbeat, for example, ships Windows event logs, Metricbeat ships host metrics, and so forth. Filebeat, as the name implies, ships log files.
In an ELK-based logging pipeline, Filebeat plays the role of the logging agent—installed on the machine generating the log files, tailing them, and forwarding the data to either Logstash for more advanced processing or directly into Elasticsearch for indexing. Filebeat was originally most often used in tandem with Logstash – however recent developments have improved Filebeat’s log processing capabilities, making it an appropriate replacement for Logstash in some cases.
Written in Go and based on the Lumberjack protocol, Filebeat was designed to have a low memory footprint, handle large bulks of data, support encryption, and deal efficiently with back pressure. For example, Filebeat records the last successful line indexed in the registry, so in case of network issues or interruptions in transmissions, Filebeat will remember where it left off when re-establishing a connection. If there is an ingestion issue with the output, Logstash or Elasticsearch, Filebeat will slow down the reading of files.
Filebeat’s complicated history with open source
Filebeat grew into one of most (if not the most) popular log shipping agents in the world as an open source component that shipped log data to the ELK Stack. Sadly, in early 2021, the ELK Stack was closed sourced by the company who maintains the project, Elastic. Furthermore, Elastic introduced breaking changes to Filebeat, which would prevent compatibility with databases that weren’t Elasticsearch.
This defeats a key reason why engineers bother with open source telemetry data collection in the first place: to enable the freedom to easily migrate from one observability back-end to the other without having to rip and replace the data collection.
Since Filebeat is no longer vendor-neutral, many engineers are looking to open source alternatives like Fluentd or FluentBit for log collection, which would enable them to easily pivot across observability back ends with minimal reconfiguration.
Installing Filebeat
You can download and install Filebeat using various methods and on a variety of platforms. It only requires that you have a running ELK Stack to be able to ship the data that Filebeat collects. I will outline two methods, using Apt and Docker, but you can refer to the official docs for more options.
You can also use Beats versions earlier than 7.13 to send log data to managed services like Logz.io, which provides log management-as-a-service (based on OpenSearch and OpenSearch Dashboards), so you don’t have to manage the data infrastructure yourself. However, we recommend Fluentd or FluentBit so that your data collection can remain vendor neutral.
Install Filebeat using Apt
For an easier way of updating to a newer version, and depending on your Linux distro, you can use Apt or Yum to install Filebeat from Elastic’s repositories:
First, you need to add Elastic’s signing key so that the downloaded package can be verified (skip this step if you’ve already installed packages from Elastic):
wget -qO - https://artifacts.elastic.co/GPG-KEY-elasticsearch | sudo apt-key add -
The next step is to add the repository definition to your system:
echo "deb https://artifacts.elastic.co/packages/7.x/apt stable main" | sudo
tee -a /etc/apt/sources.list.d/elastic-7.x.list
All that’s left to do is to update your repositories and install Filebeat:
sudo apt-get update && sudo apt-get install filebeat
Install Filebeat on Docker
If you’re running Docker, you can install Filebeat as a container on your host and configure it to collect container logs or log files from your host.
Pull Elastic’s Filebeat image with:
docker pull docker.elastic.co/beats/filebeat7.4.2
Configuring Filebeat
Filebeat is pretty easy to configure, and the good news is that if you’ve configured one beat, you can be pretty sure you’ll know how to configure the next — they all follow the same configuration setup.
Configure Filebeat using a YAML configuration file.
On Linux, this file is at: /etc/filebeat/filebeat.yml.
Alternatively, on Docker, you will find it at: /usr/share/filebeat/filebeat.yml.
On Mac (installation with Homebrew), you’ll find it at
/usr/local/etc/filebeat/filebeat.yml
OR
/usr/local/cellar/filebeat-full/filebeat.yml.
YAML is syntax sensitive. You cannot, for example, use tabs for spacing. There are a number of additional best practices that will help you avoid mistakes in this Musing in YAML article.
Filebeat contains rich configuration options. In most cases, you can make do with using default or very basic configurations. It’s a good best practice to refer to the example filebeat.reference.yml configuration file (in the same location as the filebeat.yml file) that contains all the different available options.
Let’s take a look at some of the main components that you will most likely use when configuring Filebeat.
Filebeat inputs
The main configuration unit in Filebeat are the inputs. They are responsible for locating specific files and applying basic processing to them. In past versions of Filebeat, inputs were referred to as “prospectors.”
The main configuration you need to apply to inputs is the path (or paths) to the file you want to track. But you can use additional configuration options such as defining the input type and the encoding to use for reading the file; excluding and including specific lines; or adding custom fields.
You can configure an input to track multiple files or define multiple inputs in case you have input-specific configurations you want to apply.
filebeat.inputs:
- type: log #Change value to true to activate the input configuration
  enabled: false
  paths:
    - “/var/log/apache2/*”
    - “/var/log/nginx/*”
    - “/var/log/mysql/*”
- type: docker
  containers.ids:
    - 'b0b9ee32374f83545454166e7d7f9458672c779624201bb063680b6bea8723c7'
You can edit paths to include other inputs (defined by -) for crawling and fetching. The input here for Apache creates a directory called apache2. The next nginx, then mysql, and so on.
Filebeat processors
While not as powerful and robust as Logstash, Filebeat can apply basic processing and data enhancements to log data before forwarding it to the destination of your choice. You can decode JSON strings, drop specific fields, add various metadata (e.g. Docker, Kubernetes), and more.
You’ll need to define processors in the Filebeat configuration file per input. You can define rules to apply your processing using conditional statements. Below is an example using the drop_fields processor for dropping some fields from Apache access logs:
filebeat.inputs:
- type: log
  paths:
    - "/var/log/apache2/access.log"
  fields:
    apache: true
  processors:
  - drop_fields:
      fields: ["verb","id"]
Filebeat output
This section in the Filebeat configuration file defines where you want to ship the data to. There are a wide range of supported output options, including console, file, cloud, Redis, Kafka but in most cases, you will be using the Logstash or Elasticsearch output types.
Define a Logstash instance for more advanced processing and data enhancement. When your data is well-structured JSON documents, for example, you might make do with defining your Elasticsearch cluster.
You can define multiple outputs and use a load balancing option to balance the forwarding of data.
Output of logs within the ELK Stack
For forwarding logs to Elasticsearch:
output.elasticsearch:
  hosts: ["localhost:9200"]
In order to forward logs to Logstash:
output.logstash:
  hosts: ["localhost:5044"]
For forwarding logs to two Logstash instances:
output.logstash:
  hosts: ["localhost:5044", "localhost:5045"]
  loadbalance: true
Output of Logs to Log Aggregators/Message Queues
For forwarding logs to Kafka:
output.kafka:
  hosts: ["localhost:9092"]
  topic: "topicname"
  topics:
    - topic: "error"
      when.contains:
        message: "ERR"
    - topic: "access"
      when contains:
        message: "\"GET .*\" 200" #Apache access logs use a GET request in combination with some HTTP data and a 200 code afterward. Backslashes in YAML indicate the following character should be read as text, not syntax
For forwarding metrics to Redis:
output.redis:
  hosts: ["localhost:6379"]
  index: "redis.index.for.logstash"
  key: "filebeat.to.redis" #If you don't designate a specific key, this will default to the specified index
  keys:
    - key: "error"
      when.contains:
        message: "ERR"
    - key: "access"
      when.contains:
        message: "\"GET .*\" 200"
Logz.io Filebeat Wizard
Logz.io provides a SaaS platform that unifies and enhances leading open source monitoring tools – including OpenSearch for logs, Prometheus for metrics, and OpenTelemetry for traces – on a single SaaS platform, which eliminates the need to manage, upgrade, troubleshoot, or secure open source observability components yourself.
Logz.io provides a Filebeat Wizard that results in an automatically formatted YAML file. This allows users to easily define their Filebeat configuration file and avoid common syntax errors. The wizard can be accessed via the Log Shipping → Filebeat page.
In the wizard, users enter the path to the log file they want to ship and the log type. There are additional options that can be used, such as entering a REGEX pattern for multiline logs and adding custom fields.
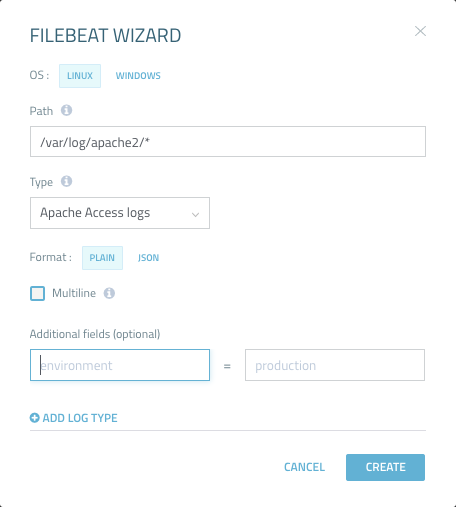
Non-Logz.io users can make use of the wizard as well, they simply need to remove the Logz.io specific fields from the generated YAML file.
Configuring Filebeat on Docker
The most commonly used method to configure Filebeat when running it as a Docker container is by bind-mounting a configuration file when running the container.
First, create a filebeat.yml file on your host.
Then, follow the guidelines above and enter your configurations. The example below provides basic configurations to ship Docker container logs running on the same host to a locally running instance of Elasticsearch.
filebeat.inputs:
- type: log
  paths:
  - '/var/lib/docker/containers/*/*.log'
  json.message_key: log
  json.keys_under_root: true
  processors:
  - add_docker_metadata: ~
output.elasticsearch:
  hosts: ["localhost:9200"]
Running Filebeat
Depending on how you installed Filebeat, enter the following commands to start Filebeat.
Apt
Start the Filebeat service with:
sudo service filebeat start
Docker
Run the Filebeat container by defining bind-mounting to your configuration file (you can, of course, do the same thing by building your own image from a Dockerfile and running it). Be sure you have the correct permissions to connect to the Docker daemon:
sudo docker run -v
/etc/filebeat/filebeat.yml:
/usr/share/filebeat/filebeat.yml docker.elastic.co/beats/filebeat:7.4.2
Filebeat Modules
Filebeat modules are ready-made configurations for common log types, such as Apache, nginx and MySQL logs. You can use them to simplify the process of configuring Filebeat, parsing the data and analyzing it in Kibana with ready-made dashboards. They contain standard filesets, such as access logs or error logs.
A list of the different configurations per module can be found in the /etc/filebeat/module.d (on Linux or Mac) folder. You need to enable modules as they are in disabled mode by default . There are various ways of enabling modules, one way being from your Filebeat configuration file:
filebeat.modules:
- module: apache
Filebeat modules are currently a bit difficult to use since they require using Elasticsearch Ingest Node and some specific modules have additional dependencies that need installation and configuration.
There are a number of other natively supported options in Filebeat (including but not limited to haproxy, auditd, MongoDB, mySQL, rabbitMQ, and Redis).
The full list of Filebeat modules includes: apache, nginx, mysql, auditd, aws, cef, cisco, coredns, elasticsearch, envoyproxy, googlecloud, haproxy, icinga, ibmmq, iptables, iis, kafka, kibana, logstash mongodb, mssql, nats, netflow, osquery, panw, postgresql, rabbitmq, redis, santa, suricata, traefik, and zeek.
What next?
Filebeat is an efficient, reliable and relatively easy-to-use log shipper, and complements the functionality with support in the other components in the stack. To make the best of Filebeat, be sure to read our other Elasticsearch, Logstash and Kibana tutorials.
Like any piece of software, there are some pitfalls worth knowing about before starting out. These are in our Filebeat Pitfalls article. Tips on configuring YAML configuration files can be found in the Musings in YAML article. You can read more about the story behind the development of Beats and Filebeat in this article.
Enjoy!

You Might Also Like

What’s New at Logz.io – January 2026

