
Azure Network Security Group (NSG) Flow Logs Analysis with the ELK Stack
November 8, 2017
Introduced back in March this year, the Network Watcher is a relatively new feature in Azure’s cloud offering. It allows users to monitor network traffic to and from Azure, and includes a bunch of analytics and visualization tools for better understanding and troubleshooting.
One of these features is Network Security Group Flow logs — a logging service that captures information about traffic for Network Security Groups (NSG), including the source/destination IP and port, the protocol used, whether the traffic was allowed or denied, and more.
The logs themselves can be shipped to an Azure storage account for further analysis in the ELK Stack using a Logstash input plugin. This article will explore this workflow — enabling NSG Flow logs and using Logstash to collect and process the logs before sending them for indexing in Elasticsearch. Instructions are included for integrating with Logz.io as well (just a matter of a few tweaks to the Logstash configuration).
Some basic requirements for following these steps — an Azure account with a storage blob and at least one network security group, an ELK stack up and running (I used version 5.6 for this article) or a Logz.io account.
Let’s get started!
Enabling Network Watcher and NSG Flow Logs
Your first step is to enable the Network Watcher for your Azure subscription. To do this, open the Azure portal, and then search for, and select, the Network Watcher service.
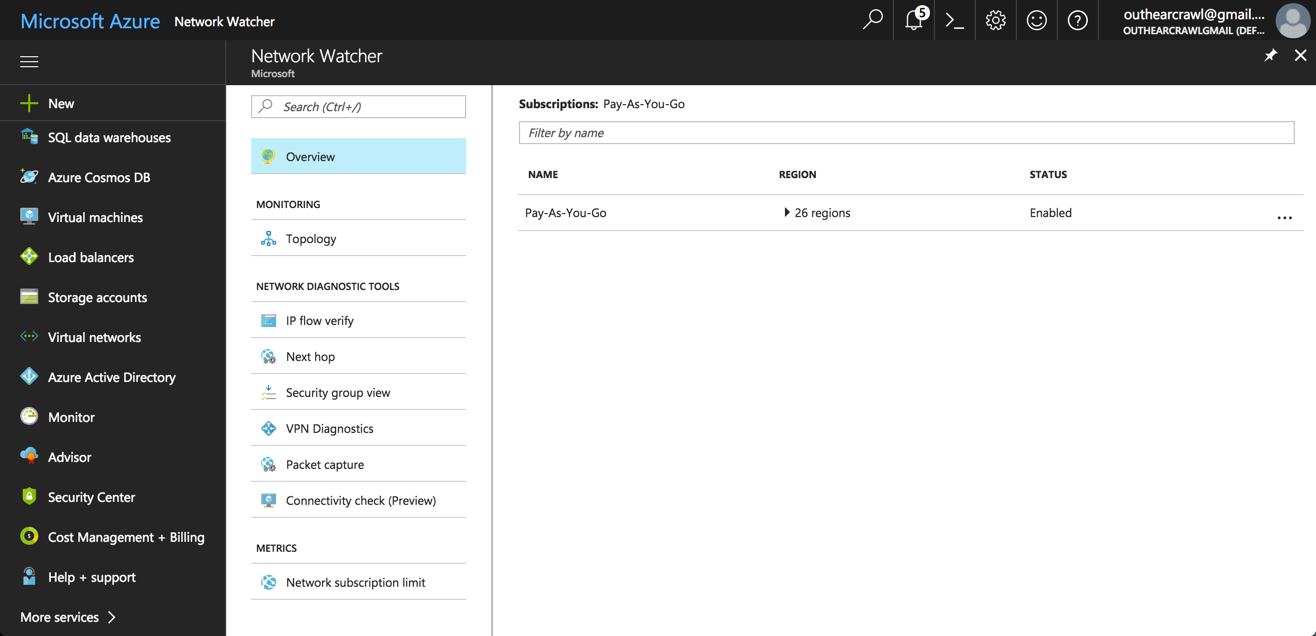
If not enabled already, right-click your subscription in the list and enable the service.
Next, in the Logs section in the Network Watcher pane, select NSG flow logs.
You will see a list of your Network Security Groups. Select a group from the list, and the Flow logs settings pane is displayed.
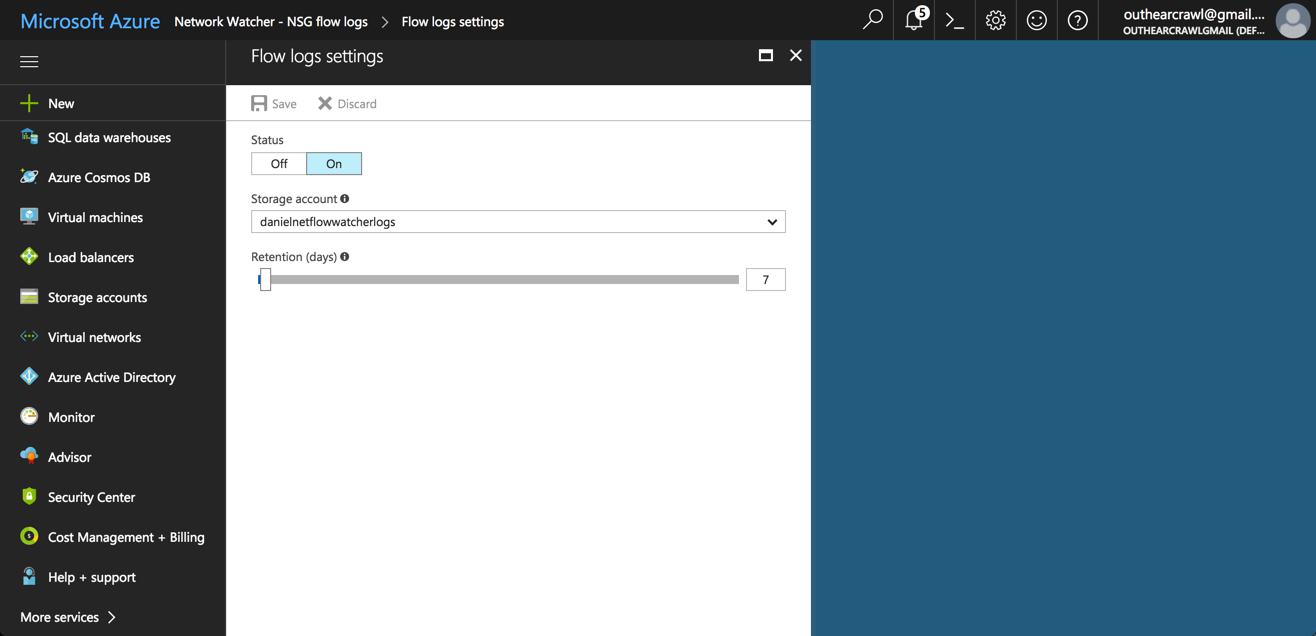
To turn on Flow logs, set the status to On and select the storage blob you want to sent the logs to. Of course, you can do this for any number of security groups.
Hit Save.
You will go back to the Network Watcher pane, and you will now see that the network security group shows the selected storage blob and Flow logs enabled.
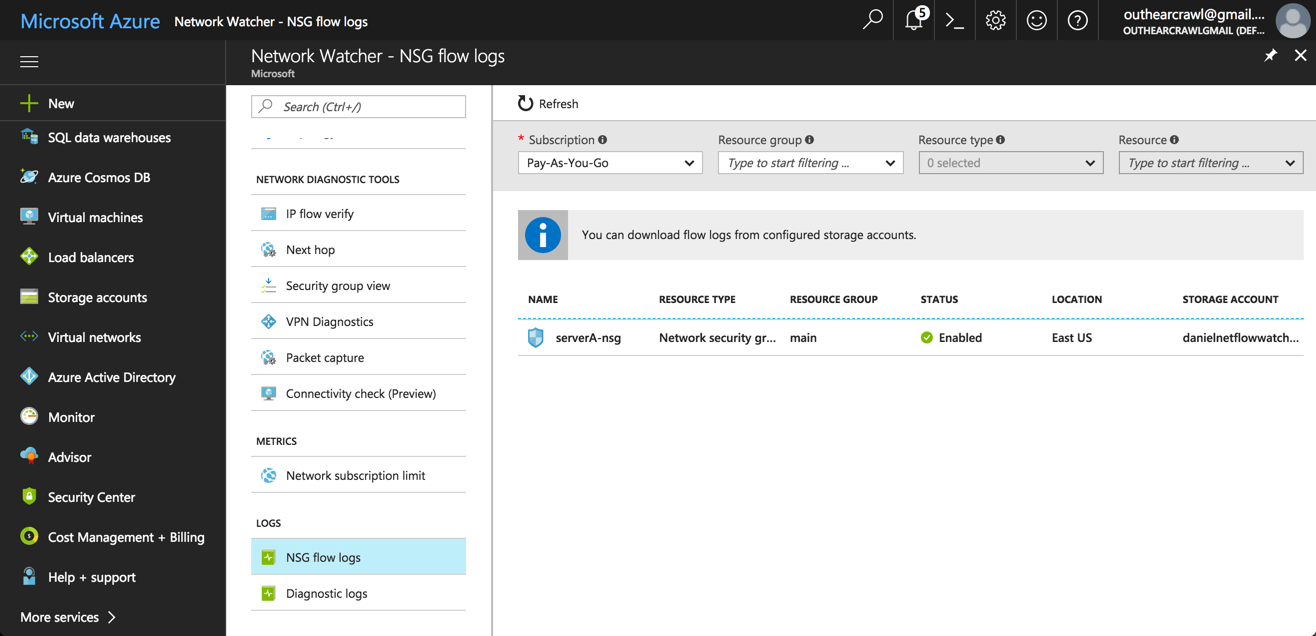
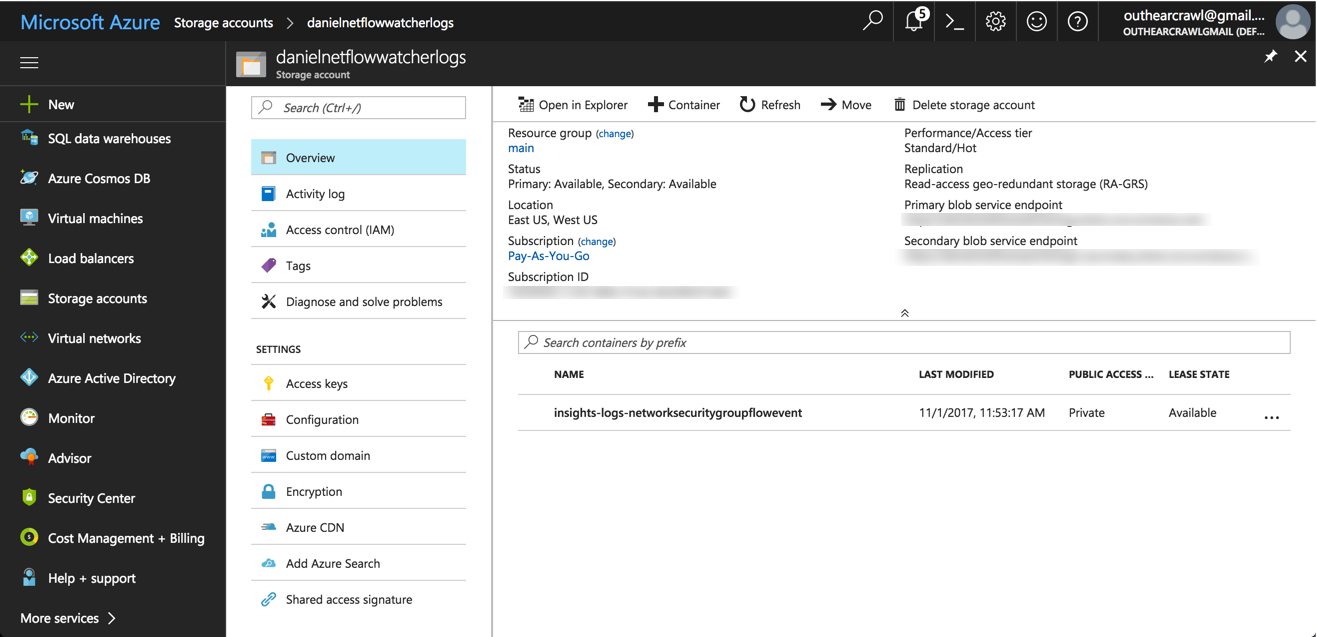
NSG flow logs will begin streaming into the blob storage account you selected, into a container named “insights-logs-networksecuritygroupflowevent”.
Installing the Azure Storage Blob Plugin for Logstash
Your next step is to begin the process of shipping the logs into the ELK Stack. To do this, we are going to use the Logstash plugin for Azure storage blob.
To install the plugin, all you have to do is enter the following command on the server hosting your Logstash installation:
sudo /usr/share/logstash/bin/logstash-plugin install logstash-input-
azureblob
The plugin is installed, but before we turn on the switch, we need to configure Logstash to collect the logs from our storage account on Azure, parse the logs into human-readable fields, and output them to our Elasticsearch instance.
Configuring Logstash
So first, let’s open up the Logstash configuration file:
sudo vim /etc/logstash/conf.d/logstash.conf
Next, paste the following configuration:
input {
azureblob
 {
     storage_account_name => "yourStorageAccount"
     storage_access_key => "yourStorageKey"
     container => "insights-logs-networksecuritygroupflowevent"
     codec => "json"
     file_head_bytes => 12
     file_tail_bytes => 2
 }
}


filter {
 split { field => "[records]" }
 split { field => "[records][properties][flows]"}
 split { field => "[records][properties][flows][flows]"}
 split { field => "[records][properties][flows][flows][flowTuples]"}


mutate {
split => { "[records][resourceId]" => "/"}
add_field => {"Subscription" => "%{[records][resourceId][2]}"
             "ResourceGroup" => "%{[records][resourceId][4]}"
             "NetworkSecurityGroup" => "%{[records][resourceId][8]}"}
convert => {"Subscription" => "string"}
convert => {"ResourceGroup" => "string"}
convert => {"NetworkSecurityGroup" => "string"}
split => { "[records][properties][flows][flows][flowTuples]" => ","}
add_field => {
           "unixtimestamp" => "%{[records][properties][flows][flows][flowTuples][0]}"
           "srcIp" => "%{[records][properties][flows][flows][flowTuples][1]}"
           "destIp" => "%{[records][properties][flows][flows][flowTuples][2]}"
           "srcPort" => "%{[records][properties][flows][flows][flowTuples][3]}"
           "destPort" => "%{[records][properties][flows][flows][flowTuples][4]}"
           "protocol" => "%{[records][properties][flows][flows][flowTuples][5]}"
           "trafficflow" => "%{[records][properties][flows][flows][flowTuples][6]}"
           "traffic" => "%{[records][properties][flows][flows][flowTuples][7]}"
            }
convert => {"unixtimestamp" => "integer"}
convert => {"srcPort" => "integer"}
convert => {"destPort" => "integer"}
}


date{
match => ["unixtimestamp" , "UNIX"]
}
}


output {
 elasticsearch {
   hosts => "localhost"
   index => "nsg-flow-logs"
 }
}
A few notes here — in the input section, you must enter the name of the storage account and the storage access key (Azure provides 2 keys by default. You can access these in the storage pane, in the Access keys section). The container name will be identical to the name used in the example above.
The output section, in this case, is defining a local Elasticsearch instance as the destination and defining the index name to be created. You can enter a different output if you like. In the next section, we will be changing this to send the data to Logz.io.
A good best practice when configuring Logstash pipelines is validating the configuration file. The specific command to use varies according to which version you use. For version 5.6, you can use:
sudo /usr/share/logstash/bin/logstash --config.test_and_exit -f
/etc/logstash/conf.d/logstash.conf
You’re almost there. To start Logstash, run:
sudo service logstash start
After a short while, you should be seeing a new index create in Elasticsearch called “nsg-flow-logs”. You can use the following API to make sure:
curl -XGET 'localhost:9200/_cat/indices?v&pretty'
health status index         uuid                   pri rep docs.count docs.deleted store.size pri.store.size
yellow open   nsg-flow-logs OX-l7yAxRFq7OyGmT1IdWw   5   1        582            0        2mb            2mb
yellow open   .kibana       tX_1ncioQ-OzNctNu83iaw   1   1          2            0     20.3kb         20.3kb
Open Kibana, enter ‘nsg-flow-logs*’ as a new index pattern, and you should begin seeing your Azure Network Security flow logs on the Discover page.

Shipping to Logz.io
By making a few small changes to the Logstash configuration file above, we can ship the data into the Logz.io ELK Stack.
First, make sure you have an outbound security rule that allows TCP traffic to port 5050. If you would like to send the data over SSL, this can be done as well (instructions for this can be found in the Logz.io UI, on the Logstash section in the Log Shipping page).
Next, in the Logstash configuration file, apply the following adjustments.
In the filter section, add a new mutate filter that adds your Logz.io token (your account token can be found in the Settings page):
mutate {
   add_field => { "token" => "yourToken" }
}
In the output section, replace with the Logz.io listener definitions:
tcp {
   host => "listener.logz.io"
   port => 5050
   codec => json_lines
}
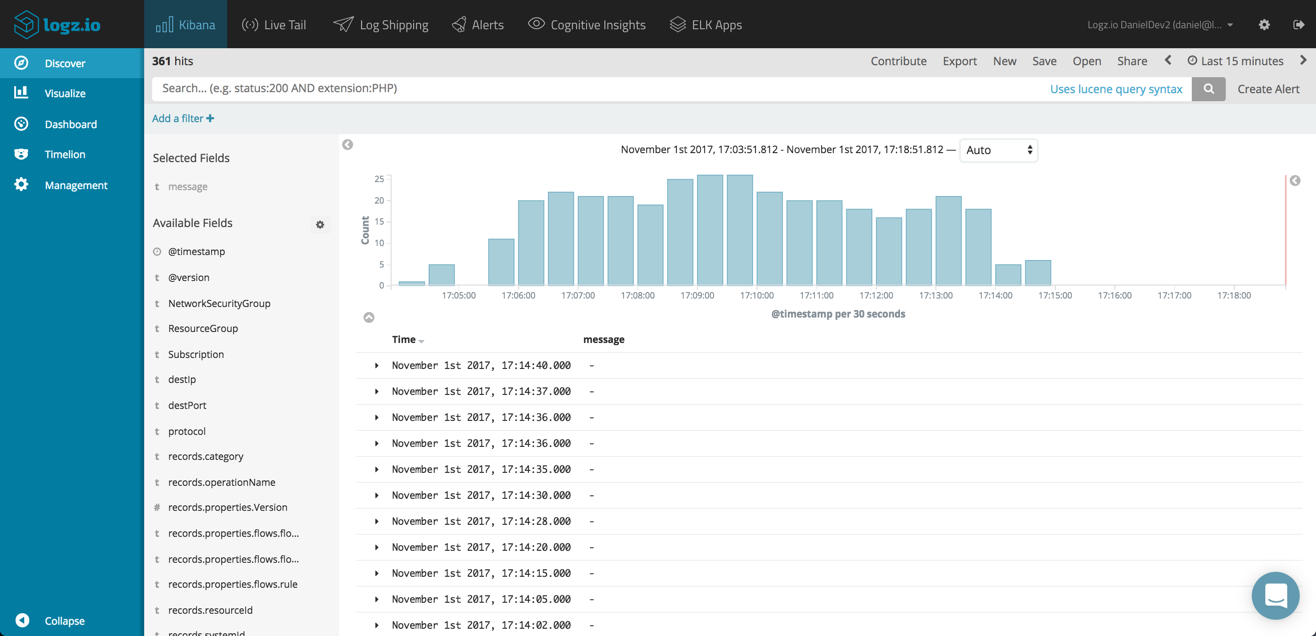
Restarting Logstash, you should be seeing the logs appearing in Logz.io:
Analyzing the Data
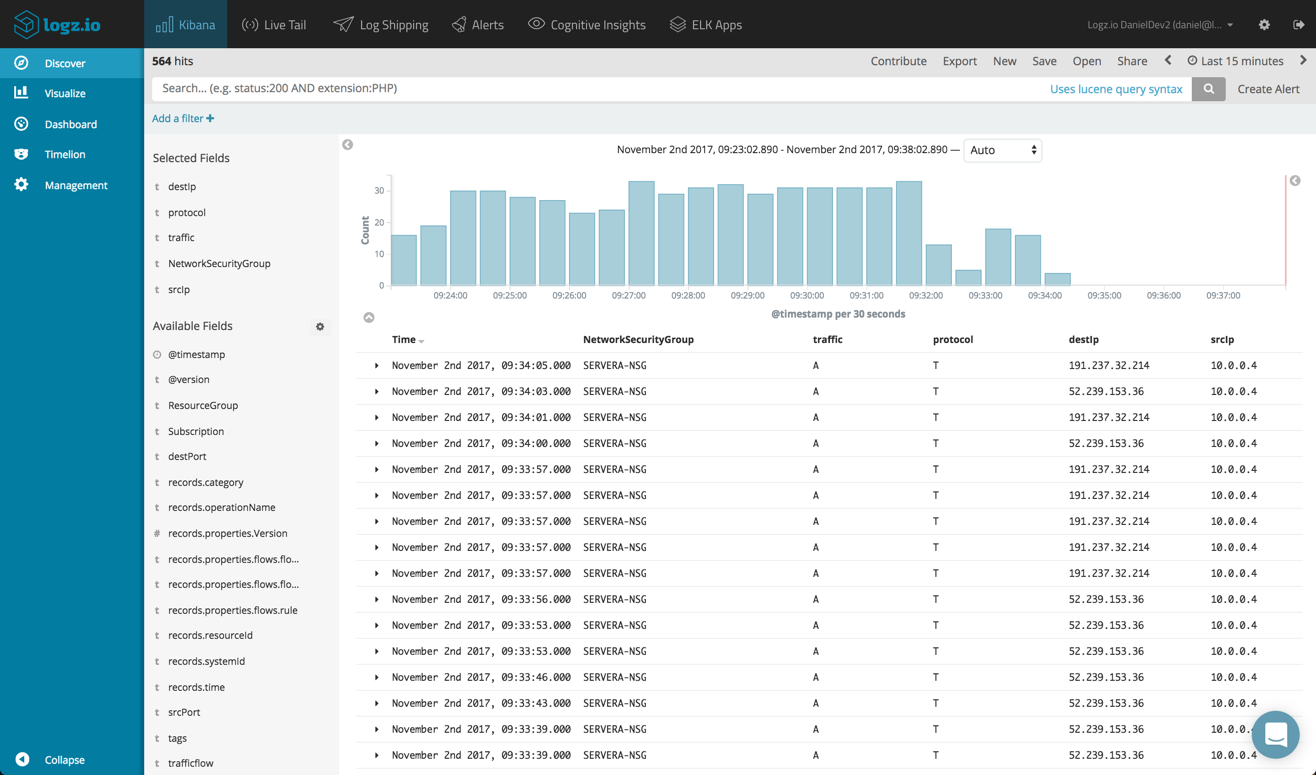
Once in Kibana, we can begin analyzing the data. In the Discover tab, you will see a list of available fields. These fields are the result of the parsing done by Logstash. To get some visibility into the logs, begin by adding some of these fields.
To understand what each of the fields means, check out the Azure docs here. In the example below, I’ve added the NetworkSecurityGroup, traffic, protocol, destIp and srcIp fields.
Querying in Kibana is an art in itself and requires some experimentation if you’re a newbie. I recommend reading on this topic before you begin.
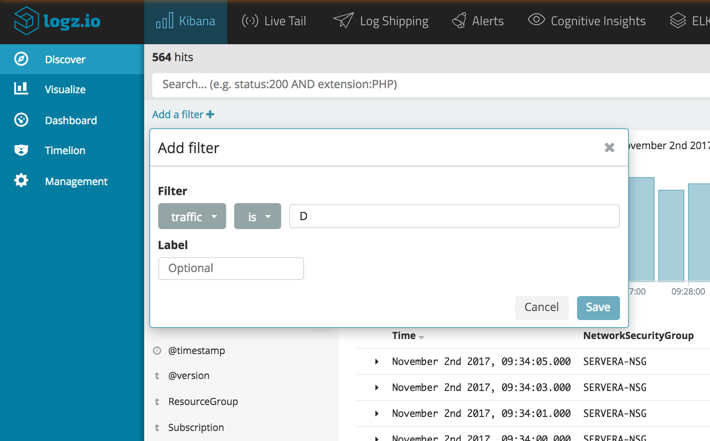
There is a new filtering option that you can use that helps narrow down your searches. Just click Add a filter under the querying field and configure the filter.
For example, say you’d like to see only denied traffic.
Next up — visualizations. Kibana is a great tool to use for visualizing log data–and in the context of Azure’s NSG Flow logs–there are a couple of obvious ways visualizations will help you monitor traffic.
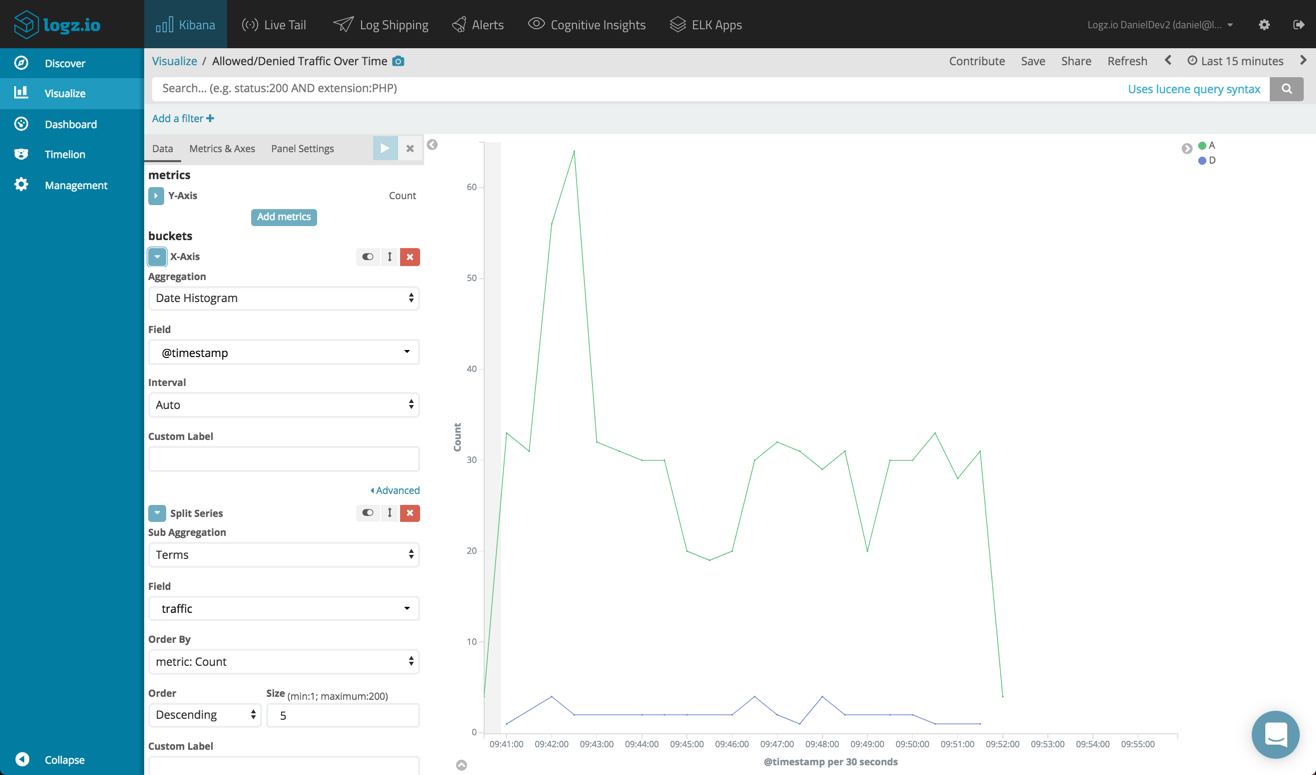
One example is building a line chart showing the amount of denied traffic vs. allowed traffic over time.
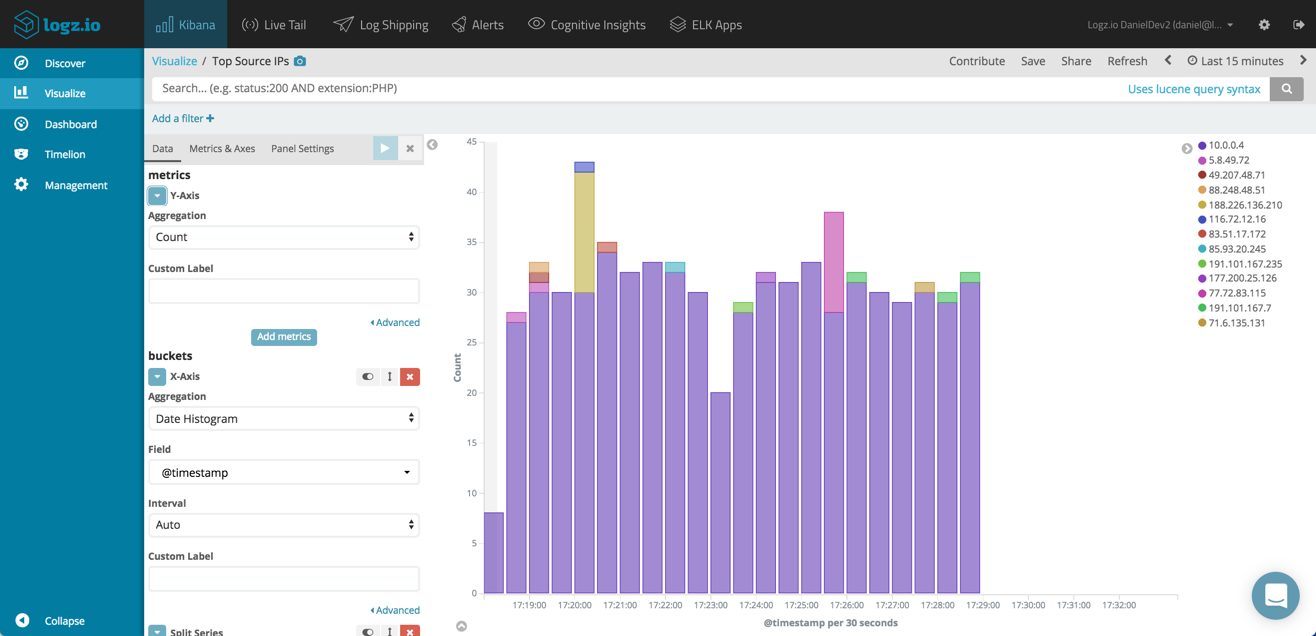
Another example is building bar charts showing the top source and destination IPs.
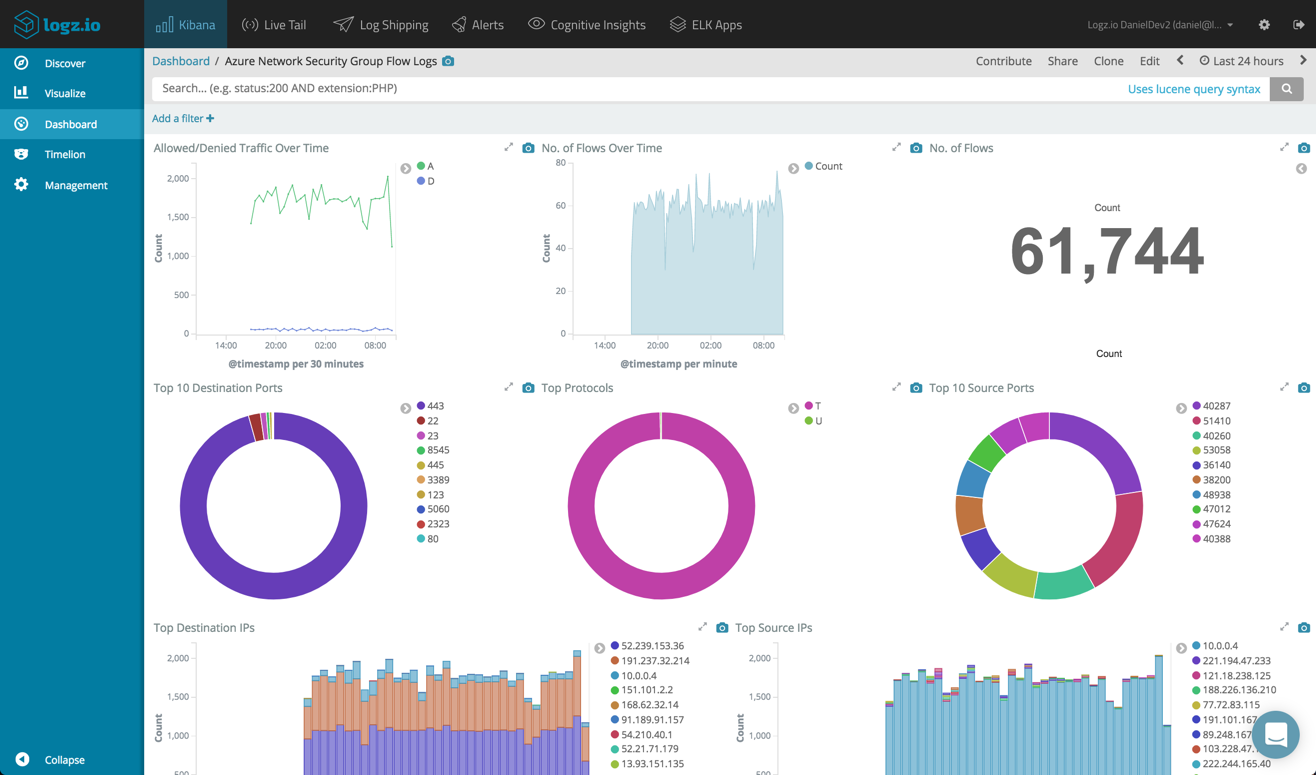
Summing it up
Adding all of these visualizations into one dashboard gives you a nice view of the traffic flowing through your Azure network security groups.
Ideally, and if you want to be more proactive, you should also set up alerts to get notified on anomalous traffic. For example, you would want to know if the logs are showing an abnormal amount of denied traffic. Logz.io provides an alerting engine as part of the service, but if you are using the open source ELK you will need to configure or pay for an add-on.
More on the subject:
Being able to export the data and integrate with the ELK Stack is a huge benefit of the Azure Network Watcher. Once indexed in Elasticsearch, Kibana will allow you to dive deeper into the data to identify trends, anomalies and suspicious behavior.

You Might Also Like

Finding the Bug in the Haystack with Machine Learning: Logz.io Exceptions in Kibana

