
The Complete Guide to Azure Monitoring
June 18, 2019

Monitoring an Azure environment can be a challenging task for even the most experienced and skilled team. Applications deployed on Azure are built on top of an architecture that is distributed and extremely dynamic.
But all is not doom and gloom. Azure users have a variety of tools they can use to overcome the different challenges involved in monitoring their stack, helping them gain insight into the different components of their apps and troubleshoot issues when they occur.
In this guide, I’d like to provide readers with some information they can use when considering what path to take on their Azure monitoring journey. I will outline everything from what there is to monitor to start with, to the challenges involved and the two main solutions available to overcome them — Azure Monitor and the ELK Stack.
Anatomy of an Azure Environment
Every application is designed differently and is comprised of different building blocks. Still, there are some common architectural guidelines when it comes to deploying modern web applications on the cloud. Whether on AWS, Azure or Google Cloud Platform, the same key ingredients are all there.
Before we understand what we are monitoring, it would help to understand what a classic Azure deployment looks like. Modern applications that must comply with strict SLAs cannot make do with the traditional web tier and data tier architecture. These two tiers are just part of a much more complex architecture as shown in diagram 1 below.
In the example shown here, our application is replicated across two Azure regions with the Azure Traffic Manager routing incoming requests to these regions. We’ve got Azure DNS for name resolution. We’re using Active Directory for securing access to the app and user identity control and management. We’re using Application Gateway as a load balancer. And so forth.

Azure full-stack monitoring
To be able to ensure all these components are performing as expected, Azure users need to tap into all the different layers an Azure environment is comprised of by collecting and analyzing the different data they generate (see diagram 2).
Starting with tenant-related data such as Azure Active Directory audit logs, through Azure Subscription data such as Activity Logs, diagnostic logs from various Azure resources, and application and operating system level data — all of this data provides Azure users with a comprehensive view of their environment, allowing them to monitor production performance and troubleshoot issues should they occur.

Azure monitoring data
To help gain visibility into these different components, Azure users can use a variety of different data sources and types made available by Azure. This data can be collected by users and stored in Azure storage accounts for analysis with Azure Monitor or 3rd party monitoring tools. Below is a brief overview of the main data types falling under this category.
Azure Activity Logs
These logs allow users to monitor who did what and when for any write operations (PUT, POST, DELETE) executed for Azure resources in a specific Azure subscription and to understand the status of the operation and other relevant properties.
Azure Diagnostic Logs/Metrics
Azure diagnostic logs provide users with insight into the operation of a specific Azure resource and can contain both logs and metrics. Diagnostic logs will differ in format and content from one another.
Azure Storage Logs/Metrics
Azure storage logs and metrics provide users on storage accounts to enable them to trace requests, analyze usage trends and diagnose issues.
Compute Logs
Azure VMs (Windows/Linux) also generate logs that can be collected and stored on Azure storage accounts. This data provides users with operational insight into how the servers running their applications and services are performing.
More on the subject:
Azure key monitoring requirements
If only it was that easy. Cloud architectures pose a long list of challenges that must be overcome to be able to achieve that comprehensive view we described above.
From their very nature, cloud environments are highly distributed, meaning that at any given time there are multiple sources generating data. Not only that, these environments are highly dynamic so if your services are containerized, for example, you must think of a way to counter the transient nature of containers to be able to persist data. Add to this the sheer amount of data even a small to medium sized Azure environment generates and the picture gets even more complicated.
To overcome these challenges, the solution Azure users rely on for monitoring and troubleshooting their applications must provide them with the following basic capabilities:
- Data aggregation – users need to be able to easily access and integrate with all the data sources across their Azure environment, collect the generated data, whether logs or metrics, and store this data in a centralized data store.
- Data ingestion – data pipelines are responsible for handling large amounts of data and in some cases can come under a substantial amount of pressure that results in failing components. Shippers, and the storage backends they ship the data to, must be designed to be resilient enough to handle large and fluctuant volumes of data.
- Alerting – to be aware when issues with a potential business impact are taking place in their Azure environment, users must have the ability to create alerts that notify them in real-time. This enables users to be more proactive and stay on top of events as they occur.
- Data storage – the data collected from the different Azure data sources must be stored in a centralized data store that can provide the scale required to support data growth and data bursts. The last thing you want to face when diagnosing a production issue is a failing datastore because you reached capacity.
- Data processing – collecting and storing data is great, but if you cannot process this data then analyzing it will be more challenging. For example, an Azure monitoring solution needs to be able to process fields containing IPs and enhance them with geographical information. Querying data and visualizing it is easier if data is parsed and processed accurately.
- Analysis – end users must be able to effectively conduct data analysis of Azure monitoring data. Processing will help but also analysis tools. A basic requirement is the ability to search or query the data. Being able to slice and dice the data with visualizations and dashboards is another key requirement. Ideally, users should be able to use advanced analysis capabilities such as anomaly detection and machine learning to find the needle in the haystack.
Azure Monitoring Solutions
To monitor their Azure environment, there are a number of solutions users can deploy. In this section, we will examine two of these solutions — Microsoft Azure Monitor and the ELK Stack. Both solutions help users overcome the key challenges outlined above but both are also very different than each other.
Let’s take a closer look.
Azure Monitor for, well, Azure Monitoring
Simply put, Azure Monitor is an Azure-native, all-in-one, logging and monitoring solution for Azure environments.
As an Azure service, Azure Monitor offers scalability, high availability, and security. From a functionality perspective, Azure Monitor provides built-in support for Azure resources, alerts, APIs for 3rd party integrations and advanced analytics capabilities powered by machine learning.
The Azure Monitor service incorporates two components that used to be offered separately in the Operations Management Suite (OMS) — Log Analytics and Application Insights. Taken together, Azure Monitor is an extremely robust solution that can provide end-to-end visibility into an Azure environment.
Because it is an Azure-native solution, the different types of logs and metrics that can be used for monitoring are collected almost automatically. Activity Logs, for example, show up in the Azure Monitor without the need to build a dedicated data pipeline.
There are a few challenges that are worth mentioning as well.
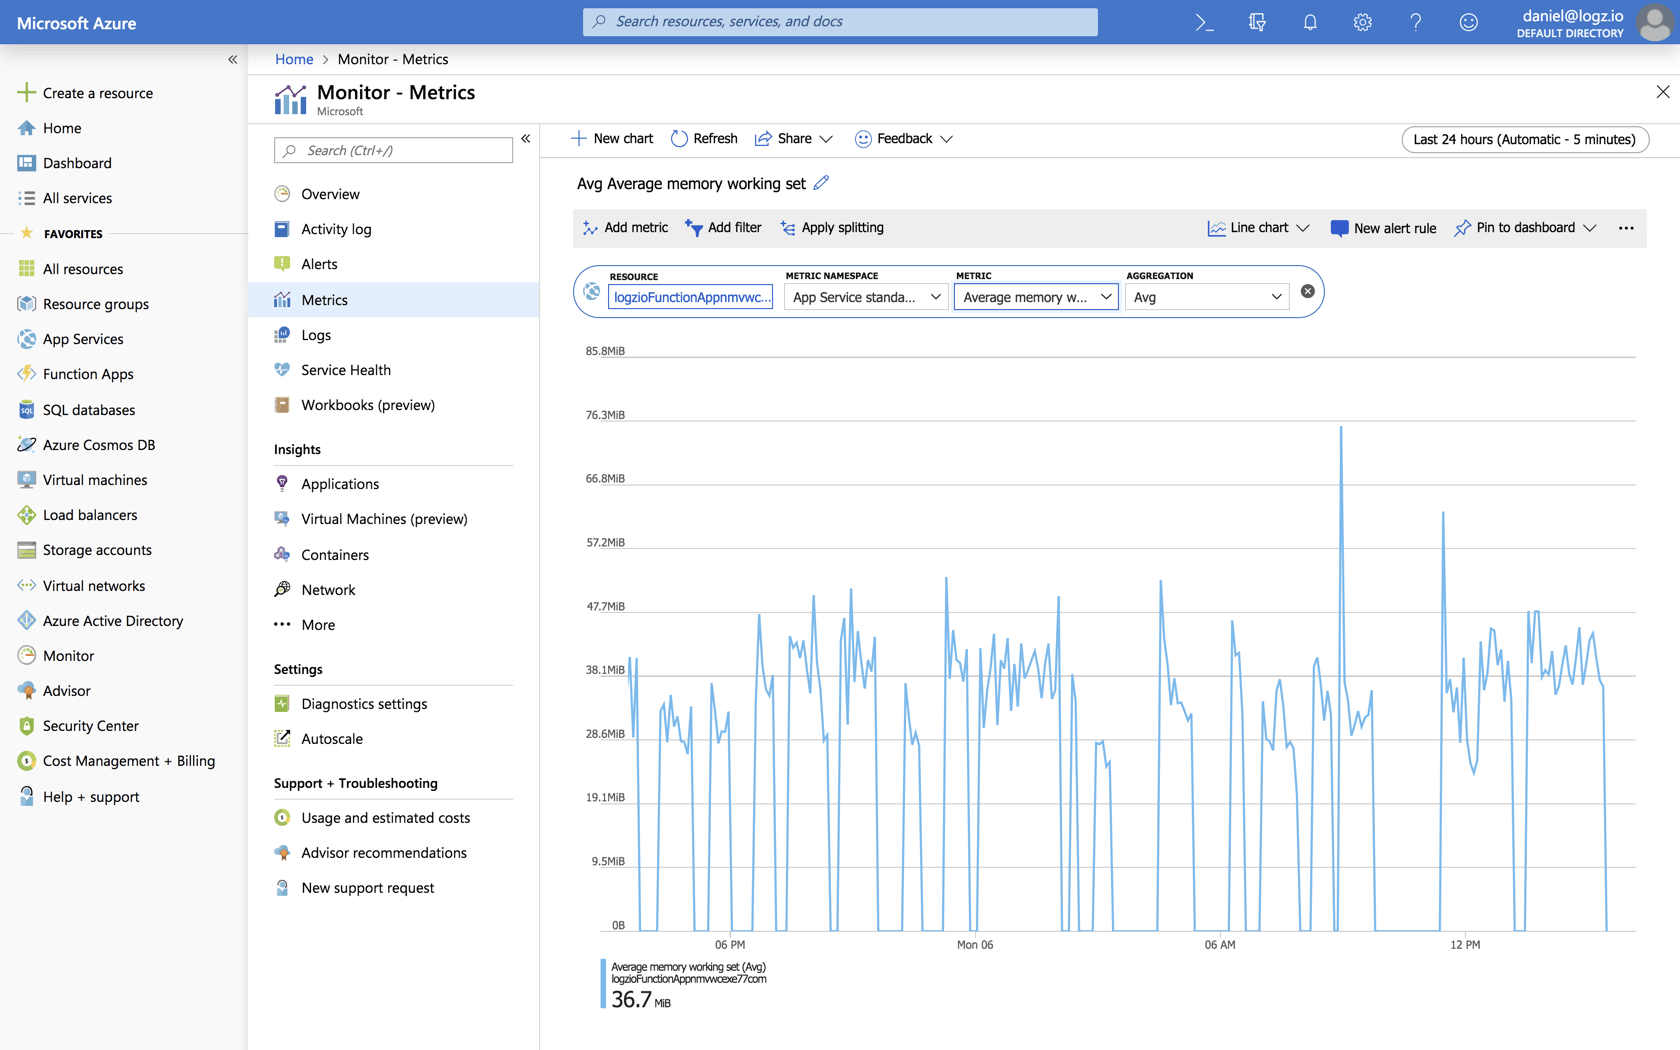
While Azure Monitor provides some pre-built dashboards, specifically for metrics, users might find themselves somewhat limited as to how much they can customize the data displayed (a list of limitations is available here).
Being tied to Azure means that integrating Azure Monitor with external data sources is not straightforward. If your apps are deployed on a multi-cloud architecture for example, you will find it difficult to centralize your monitoring and logging pipelines.
And of course, Azure Monitor is a proprietary solution which incurs an actual cost in $ (based on the volume of data being collected) and which also requires skills and expertise to master.
The ELK Stack for Azure Monitoring
In the open source corner (well, as of January 2021, formerly open source), is the second most popular monitoring solution for Azure, is the ELK Stack (Elasticsearch, Logstash & Kibana). As the world’s most popular open source log analysis platform, the ELK Stack is a natural choice for monitoring and troubleshooting any cloud-based application.
This is not the place to explain the popularity of ELK but suffice to say it provides users with an open source platform that answers almost all of the requirements we outlined above. Elasticsearch acts as a scalable data store, Logstash aggregates and processes the data and Kibana is used to query and visualize the data (the fourth element in the stack, beats, are used to actually collect and forward different types of data from data sources.)
The ELK Stack is a preferred option for Azure users also because it’s open source, which means there is a large community backing it and driving new features and that it helps companies avoid vendor lock-in. Because ELK is so popular, training and onboarding new members of the team is usually simpler.
And of course, it’s free.
Costs, though, come in many shapes and colors. The ELK Stack can be relatively easy to deploy and get started with but can become quite an architectural headache as your data pipelines become more complicated and the environment itself becomes more complex. Data volumes grow. And as great as the open source ELK is, it requires some additional legwork to make it production-grade.
Production Checklist
Whether deployed on the cloud or in your own data center, if you’re planning on using the ELK Stack for monitoring Azure, here is a list of some key requirements that must be taken into consideration:
- Resiliency – because you cannot afford to lose data, data pipelines must be resilient. Buffering and queuing components such as Apache Kafka and RabbitMQ need to be included in the architecture.
- Scalability & high availability – to support data growth and data bursts, Elasticsearch clusters must be designed for scale. Replication across regions, or segments in your datacenter, must be considered for high availability.
- Security – your data must be secured and so adding authentication and encryption to the architecture are a minimum requirement.
- Processing – As mentioned above, the more accurately data is parsed the easier analysis is down the road so be sure to apply the right processing in Logstash or using Elasticsearch ingest nodes.
- Retention – Depending on your needs, you need to plan for long term retention. For troubleshooting, for example, a few days might suffice, but for other use cases you’ll need to make sure you have enough resources for longer retention and automatic processes to remove old indices and for archiving and backups.
- Alerting – to be more proactive in how you monitor Azure, you will need to build an alerting mechanism on top of Elasticsearch and Kibana.
- Monitoring – last but not least – to be sure your ELK Stack is performing as required, think about monitoring whatever you can, including ingestion rates, lags in Kafka, Elasticsearch indices, Logstash performance, etc.
Suggested ELK Architecture
Based on this checklist, what would an ELK production deployment look like? In diagram 4 below is a suggested architecture for deploying ELK on Azure. This might not suit everyone’s environment and will most likely vary from use case to use case, but it complies with our list of key requirements.
We have Kafka acting as a buffer in front of Logstash for data resiliency. We‘re using Elasticsearch clusters with 3 master nodes and 2 data nodes, each. We’re using Elasticsearch Curator to delete old indices and are archiving to Azure blob. We’ve installed ElastAlert for alerting and are deploying Nginx as a proxy server for authentication. And we’ve replicated this architecture in two Azure regions for high availability.

Logz.io for Azure
At Microsoft Build 2019, Microsoft and Logz.io announced a joint partnership that enables Azure users to leverage Logz.io’s fully managed ELK solution to monitor their environment. That partnership has deepened since.
The solution provides users with Azure-native monitoring features, including seamless integration with Azure resources, built in dashboards for different Azure resources and availability across 6 Azure regions.
What this means for Azure users, first and foremost, is that instead of spending time monitoring their ELK Stack, they can focus on what matters most to their business — building, deploying and monitoring their apps.
Endnotes
Monitoring applications on Azure is an engineering challenge that requires a very specific type of solution. Ideally, this solution needs to be easily deployed, it needs to integrate natively with Azure data sources, it needs to be able to scale automatically, and it needs to provide users with the tools to analyze all the data collected.
The ELK Stack can help you overcome these core challenges and meet these basic requirements but requires some work to deploy at scale. Handling large ELK deployments is not impossible — a lot of teams around the world have succeeded.
But at the end of the day, it’s a decision every organization needs to take. Is the organization willing to invest time and resources in monitoring their monitoring stack or would they rather focus on monitoring what matters most to them and their business — their apps?
To summarize the Azure monitoring solutions reviewed above, here is a high-level comparison comparing some of the key features and functionality:
Azure Monitor
ELK Stack
Logz.io
Deployment type
Azure service
Cloud, on-prem
SaaS
Integration
Azure-native
Logstash, Beats, Event Hub, Azure blob
Azure-native
Logs/metrics
Yes
Yes
Yes
Scalability & resiliency
Automatic
Manual
Automatic
High availability
Automatic
Manual
Automatic
Querying
Yes, limited
Yes
Yes
Parsing
Manual
Manual
Manual & Automatic
Visualization
Yes, limited
Yes
Yes
Alerts
Yes
Requires setup
Yes
Authentication & user control
Azure-native
Requires setup
Yes
Canned dashboards
Yes
No
Yes
Live tailing
No
No
Yes
Anomaly detection
Yes
No
Yes
Compliance
Yes
No
Yes

You Might Also Like

What’s New at Logz.io – January 2026

