
Prometheus vs. Graphite: Which Should You Choose for Time Series or Monitoring?
July 24, 2018
Prometheus and Graphite are open-source monitoring tools used to store and graph time series data. Prometheus is a “time series DBMS and monitoring system,” while Graphite is a simpler “data logging and graphing tool for time series data.” Both are open source and primarily used for system monitoring, yet Prometheus takes on additional tasks. In this article, we’ll pit Prometheus vs Graphite, side by side, mano a mano, and offer some criteria for choosing the right option.
One of the key performance indicators of any system, application, product, or process is how certain parameters or data points perform over time. What if you want to monitor hits on an API endpoint or database latency in seconds? A single data point captured in the present moment won’t tell you much by itself. However, tracking that same trend over time will tell you much more, including the impact of change on a particular metric.
If you want to know, for example, the impact a new community process or documentation has on the number of hits on your API, or how a specific software fix affected your database’s latency, comparing the present value to a previous one done before the change was introduced will be useful. Such is the value of time series data.
Monitoring tools built around time series data need to do the following under a very high transaction volume:
- Collect (or at least listen for) events, typically with a timestamp;
- Efficiently store these events at volume;
- Support queries of these events;
- Offer graphical monitoring of these capabilities so that trends can be followed over time.
Overview of Graphite
In a way, Graphite is simpler than Prometheus, with fewer features and a simple raison d’etre. According to its own documentation, it does precisely two things:
- Store numeric time series data
- Render graphs of this data
Although Graphite will not collect data for you, there is a component—a Twisted daemon called Carbon—which passively listens for time series data. Data is stored in a simple library called Whisper. Finally, graphs can be rendered on-demand via a simple Django web app.
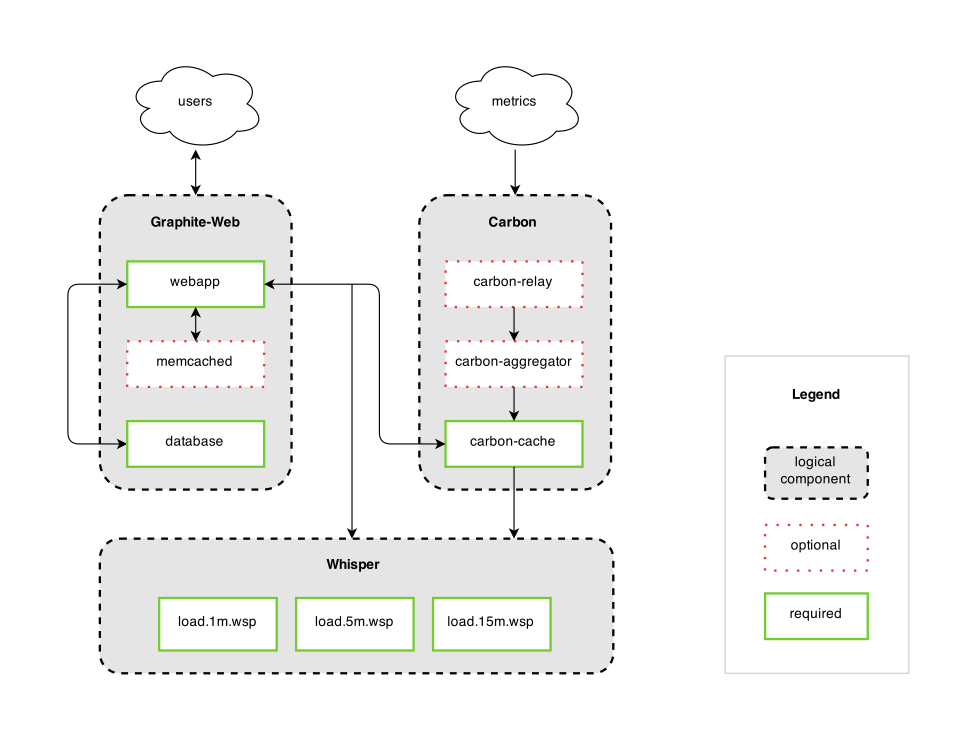
Illustration Source: Graphite Documentation
It’s worth reiterating that in contrast to Prometheus, data collection to Graphite is passive, meaning that applications sending it data need to be configured to send data to Graphite’s carbon component.
Prometheus Overview
While Graphite is a simple data logging and graphing tool, which can be broadly applied beyond mere monitoring, Prometheus is a comprehensive system and service monitoring system. This demonstrates that while Prometheus is at once more feature-rich, it also has a more specific and narrower application.
Prometheus—developed more recently—takes on the additional challenge of scale and contains numerous features, including a flexible query language (PromQL), a push gateway (for collecting metrics from ephemeral or batch jobs), a range of exporters, and other tools.
Prometheus actively scrapes data, stores it, and supports queries, graphs, and alerts, as well as provides endpoints to other API consumers like Grafana or even Graphite itself. It does all of this via the following components:
- Client libraries – instrumenting application code (for generating events);
- Prometheus server – scraping and storing these events, when fired, as time series data;
- Pushgateway – supporting short-lived data import jobs;
- Data exporters – exporting to services like HAProxy, StatsD, Graphite, etc.;
- Alertmanager – handling alerts.
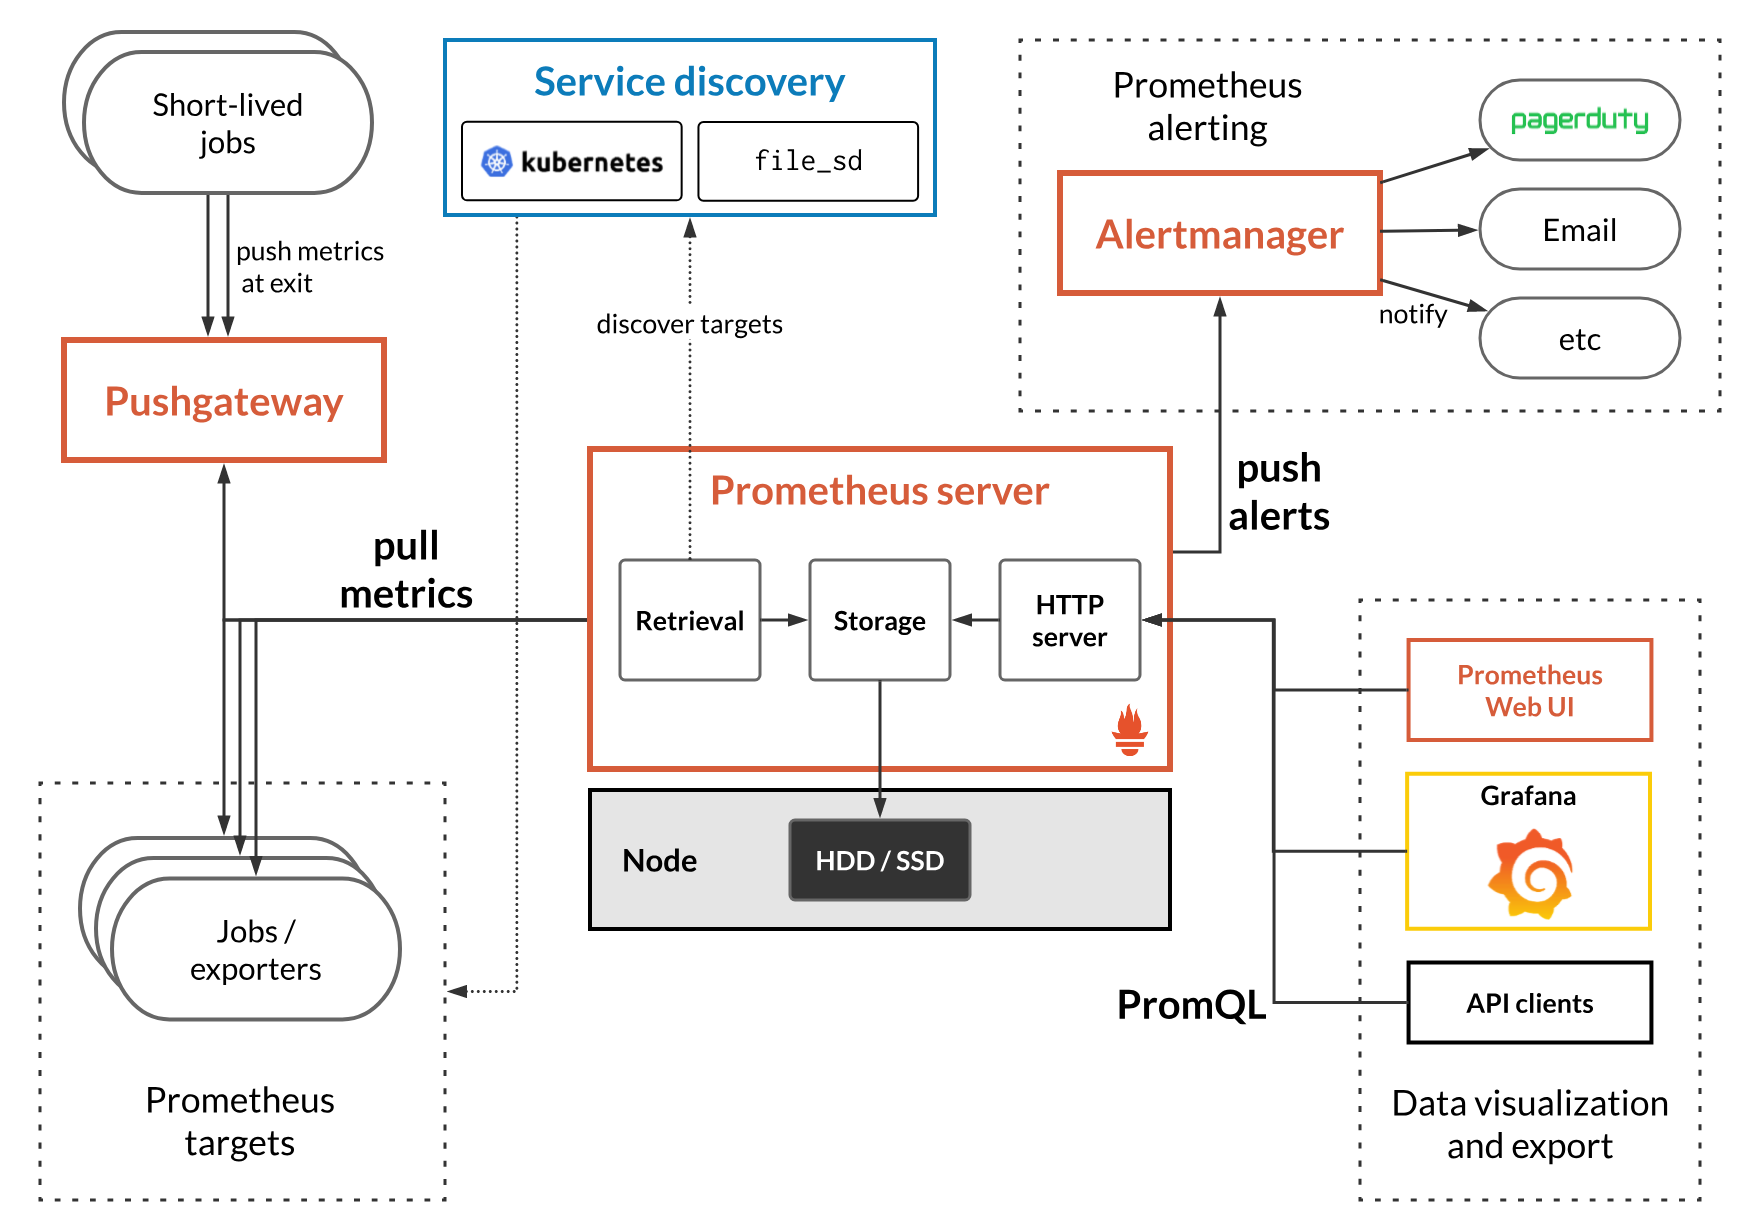
Illustration Source: Prometheus Documentation
Prometheus Differentiators
Prometheus sets itself apart from other monitoring systems with the following features, according to its own documentation:
- A multi-dimensional data model, where time series data is defined by metric name and key/value dimensions;
- A flexible query language;
- Autonomous single server nodes with no dependency on distributed storage;
- Data Collection via a pull model over HTTP;
- Time series data pushed to other data destinations and stores via an intermediary gateway;
- Targets discovered via service discovery or static configuration;
- Multiple support modes for graphs and dashboards;
- Federation-supported both hierarchically and horizontally.
As the diagram above shows, Prometheus supports multiple third-party implementations for service discovery, alerting, visualization, and export—thus enabling the admin to use the best-suited technologies for each. And this isn’t even a complete selection.
Prometheus released several years after Graphite, can perhaps be viewed as a refinement of it, focused on monitoring, with additional features and performance tweaks.
High-Level Comparison
| Feature | Prometheus | Graphite |
| What it is | Fully integrated time series DBMS and monitoring system | Time series data logging and graphing tool |
| What it does | Scraping, storing, querying, graphing, and alerting based on time series data. Provides API endpoints for the data it holds | Stores numeric time series data and provides graphs of that data |
| Implemented in | Go | Python |
| Data types handled | Numeric | Numeric |
| Year released | 2012 | 2006 |
| Website | prometheus.io | github.com/graphite-project/graphite-web |
| Technical documentation | prometheus.io/docs | graphite.readthedocs.io |
| APIs and access methods | RESTful HTTP and JSON | HTTP API Sockets |
| XML support? | Yes (can be imported) | No |
| Server Operating Systems | Linux, Windows | Linux, Unix |
| Supported programming languages | .NET, C++, Go, Haskell, Java, JavaScript (Node.js), Python, Ruby | JavaScript (Node.js), Python, (although you can push metrics to it from virtually any language) |
| Partitioning supported? | Yes, sharding | Yes, via consistent hashing |
| Replication supported? | Yes, by federation | Not by default, but tools exist to support clustering |
| Data collection | Active or pull (configurable) | Passive or push |
Features
Data Collection and Usage
Graphite has no direct data collection support. Carbon listens passively for data, but in order to enable data collection, you should include solutions like fluentd, statd, collectd, or others in your time series data pipeline. Once collected, Graphite has a built-in UI with which to visualize data.
Alternatively, Prometheus, is a complete monitoring solution, which includes built-in collection, along with storage, visualization, and exporting.
Storage
Graphite can store time series data. Specifically, this data is usually collected from collection daemons (like those mentioned above), or other monitoring solutions like Prometheus. Graphite data is queried over HTTP via its Metrics API or the Render API. In Graphite, Carbon stores data points to Whisper. There is one file per metric (a variable being tracked over time), which works like a giant array, so writing to the file is very precise. In addition, there is also one file per automatic roll-up.
On the other hand, Prometheus offers key-value tagging along the time series itself, which provides better organization and more robust query capabilities.
Prometheus’s own documentation explains how on-disk storage is handled. Ingested data is grouped into two-hour blocks, where each block is a directory containing one or more chunk files (the data itself), plus a metadata and index file as follows:
./data/01BKGV7JBM69T2G1BGBGM6KB12
./data/01BKGV7JBM69T2G1BGBGM6KB12/meta.json
./data/01BKGV7JBM69T2G1BGBGM6KB12/wal
./data/01BKGV7JBM69T2G1BGBGM6KB12/wal/000002
./data/01BKGV7JBM69T2G1BGBGM6KB12/wal/000001
In the meantime, a background process compacts the two-hour blocks into larger ones.
Visualization and Dashboards
Graphite offers fairly basic but useful visualization options available via its Django web app. Additionally, Graphite also supports dashboard editing.
Prometheus uses console templates for dashboards, but being feature-rich, the learning curve of these can be fairly high. Of course, being open source, custom solutions are available to either solution with just a bit of code.
It’s worth mentioning that users of both solutions typically rely on Grafana as a user interface, as the built-in UIs for both are generally insufficient.
Plug-In Architecture and Extensibility
Graphite doesn’t provide plug-ins. However, a lot of tools already exist which are Graphite-compatible.
Prometheus hosts an ecosystem of exporters, which enable third-party tools to export their data into Prometheus. Many open-source software components are already Prometheus-compatible by default.
Alarm and Event Tracking
Graphite can track events, but doesn’t support alarms directly.
Prometheus, on the other hand, doesn’t support event tracking, but does offer complete support for alarms and alarm management. Prometheus’ query language does, however, let you implement event tracking on your own.
Cloud Monitoring Capability
AWS CloudWatch is already available for most of the functions that Graphite covers. However, there are some components in GitHub that enable pushing AWS CloudWatch data to Graphite.
Prometheus supports an official exporter for AWS CloudWatch, enabling you to monitor all your AWS cloud components. There is apparently no support yet for OpenStack’s Gnocchi, a related time series Database as a Service, but some have expressed interest in this.
Community
Prometheus and Graphite are both open-source and well-maintained by active developer communities. As of July 2018, Prometheus’ primary GitHub repo has been forked over 2,200 times, compared to Graphite’s 1,100+ forks.
Both tools are developed in the open, and you can interact with developers and community members via IRC, GitHub, and other communication channels.
IRCs are:
Popularity
As of June 29, 2018, the solutions ranked accordingly on DB-Engines:
- Graphite – #84 overall, #4 Time Series DBMS
- Prometheus – #107 overall, #6 Time Series DBMS
Time series solutions have grown significantly faster in adoption than other database categories in recent years. For example, by mid-2016, time series DBMS gained almost 27% popularity during the previous 12 months, more than twice the gain of Graph DBMS.
Time series solutions often contain specialized features and are performance-tuned for typical use cases, making their category a quickly evolving one.
Similarities
- Offer visualization tools for time series data.
- Store numeric samples for named time series.
- Open Source.
- Compatible with a wide range of tools and plug-ins, including Grafana.
- Design with reliability in mind and are fault-tolerant.
- Enable real-time monitoring of time series data.
Differences
- Prometheus provides direct support for data collection, whereas Graphite does not.
- Graphite uses functions rather than its own query language, while Prometheus’s PromQL is very robust, particularly with metadata models
- Prometheus is a full monitoring and trending system that includes built-in and active scraping, storing, querying, graphing, and alerting. Graphite is a passive time series logging and graphing tool. Other concerns like scraping and alerting are addressed by external components.
- Prometheus provides built-in support for alarms, while Graphite requires additional tools and effort to support alarm generation.
- Prometheus provides support for a wider range of client libraries than Graphite.
- Neither are truly horizontally scalable, but Prometheus supports partitioning (by sharding) and replication (by federation).
- Prometheus supports XML data import, whereas Graphite does not.
Elaborated Use Cases, User Stories, and Users
Developed at SoundCloud in 2012, Prometheus continues to be used at companies like Outbrain, Docker, DigitalOcean, Ericsson, and Percona. These and other companies leverage its strengths in multi-dimensional data collection and queries toward applications, including both static machine-centric, as well as dynamic service-oriented monitoring.
Graphite came into use in 2006 at Orbitz, where having proven its strengths in handling numeric time series data, it continues to be used today. Other companies including Instagram, Canonical, Oracle, Uber, GitHub, and Vimeo use Graphite to handle operation-critical time series data like application metrics, database metrics, e-commerce monitoring, and more. You can read more Graphite case studies here.
Call to Action
If you want a clustered solution that can hold historical data of any sort long term, Graphite may be a better choice due to its simplicity and long history of doing exactly that. Additionally, Graphite also has rollup of data built in. Similarly, Graphite may be preferred if your existing infrastructure already uses collection tools like fluentd, collectd, or statd, because Graphite supports them.
More on the subject:
However, if you are starting from scratch and intend to use the solution for monitoring (including more dynamic and multivariate data), and data retention is short term, Prometheus may be a better choice, as everything required for monitoring is already integrated.
There is a slightly longer learning curve to most things Prometheus. However, the time invested will pay for itself in not having to maintain separate tools for collection and alerting, for example.
Always remember to review your needs and the state of your current implementation carefully. Prometheus is a complete monitoring system, with all the bells and whistles built in. Graphite is merely a storage and graphing framework. What does your system already have and what do you need it to do? You decide.

You Might Also Like

Tool Consolidation Is Dead. Long Live Agentic AI.

