
Distributed Tracing with Zipkin and ELK
May 10, 2018
While logs can tell us whether a specific request failed to execute or not and metrics can help us monitor how many times this request failed and how long the failed request took, traces help us debug the reason why the request failed, or took so long to execute by breaking up the execution flow and dissecting it into smaller events.More on the subject:
In a microservice architecture, tracing is extremely challenging because requests will span multiple services, each executing one or more processes, across multiple servers. Distributed tracing is a tracing methodology that seeks to overcome this challenge by instrumenting applications in specific junctions in the request’s path and reconstructing its lifecycle.
Zipkin, based on Google Dapper and initially developed by Twitter, is a Java-based application that is used for distributed tracing and identifying latency issues. Unique identifiers are attached to each request which are then passed downstream through the different waypoints, or services. Zipkin then collects this data and allows users to analyze it in a UI.

So why hook up Zipkin with the ELK Stack?
The Zipkin UI provides us with some basic options to analyze traced requests — we can use a dependency diagram to view the execution flow, we can filter or sort the traces collected by Zipkin per application, length of trace and timestamp.
Using ELK though, takes trace analysis up a notch. Elasticsearch can be used for long-term retention of the trace data and Kibana will allow you gain much deeper insight into the data. This article provides you with the steps to integrate the two tools.
Installing Zipkin
The easiest way to install Zipkin is using Docker:
docker run -d -p 9411:9411 openzipkin/zipkin
If you want to customize your Zipkin configuration though, it might be easier to pass some variables in the run command. In our case, I want to pass some environment variables and specify Elasticsearch as the storage type (this example assumes a locally running ELK Stack), and so I will use the following commands to download and run Zipkin:
curl -sSL https://zipkin.io/quickstart.sh | bash -s

java -DSTORAGE_TYPE=elasticsearch -DES_HOSTS=http://127.0.0.1:9200 -jar zipkin.jar
If all goes as expected, you should see this output in your terminal:
2018-05-02 09:59:27.897  INFO [/] 12638 --- [  XNIO-2 task-1]
o.s.web.servlet.DispatcherServlet        : FrameworkServlet
'dispatcherServlet': initialization completed in 108 ms
Open Zipkin at http://localhost:9411:
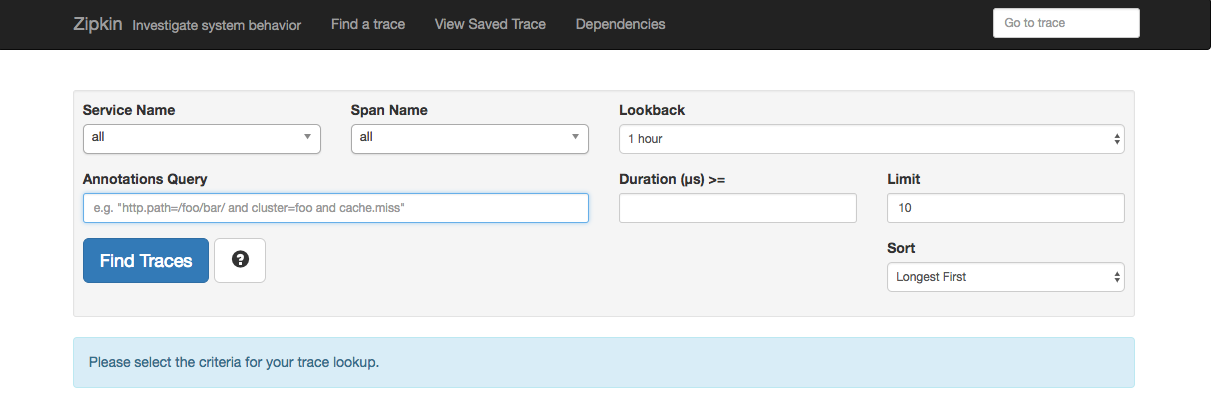
Of course, we have no traces to analyze in Zipkin yet, so our next step is to simulate some requests.
Setting up demo services
Zipkin provides a number of built-in instrumentations for Java, Go, Ruby, and #C apps, as well as a decent list of community instrumentations, for collecting tracing information and sending it to Zipkin.
For the sake of demonstrating how to hook up Zipkin with the ELK Stack, I’m going to be using an instrumentation library for Java applications called Brave. Specifically, I will be setting up two Java servlet services that communicate via http. Brave supports a whole lot more but this example will suffice for our purposes (you will need Java JDK 1.8 to run the services in your environment).
First, download the source code:
git clone https://github.com/openzipkin/brave-webmvc-example.git
In this example, there are two services that send tracing info to Zipkin — a backend service and a frontend service. Your next step is to start these services.
The frontend service:
cd /brave-webmvc-example/webmvc4
mvn jetty:run -Pfrontend
The backend service:
cd /brave-webmvc-example/webmvc4
mvn jetty:run -Pbackend
Both services should report the same success message in the run output:
[INFO] Started Jetty Server
It’s time to send out some requests. The frontend service can be accessed via http://localhost:8081 and calls the backend service and displays a timestamp.
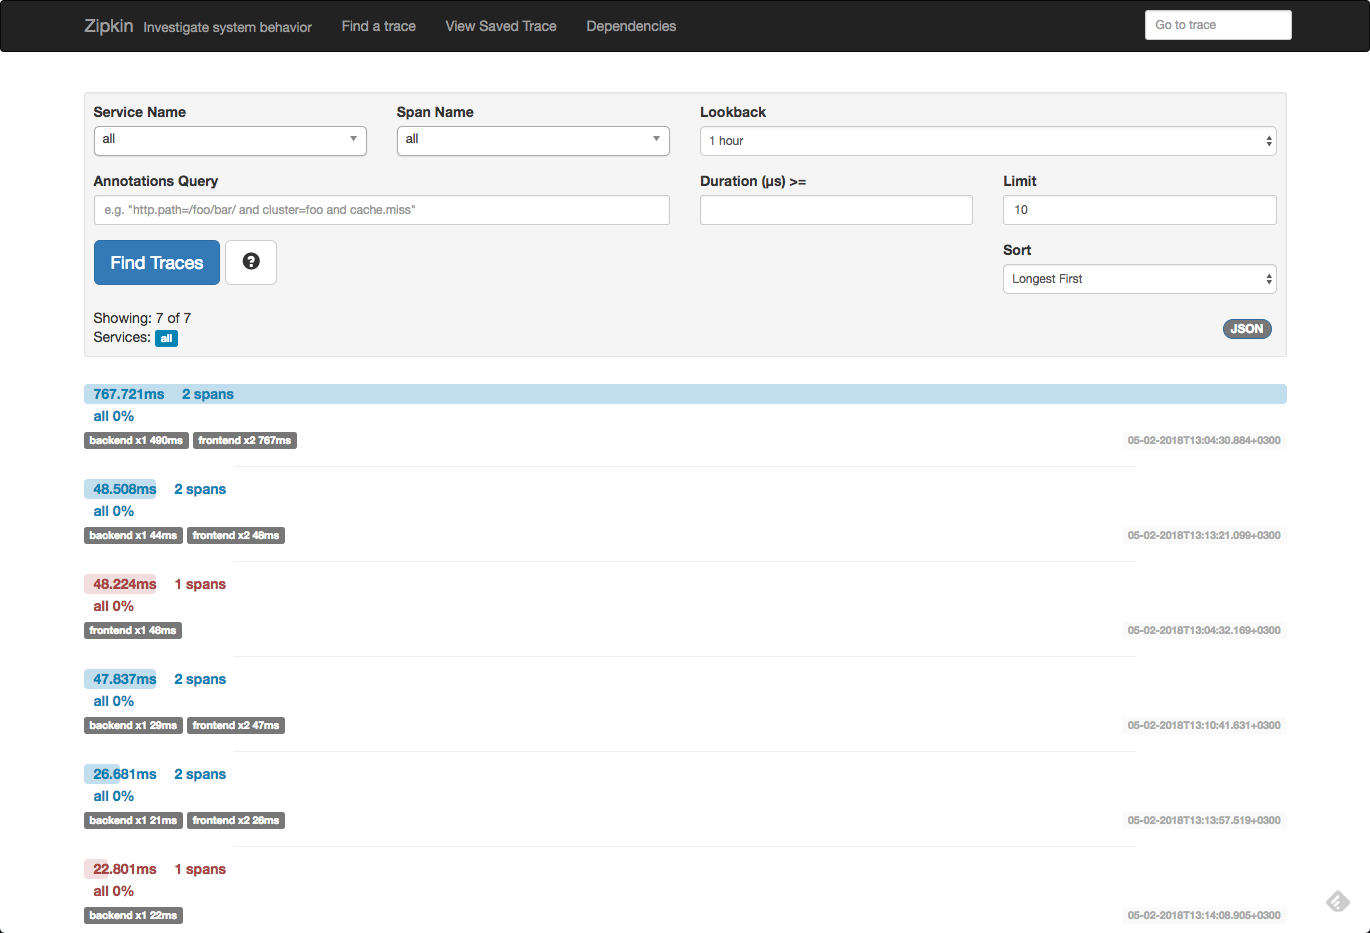
Opening Zipkin again, you should be able to see traces for called requests:
Because we defined Elasticsearch as the storage type when running Zipkin, the trace data should be indexed in Elasticsearch. To verify, run:
curl -XGET 'localhost:9200/_cat/indices?v&pretty'
You should see a ‘zipkin*’ index created:
health status index                  uuid                   pri rep docs.count docs.deleted store.size pri.store.size
yellow open   zipkin:span-2018-05-02 bpLwf0W1TVysyQ5gHpSkDw   5   1          4            0     14.7kb         14.7kb
Our next step is to open Kibana and define the new index pattern. Open Kibana at http://localhost:5601, and commence with defining a ‘zipkin*’ index pattern:

As the timestamp field, use the ‘timestamp_millis’ field:

After creating the index pattern, open the Discover tab and you will be able to see your trace information collected by Zipkin.

As you may notice, some of the fields include in the trace data are not mapped correctly. You could make do with the existing mapping but if you want to analyze and visualize all available data properly, you will need to do some Elasticsearch mapping adjustments.
For example, to map the ‘remoteEndpoint.port’ field, you would use the following mapping API:
curl -X PUT "http:/localhost:9200/zipkin:span-2018-05-02/_mappings/span" -H 'Content-Type: application/json' -d'

{
	"properties": {
		"remoteEndpoint": {
			"dynamic": "false",
			"properties": {
				"port": {
					"type": "string"
				}
			}
		}
	}
}
Once you have updated field mapping, refresh the mapping in Kibana to see your trace fields mapped correctly (under management → Index Patterns).
Analyzing trace data in Kibana
Kibana allows you to query the data using various different query types, but things start to get much more interesting when visualizing the data. Here are a few examples.
Average service duration
Using an average aggregation of the ‘duration’ field, you can create some metric visualizations that give you the average time for your services. Use a query to build the visualization on a specific service. In our example:
localEndpoint.serviceName:"frontEnd"

Average duration per service over time
It’s also interesting to see the trend over time for service duration. Kibana line chart visualizations are perfect for this.

Trace list
You can create a data table visualization that gives you a nice breakdown of all the traces collected from your application by Zipkin and stored in Elasticsearch.
To do this you would need to use a sum metric aggregation of the ‘duration’ field and a number of basic bucket aggregations as depicted below.

You can then add these up into one dashboard that provides a nice overview of your trace data.

Endnotes
Logs, metrics and traces are the three underlying tenets of what is being coined today in the industry as observability — instrumenting our environment to provide actionable insight through meaningful data. Of course, applications using microservices make implementing observability a whole lot harder and it’s no surprise that more and more tools are being introduced to help make it easier.
The ability to sample requests, Zipkin’s instrumentation libraries, as well as its native support for Elasticsearch storage are the main reasons that we at Logz.io use Zipkin to discover latency issues with our services. In a future post we will compare Zipkin to another tool in this space — Jaeger.

You Might Also Like

Investigating SIEM Incidents with Logz.io

