
Docker Performance Monitoring with Metricbeat and ELK Stack
December 4, 2017

There are an increasing amount of tools and methods for monitoring Docker deployments. These solutions range from command line utilities (docker-stats), to open source stacks (ELK Stack, Prometheus), to commercial tools (Datadog, Sysdig).
What tool you eventually choose depends, of course, on a number of different variables — how easy the implementation is, whether or not it is open source and if not–how much it costs, what metrics are exposed, and so forth.
In this article, I will explore the ELK Stack’s Metricbeat – a lightweight shipper that can be easily deployed on your Docker hosts, and configured to collect Docker-specific metrics. You can then ship these metrics for analysis and visualization. What makes configuring the pipeline especially simple are built-in modules that will automatically collect the necessary metrics from the host.
Setting up the stack
We’ll start by installing the components we’re going to use to construct the monitoring pipeline — Elasticsearch and Kibana to store and analyze the metrics, and Metricbeat to collect and forward them using the Docker module.
If you already have these components installed, feel free to skip to the next step.
Installing Java
First, we need Java 8:
sudo add-apt-repository ppa:webupd8team/java
sudo apt-get update
sudo apt-get install oracle-java8-installer
Installing Elasticsearch and Kibana
Next up, we’re going to download and install the Elastic public signing key:
wget -qO - https://artifacts.elastic.co/GPG-KEY-elasticsearch | sudo apt-key
add -
Save the repository definition:
echo "deb https://artifacts.elastic.co/packages/6.x/apt stable main" | sudo
tee -a /etc/apt/sources.list.d/elastic-6.x.list
Update the system, and install Elasticsearch:
sudo apt-get update && sudo apt-get install elasticsearch
Run Elasticsearch using:
sudo service elasticsearch start
You can make sure Elasticsearch is running using the following cURL:
curl “http://localhost:9200”
You should be seeing an output similar to this:
{


"name" : "iDluzaS",
 "cluster_name" : "elasticsearch",
 "cluster_uuid" : "TBIkNYN9T9WbYuP68dyL4g",
# Kibana is served by a back end server. This setting specifies the port to use.
 "version" : {
   "number" : "6.0.0",
   "build_hash" : "8f0685b",
   "build_date" : "2017-11-10T18:41:22.859Z",
   "build_snapshot" : false,
   "lucene_version" : "7.0.1",
   "minimum_wire_compatibility_version" : "5.6.0",
   "minimum_index_compatibility_version" : "5.0.0"
 },
 "tagline" : "You Know, for Search"
}
Next up, we’re going to install Kibana with:
$ sudo apt-get install kibana
Open up the Kibana configuration file at: /etc/kibana/kibana.yml, and make sure you have the following configuration defined:
server.port: 5601
elasticsearch.url: "http://localhost:9200"
And, start Kibana with:
$ sudo service kibana start
Installing Metricbeat
Our final installation step is installing Metricbeat. To do this, you will first need to download and install the Elasticsearch public signing key:
sudo apt-get install metricbeat
Configuring the Metricbeat Docker module
As mentioned above, Metricbeat (and Filebeat as well, but that is a topic for another article) supports a variety of different modules for collecting metrics from different services running on your server. For example, there are Metricbeat modules for Apache, nginx, Kafka, Kubernetes and more.
The Docker module calls the Docker API and collects different categories of metrics called metricsets. The supported metricsets are container, cpu, diskio, healthcheck, image, info, memory and network. You can find out more about the different metrics included in these categories here.
Opening the Metricbeat configuration file at: /etc/metricbeat/metricbeat.yml, we’re going to enter the following configuration:
metricbeat.modules:
- module: docker
  metricsets: ["container", "cpu", "diskio", "healthcheck", "info", "memory", "network"]
  hosts: ["unix:///var/run/docker.sock"]
  period: 10s

fields:
  env: dev

output.elasticsearch:
  # Array of hosts to connect to.
  hosts: ["localhost:9200"]
Under the metricbeat.modules section, we are specifying the Docker module and the metricsets we want to collect. We are specifying the Docker host to call and the frequency at which to ping Docker.
As our output, we’ve defined our local Elasticsearch instance, but of course, you could enter a remote Elasticsearch instance or another component in the pipeline (Logstash or Redis/Kafka).
We’ll run Metricbeat with:
sudo service metricbeat start
After a short while, you should be able to define the metricbeat-* index pattern in Kibana and see the actual metrics in the Discover tab.

Shipping to Logz.io
With a few easy tweaks to the configuration file, we can ship the metrics to Logz.io.
Use these commands first to download an SSL certificate:
wget
https://raw.githubusercontent.com/logzio/public-certificates/master/
COMODORSADomainValidationSecureServerCA.crt

sudo mkdir -p /etc/pki/tls/certs

sudo cp COMODORSADomainValidationSecureServerCA.crt
/etc/pki/tls/certs/
Then, enter the following configuration to the same /etc/metricbeat/metricbeat.yml file:
metricbeat.modules:
- module: docker
  metricsets: ["container", "cpu", "diskio", "healthcheck", "info", "memory", "network"]
  hosts: ["unix:///var/run/docker.sock"]
  period: 10s

fields:
  env: dev
  logzio_codec: plain
  token: JiWdcPIpTRTJGGINMwQWGVs XtMApZofv
  type: docker-metrics

fields_under_root: true
ignore_older: 3hr

output.logstash:
  hosts: ["listener.logz.io:5015"]
  ssl:
    certificate_authorities: ['/etc/pki/tls/certs/COMODORSADomainValidationSecureServerCA.crt']
Notes on this configuration.
First, under fields, we are adding some required fields necessary for shipping the metrics to Logz.io. The token can be retrieved from the Setting page in the Logz.io UI.
Second, as our output, we are defining the Logz.io Logstash listener as the destination and the SSL certificate to use for encryption.
Once done, we’ll restart Metricbeat with:
sudo service metricbeat restart
After a few seconds, the metrics will show up in Logz.io.
Time for some monitoring
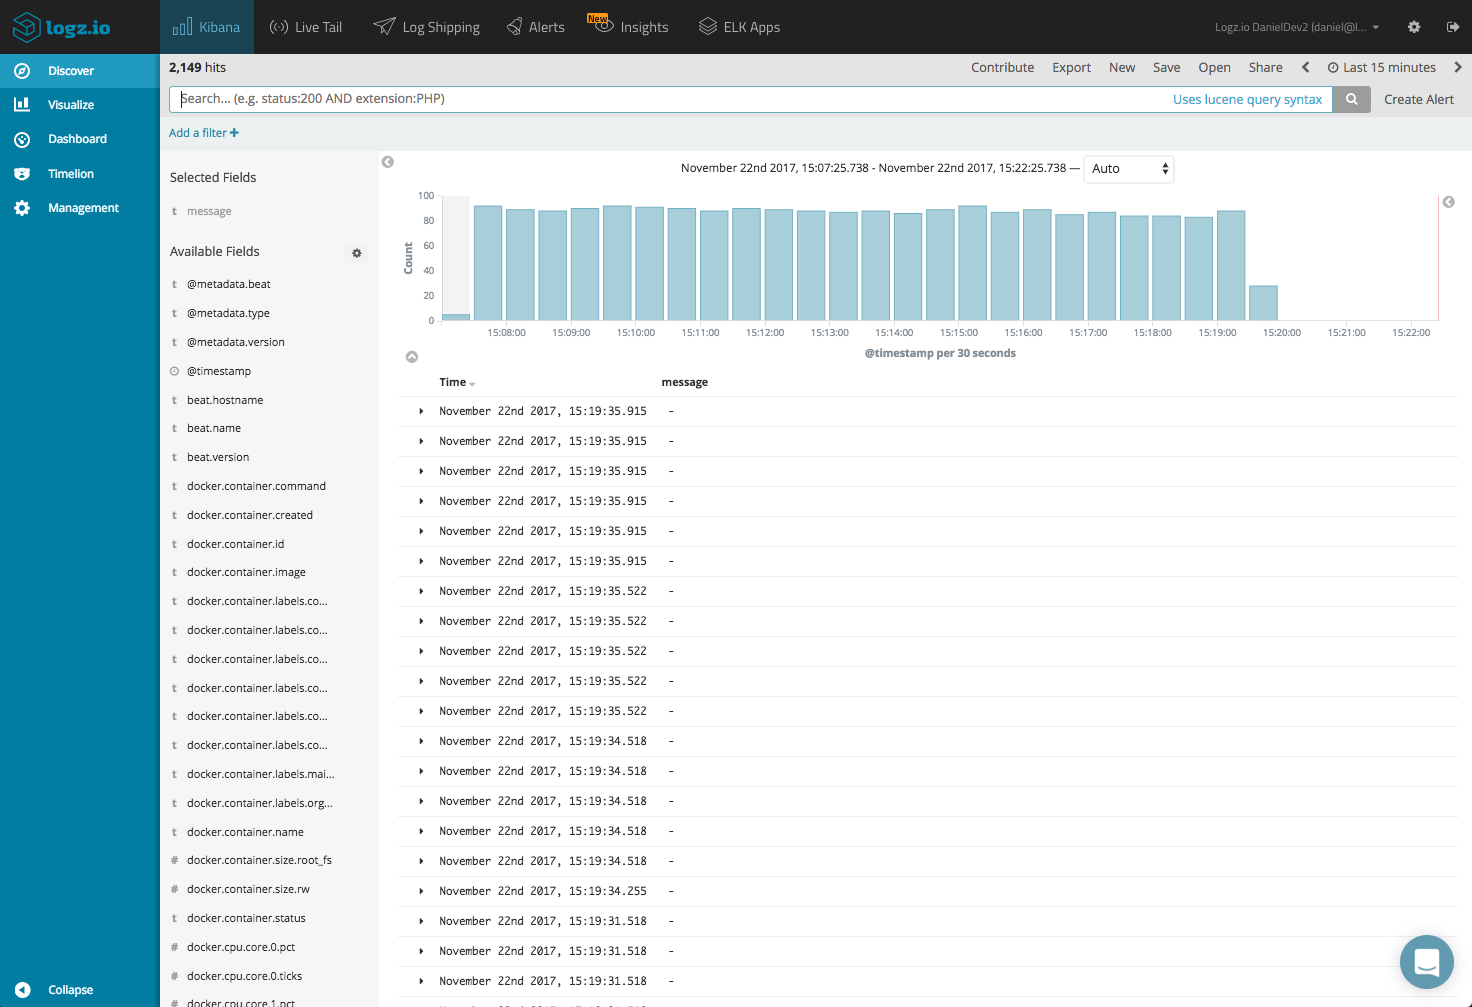
There is a wealth of information made available, and it’s easy to get lost and lose perspective. I like to start out by adding some fields to the main display area. This helps us get some visibility into what container is shipping the metric, what metricset the metric belongs to, etc.
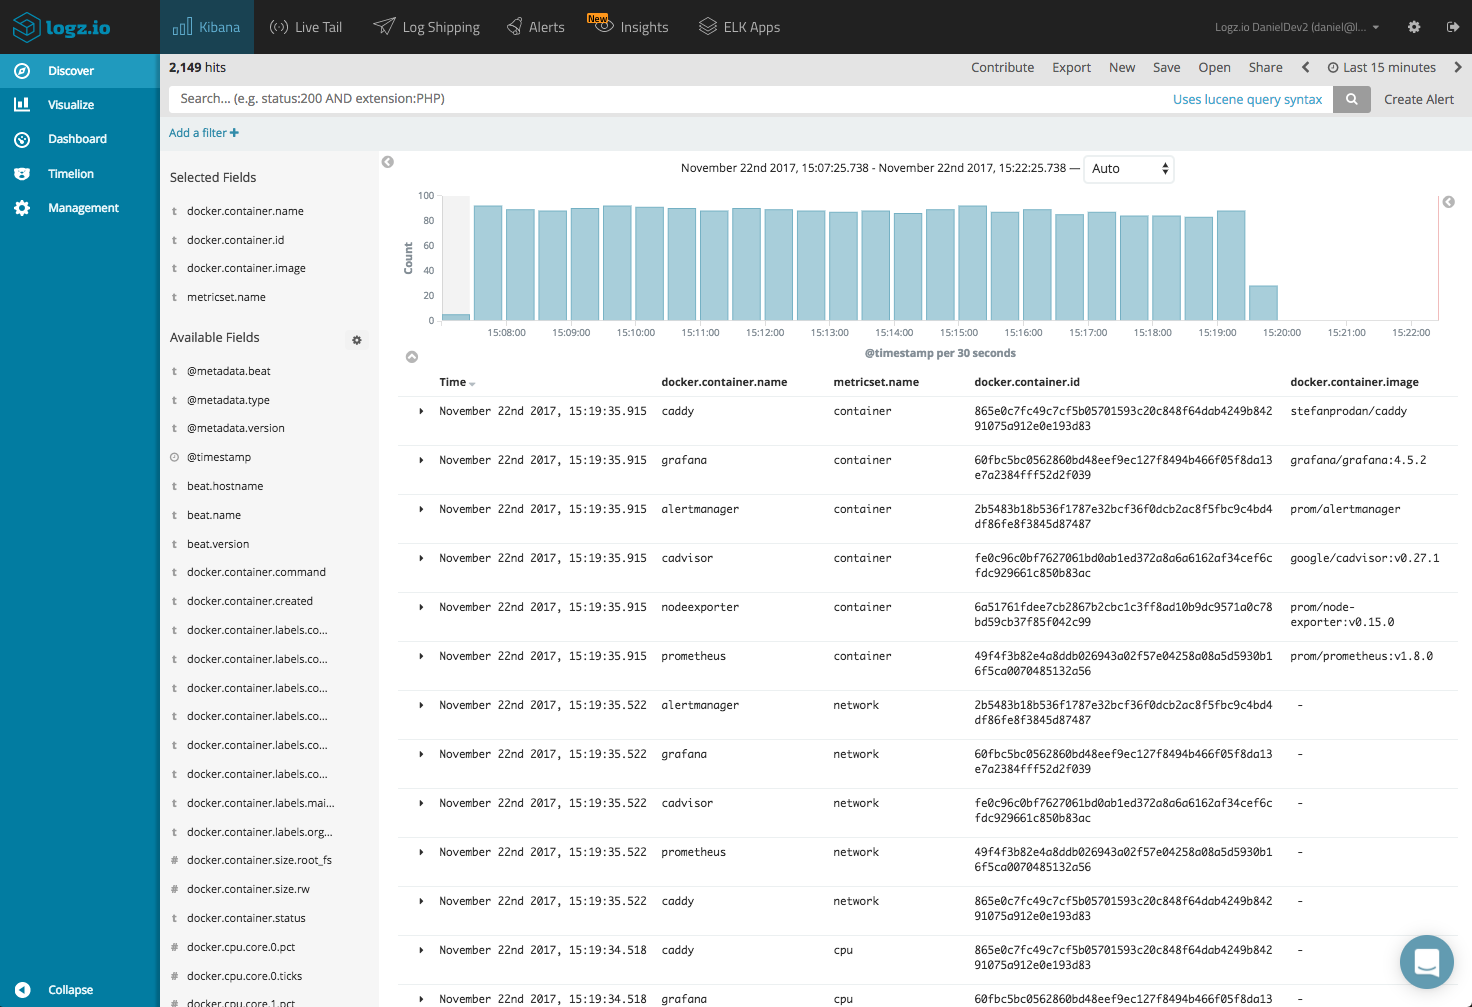
It’s always a good practice to get acquainted with the different fields available for analysis in your data. A full list of the exported fields can be seen here.
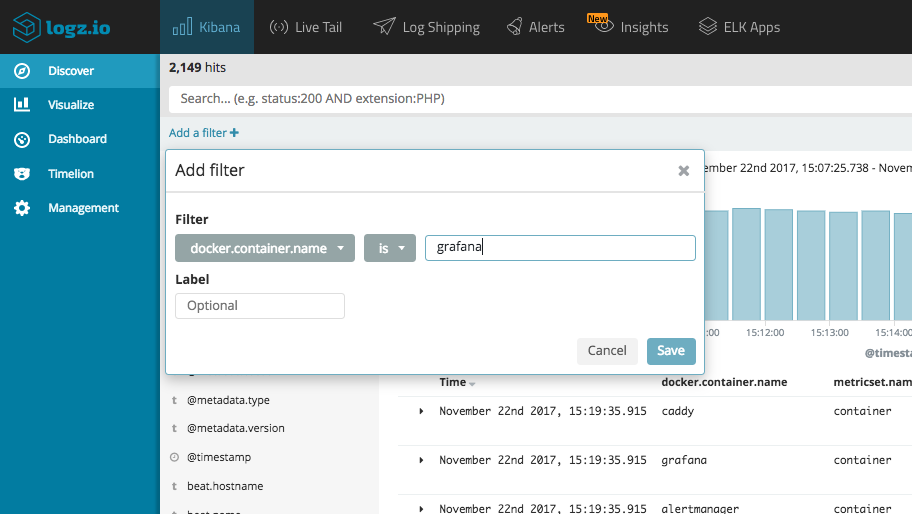
Use Kibana queries to search the data — for example, you can use the Filter option to focus on metrics for a specific container.
Things start to get interesting when visualizing the data and here, the sky’s the limit. Kibana supports a multitude of different visualization types that can be used to monitor the shipped metrics. Let’s take a look at some examples.
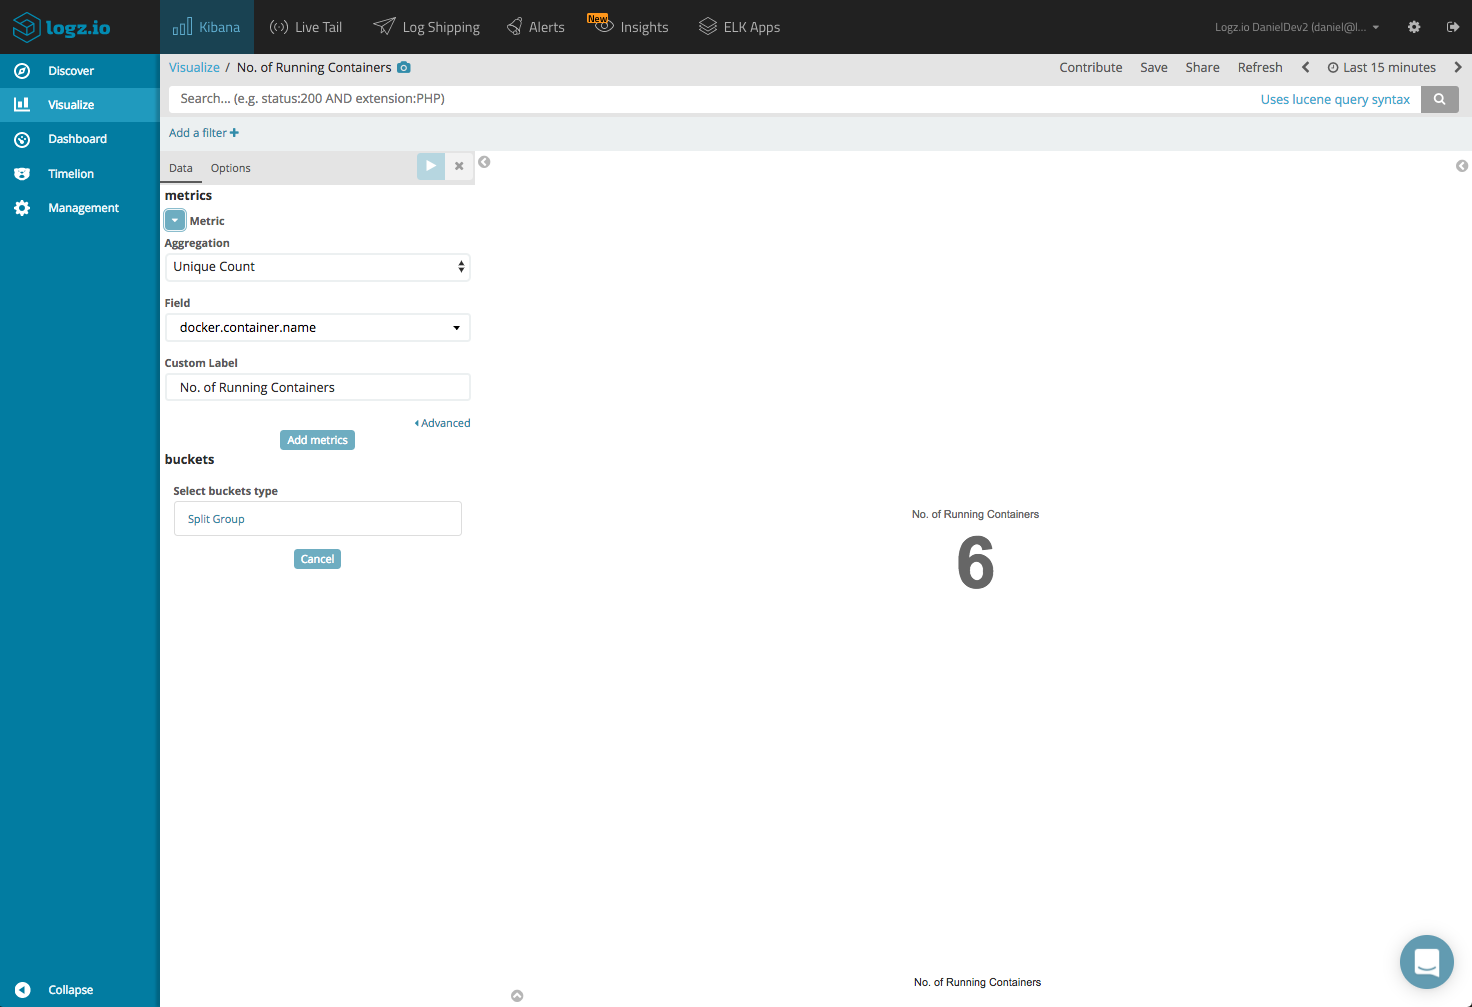
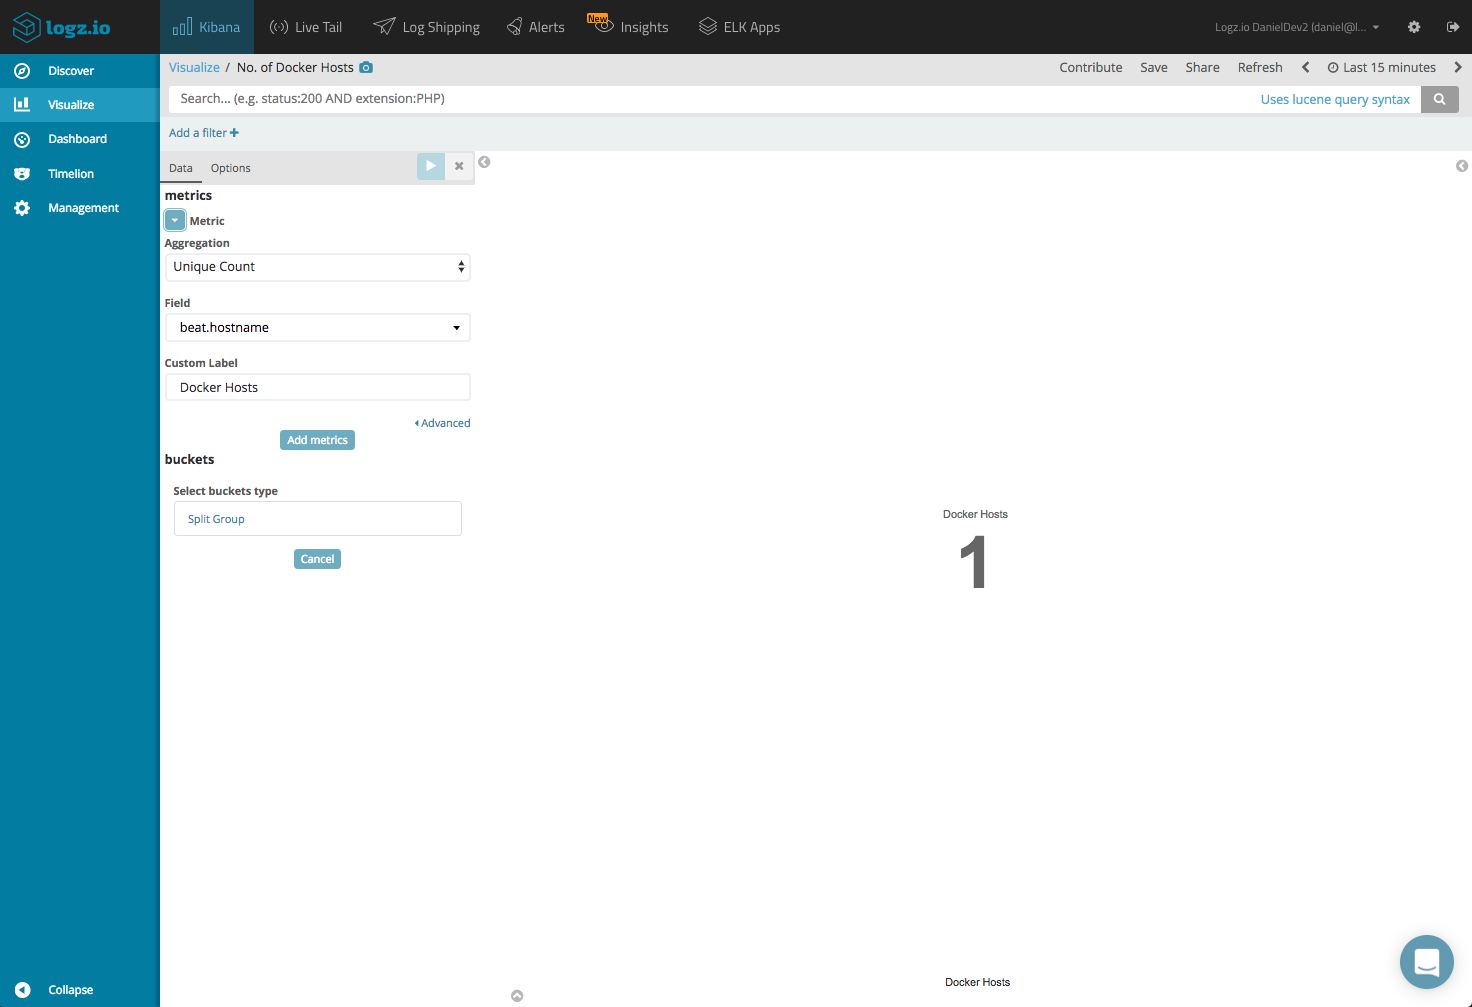
No. of Containers/Hosts
A simple example is creating some metric visualizations giving us an idea of the amount of hosts and containers that are shipping metrics.
To do this, we will use a Unique Count aggregation of the ‘beat.hostname’ and ‘docker.container.name’ fields.
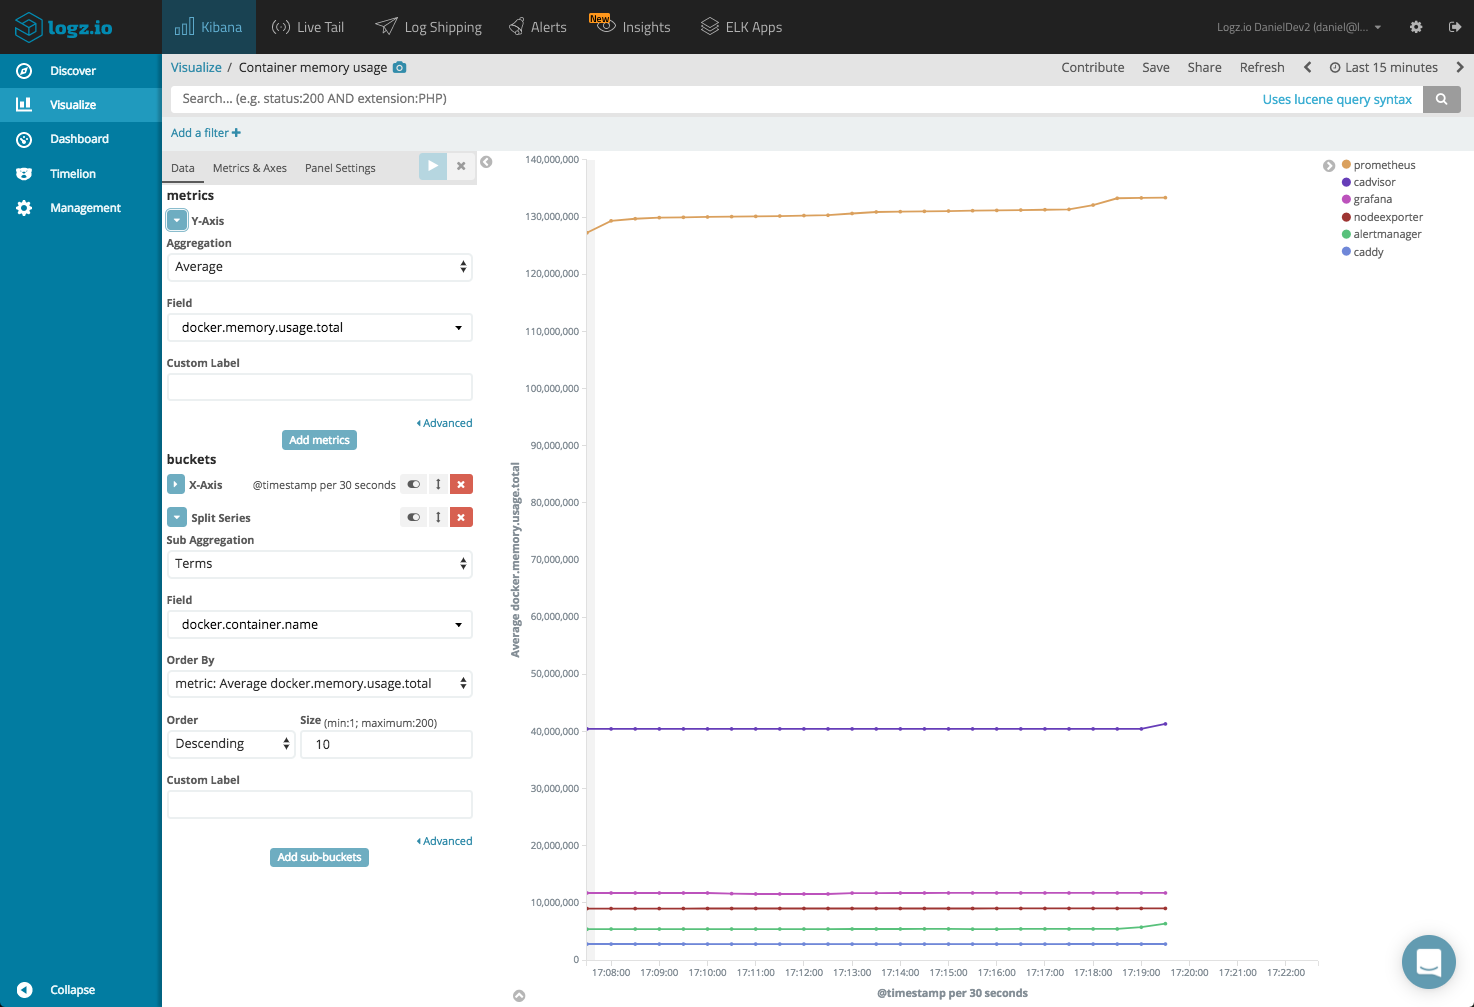
Memory usage over time
Another example is a line chart visualization that monitors memory usage per container. To do this, we will first configure our Y-Axis to show an average of the ‘docker.memory.usage.total’ field. Our X-Axis consists of a data histogram and a terms aggregation of the ‘docker.container.name’ field.
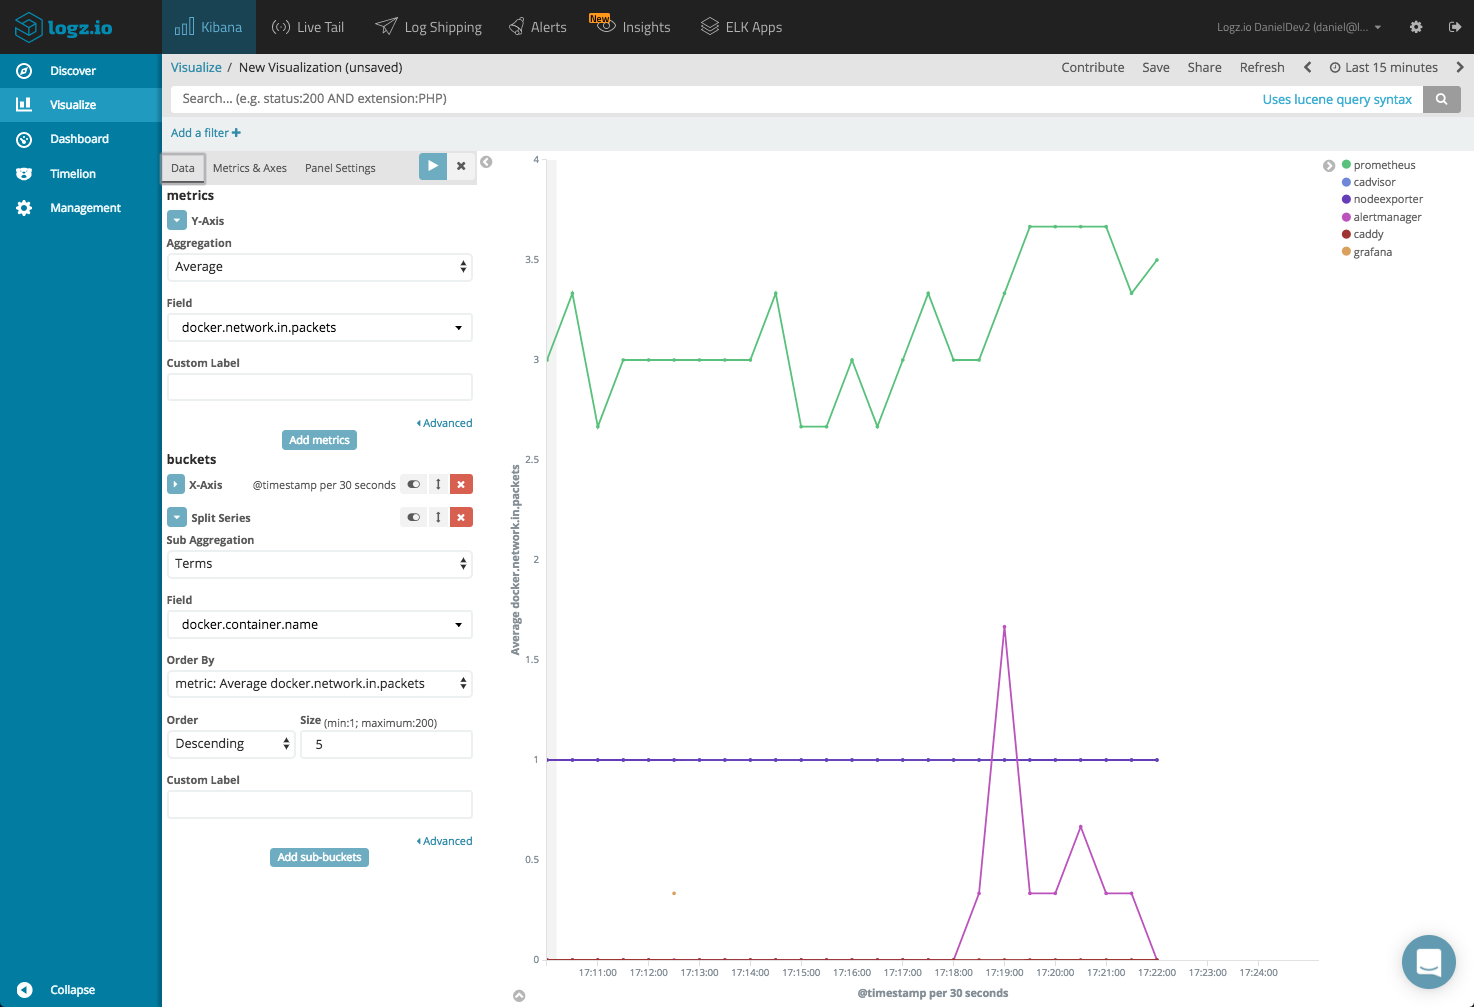
Network Packets
In a similar fashion, a line chart visualization can also give us a nice view of the incoming and outgoing packets per container. All we have to do is switch the field name in the Y-Axis configuration to ‘docker.network.in.packets’ and ‘docker.network.out.packets’.
Putting all your visualizations into a dashboard gives you a nice overview of the performance of your Docker environment.
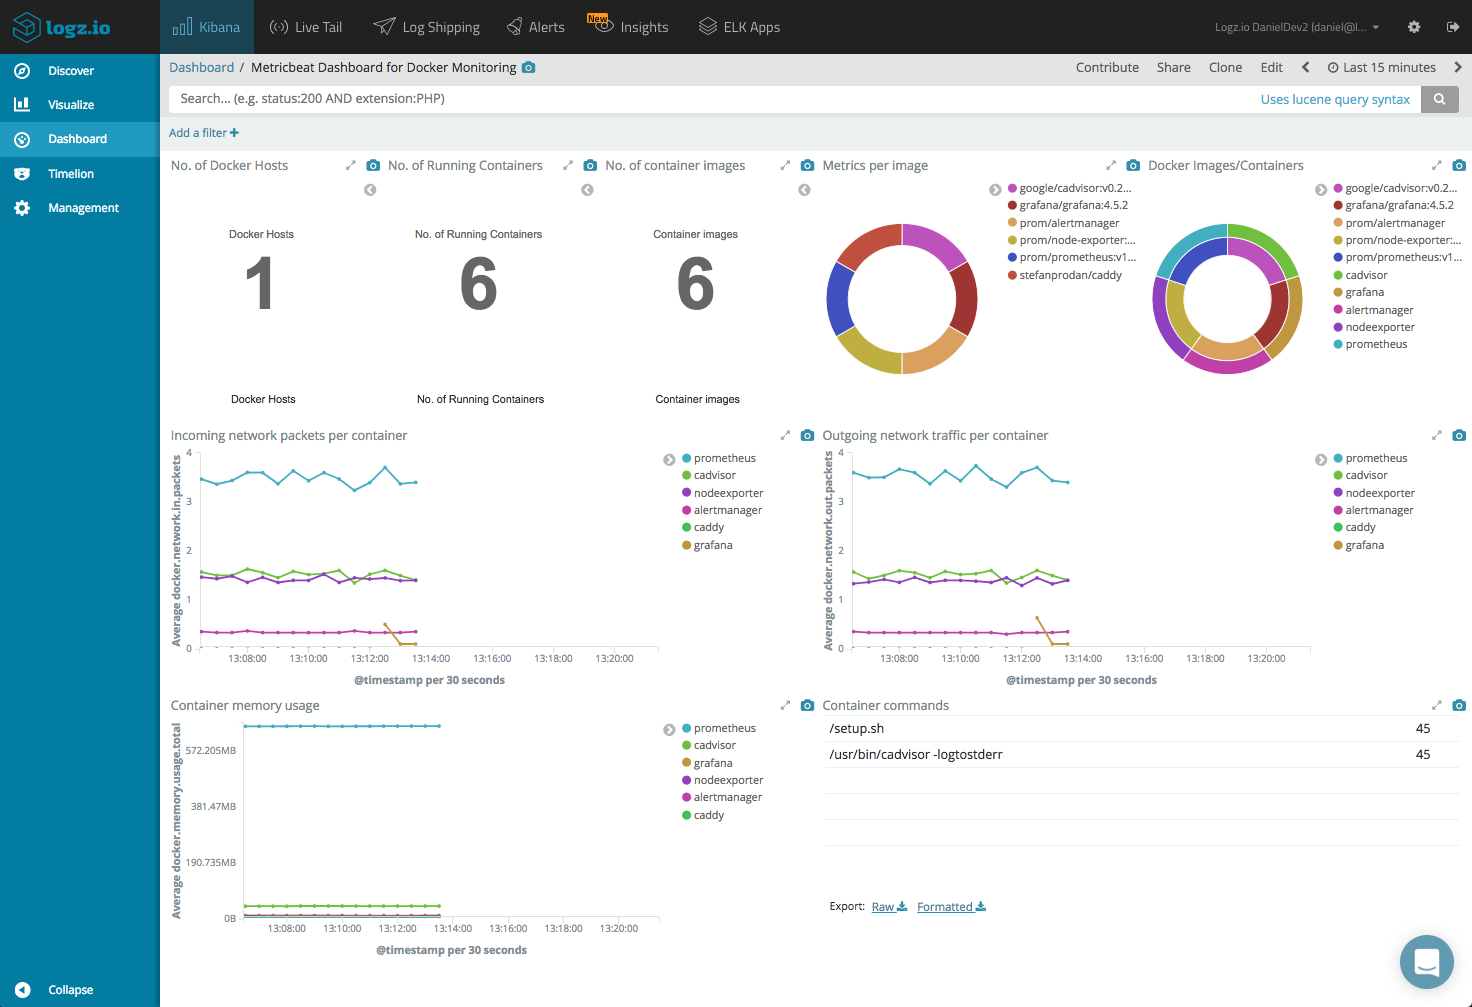
If you are using Logz.io, this dashboard is available within ELK Apps — the built-in dashboard and visualization library. To install the dashboard, open ELK Apps and search for “metricbeat”.
Endnotes
To sum things up, the combination of Metricbeat and the ELK Stack is a very easy and cost-effective method for tapping into Docker performance metrics. Deploying is straightforward and collection of the data is all done for you.
More on the subject:
One thing to keep in mind is that there are other types of data that you will want to tap into for event correlation, such as Docker daemon events and Docker logs. Metricbeat is all about metrics, so to collect these other types of data you will need a more complete solution.
The Docker log collector we created, for example, collects all three types of information so you can build a comprehensive monitoring dashboard for your Docker environment.

You Might Also Like

Instrumenting Node.js for Tracing in Jaeger

