
Using the ELK Stack for SIEM
June 20, 2018
At the heart of any SIEM system is log data. A lot of it. Whether from servers, firewalls, databases, or network routers — logs provide analysts with the raw material for gaining insight into events taking place in an IT environment.
Before this material can be turned into a resource, however, several crucial steps need to be taken. The data needs to be collected, processed, normalized, enhanced and stored. These steps, usually grouped together under the term “log management”, are a must-have component in any SIEM system.
It is no coincidence, therefore, that the ELK Stack — today the world’s most popular open source log analysis and management platform — is part and parcel of most of the open source SIEM solutions available. Taking care of the collection, parsing, storage, and analysis, ELK is part of the architecture for OSSEC Wazuh, SIEMonster, and Apache Metron.
If log management and log analysis were the only components in SIEM, the ELK Stack could be considered a valid open source solution. But when we defined what a SIEM system actually is, a long list of components was listed in addition to log management.
Thats why Logz.io built Cloud SIEM, a fully featured SIEM built around ELK technology – consisting of prebuilt rules to highlight critical security events, prebuilt dashboards to visualize the data, and prebuilt integrations with popular security products. Logz.io handles the entire data infrastructure via a SaaS platform, so you don’t have to manage it yourself.
For those who want to build and run their own SIEM using the ELK Stack, this article will try and dive deeper into the pros and cons of using the ELK Stack for SIEM, what is missing, and what is required to augment it into a fully-functional SIEM solution.
Log collection
As mentioned above, SIEM systems involve aggregating data from multiple data sources. These data sources will vary depending on your environment, but most likely you will be pulling data from your application, the infrastructure level (e.g. servers, databases), security controls (e.g. firewalls, VPN), network infrastructure (e.g. routers, DNS) and external security databases (e.g. thread feeds).
This requires aggregation capabilities which the ELK Stack is well-suited to handle. Using a combination of Beats and Logstash, you can build a logging architecture consisting of multiple data pipelines. Beats are lightweight log forwarders that can be used as agents on edge hosts to track and forward different types of data, the most common beat being Filebeat for forwarding log files. Logstash can then be used to aggregate the data from the beats, process it (see below) and forward it to the next component in the pipeline.
Because of the amount of data involved and the different data sources being tapped into, multiple Logstash instances will most likely be required to ensure a more resilient data pipeline. Not only that, a queuing mechanism will need to be deployed to make sure data bursts are handled and disconnects between the various components in the pipeline do not result in data loss. Kafka is often the tool used in this context, installed before Logstash (other tools, such as Redis and RabbitMQ, are also used).
The ELK Stack alone, therefore, will most likely not be enough as your business, and the data it generates grows. An organization looking into using ELK for SIEM must understand that additional components will need to be deployed to augment the stack.
Log processing
Collecting data and forwarding it is of course just one part of the job Logstash does in a logging pipeline. Another crucial task, and one extremely important in the context of SIEM as well, is that of processing and parsing the data.
All those data source types outlined above generate data in different formats. To be successful in the next step — that of searching the data and analyzing it — the data needs to be normalized. This means breaking down the different log messages into meaningful field names, mapping the field types correctly in Elasticsearch, and enriching specific fields where necessary.
One cannot over-exaggerate the importance of this step. Without correct parsing, your data will be meaningless as you attempt to analyze it in Kibana. Logstash is a powerful tool to have on your side for this key task. Supporting a large number of different filter plugins, Logstash can break up your logs, enrich specific fields with geographic information, for example, drop fields, add fields, and more.
Again, a logging architecture such as the one required by a SIEM system can get complicated. Specifically, configuring Logstash to process various log types will necessitate multiple Logstash configuration files and Logstash instances. Heavy processing, the result of complex filter configurations, affects Logstash performance. Monitoring Logstash pipelines is important, and monitoring API, such as the Hot Thread API for identifying Java threads with high CPU, is available for this purpose.
Logz.io SIEM obfuscates these data processing challenges by handling the entire data pipeline for you with prebuilt parsing rules for popular security technologies, like AWS Network FireWall, Palo Alto Networks, and many others.
Storage and retention
The log data collected from the different data sources needs to be stored in a data store. In the case of ELK, Elasticsearch plays that role of data indexing and storage.
Elasticsearch is one of the most popular databases today, in fact — it’s the second most downloaded open source software after the Linux kernel. This popularity stems from a variety of different reasons — it’s open source, relatively easy to set up, fast, scalable and has a huge community supporting it.
Of course, deploying an Elasticsearch cluster is just the first step. Since we are talking of large sets of data being indexed, which will most likely increase in volume over time, any Elasticsearch deployment used for SIEM needs to be extremely scalable and fault tolerant.
This requires a number of specific sub-tasks. We already mentioned using a queuing mechanism to ensure data does not get lost in case of disconnects or data bursts, but you will also need to keep eyes on key Elasticsearch performance metrics, such as indexing rate and node JVM heap and CPU. Again, there is monitoring API you can use for this purpose. Capacity planning is also important, and if you are deployed on the cloud, an auto-scaling policy will most likely be necessary to ensure you have enough resources to index.
Another consideration is retention.
For efficient after-the-fact forensics and investigation, you will need a long-term storage strategy. If you notice a large spike in traffic originating from a specific IP, for example, you will want to compare this historical data to verify whether it’s anomalous behavior. Some attacks can slowly evolve over months and as an analyst, having that historical data is key for successful detection of patterns and trends.
Needless to say, the ELK Stack does not support an out-of-the-box archiving capability so you will need to figure out an architecture for retaining data on your own. Ideally, one that will not financially cripple your organization.
Again, Logz.io handles data storage out-of-the-box via SaaS for those who do not want to manage ELK clusters themselves.
Querying
Once your data is collected, parsed, and indexed in Elasticsearch, the next step is querying the data. You can do this using Elasticsearch REST API, but most likely you will be using Kibana for this.
In Kibana, querying the data is done using Lucene syntax. For example, a common search type is field-level searches. For example, say I am looking for all log messages generated by actions performed by a certain person in the organization. Because I normalized a field called username across all the data sources, I can use this simple query:
username:”Daniel Berman”
I can use this search type with a logical statement, such as AND, OR, NOT.
username:”Daniel Berman” AND type:login AND status:failed
Again, if you want to use the ELK Stack for SIEM, you will need to leverage the parsing power of Logstash to process your data — and how well you manage to do this will affects how easy querying across the multiple data sources you’ve tapped into will be.
Dashboards
Kibana is renowned for its visualization capabilities, supporting a wide array of different visualization types, and allowing users to slice and dice their data in any way they like. You can create pie charts, graphs, geographical maps, single metrics, data tables, and more, and the results are quite effective.
Here is an example of a SIEM dashboard constructed in Kibana for an AWS environment:
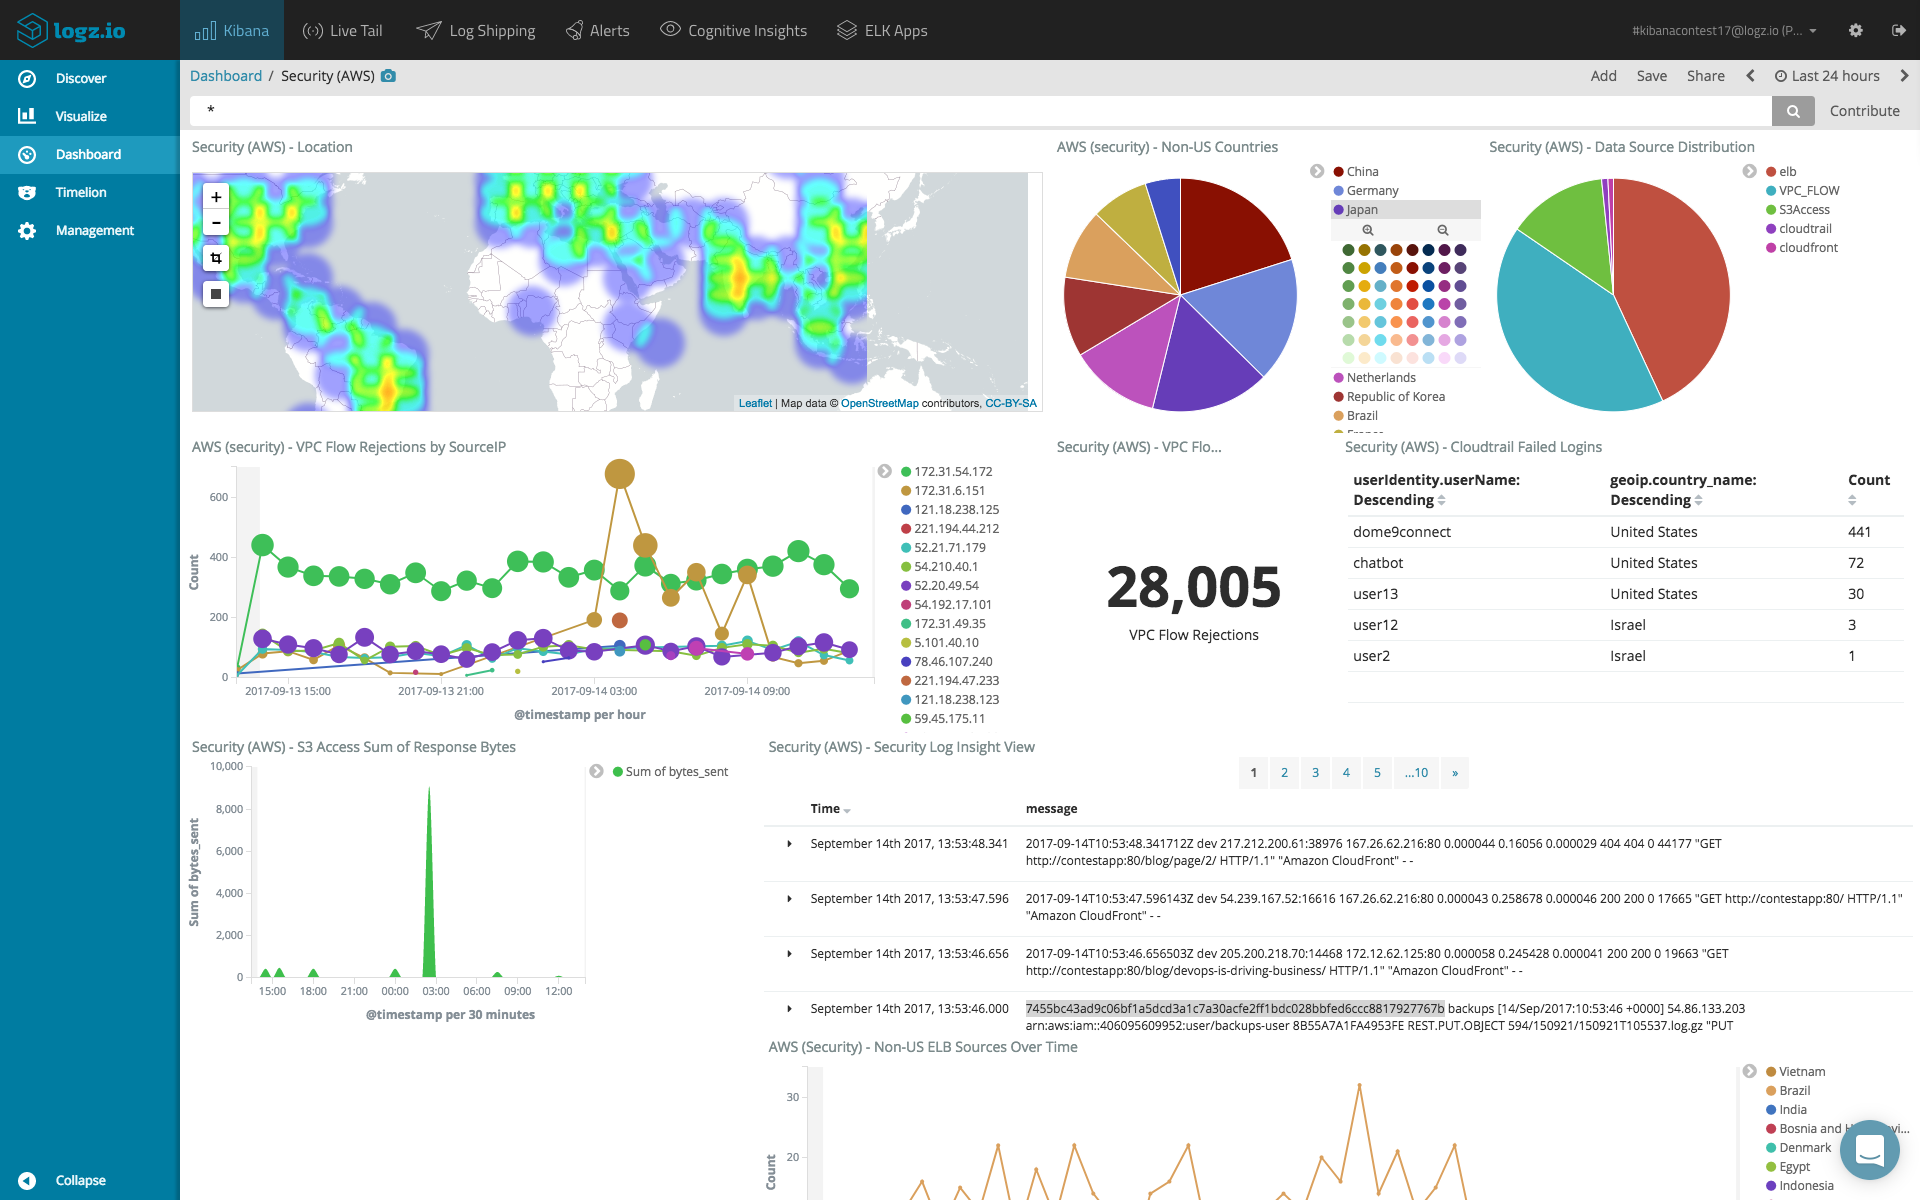
Creating dashboards in Kibana is not a straightforward task and requires intimate knowledge of your data and the different fields constructing the log messages. More so, there are specific capabilities that are missing in Kibana, such as dynamic linking within visualizations. There are workarounds, but built-in functionality would be a huge bonus.
Kibana also does not support secure sharing of objects. If you identify a security breach and want to share a dashboard or a single visualization with a colleague, the share link in Kibana is not tokenized. There are commercial add-ons you can implement on top of Kibana (X-Pack) or open source solutions that can be used.
With Logz.io, these are prebuilt. All users need to do is send there data, and monitoring dashboards will automatically populate.
Correlation
Another key ingredient in SIEM is event correlation. Event correlation, as we already defined it in a previous post, is the connection of signals coming in from the different data sources into a pattern that could be indicative of a breach in security. A correlation rule defines the specific sequence of events that forms this pattern.
For example, a rule could be created to identify when more than x amount of requests are sent from specific IP ranges and ports within a certain amount of time. Another example of a correlation rule will look for an abnormal amount of failed logins together with the creation of privileged accounts.
These correlation rules are provided by various SIEM tools or predefined for different attack scenarios. The ELK Stack, of course, does not come with built-in correlation rules, and so it is up to the analyst to use Kibana queries, based on the parsing and processing performed using Logstash, to correlate between events.
Alerts
Correlation rules mean nothing without alerts. Being alerted when a possible attack pattern is identified is a key ingredient in SIEM systems.
Continuing on from the examples above, if your system logs a large number of requests from a specific IP range, or an abnormal amount of failed logins, an alert needs to be sent off to the right person or team in the organization. Speed is of the essence — the faster a notification is sent out, the greater the chance of a successful mitigation.
The ELK Stack, in its open source form, does not ship with a built-in mechanism for alerting. To add this capability, the ELK Stack needs to be augmented with an alerting plugin or add-on. Again, X-Pack is one option. Another option is adding ElastAlert — an open source framework that can be added on top of Elasticsearch.
Incident management
Issue identified, analyst alerted. What now? How well your organization responds to the incident will determine the outcome. SIEM systems are designed to help with the next steps of the security analyst — containing the incident, escalating it if necessary, mitigating it and scanning for vulnerabilities.
The ELK Stack is great when it comes to helping the analyst identify an event but does not have much to offer for managing it. Even if an add-on for alerting is implemented on top of the stack, a way for managing the triggered alerts is required for efficient incident management. Otherwise, there is a risk of drowning in alerts and missing on important events. Automating the process of escalation and the creation of tickets is also important for efficient event handling.
Summing it up
So, can the ELK Stack be used for SIEM?
The answer to this question is simple. In its raw form, consisting of Logstash, Elasticsearch, Kibana, and Beats — the ELK Stack is NOT a SIEM solution.
Let’s sum up the key points above:
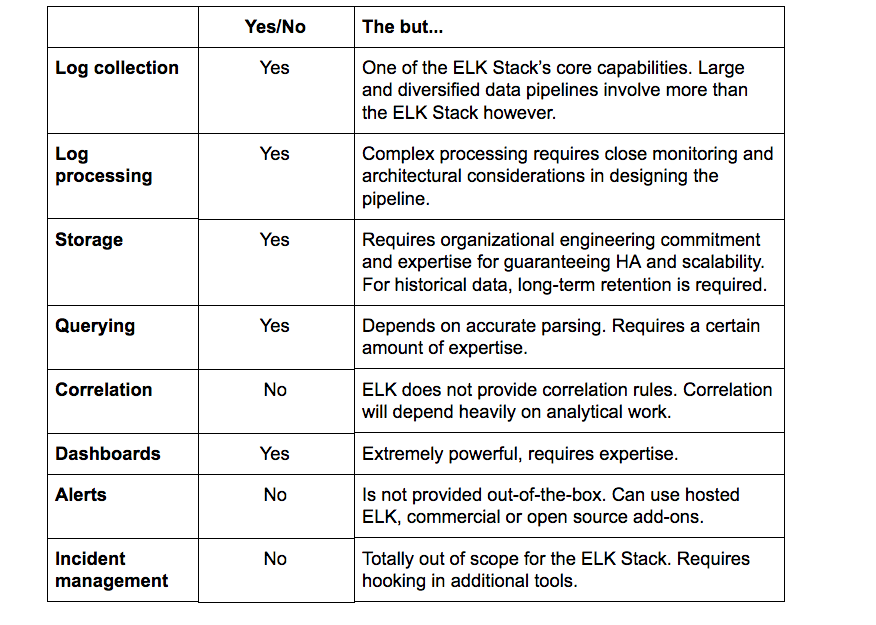
While an extremely powerful tool for centralized logging, the ELK Stack cannot be used as-is for SIEM. Missing built-in alerting capabilities, correlation rules, and mitigation features — the ELK Stack fails to complete the full toolbox required by a security analyst. Thats why Logz.io built Cloud SIEM – to transform the ELK into a fully featured SIEM ready to collect, parse, store, and monitor security events in real time.
Of course, for those who want to do it themselves, the ELK Stack can be augmented with other platforms and services. That is precisely what several of the open source SIEM solutions on the market do. But this requires a huge engineering feat by the organization. The number of resources and technical know-how required to amalgamate the ELK Stack with other add-ons and platforms, not to mention the financial cost, make the case for opting for a commercial SIEM.

You Might Also Like

Best Log Management Software for DevOps and SRE Teams in 2026: Feature and Cost Breakdown

