Puppet Server Logging with the ELK Stack – Part 2
January 16, 2018
This post the second part of a series about Puppet server logging with the ELK Stack. Part 1 explores how to configure logging in Puppet and establish a logging pipeline from Puppet into the ELK Stack.
Kibana is a great tool for analyzing your Puppet server log data, and the sky’s the limit to what you can do with the data. You can query the data using a variety of different queries (free-text, field-level, etc.) or create visualizations for monitoring the logs.
In this second part of the series, we will be reviewing some of these methods, as well as how to be more proactive about your log analysis by setting up alerts.
Querying your Puppet logs
A first step in analyzing the Puppet server data is understanding it. Start by exploring the different fields indexed by Elasticsearch. These are listed on the left side of the Discover page in Kibana.
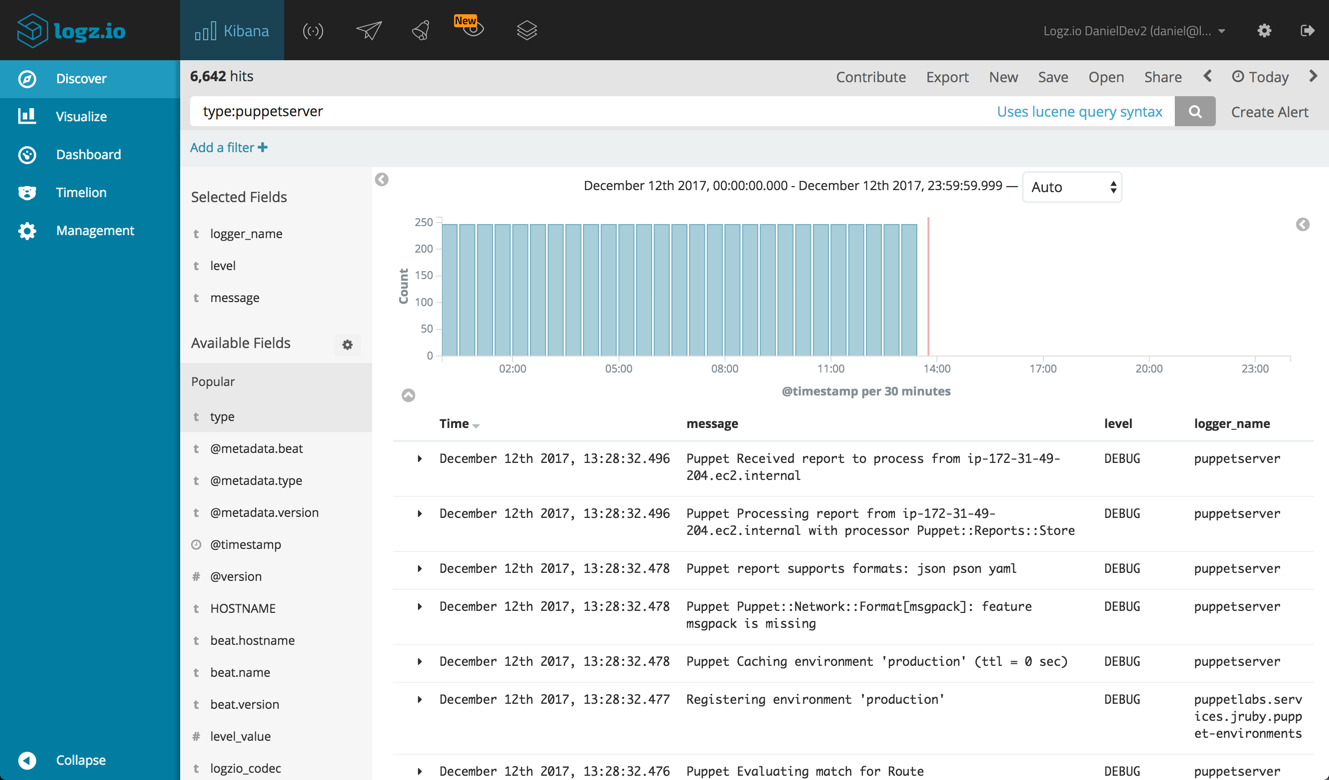
Start by filtering the logs by type. Remember, we are shipping two log files — Puppet server logs and Puppet server access logs, so differentiating between the two will help us understand the information they provide.
To see only puppet server logs, use this Kibana query:
type:puppetserver
The list of fields on the left shows the available fields for analysis of this log type. For example, add the ‘level’ and ‘logger_name’ fields to add them to the main log display area:
If we’re interested in only a specific log level, we can, for example, use this query:
type:puppetserver AND level:ERROR
To focus on the puppet-server access logs, use this query:
type:puppetserver-access
These logs contain a variety of interesting fields we can use for analysis and visualization. For example:
- bytes – the size of the request processed by your Puppet master server
- clientip – the IP of the Puppet agent sending requests
- response – the response code for requests sent to the Puppet master server
- total_service_time – the total processing time for requests sent to the Puppet master server
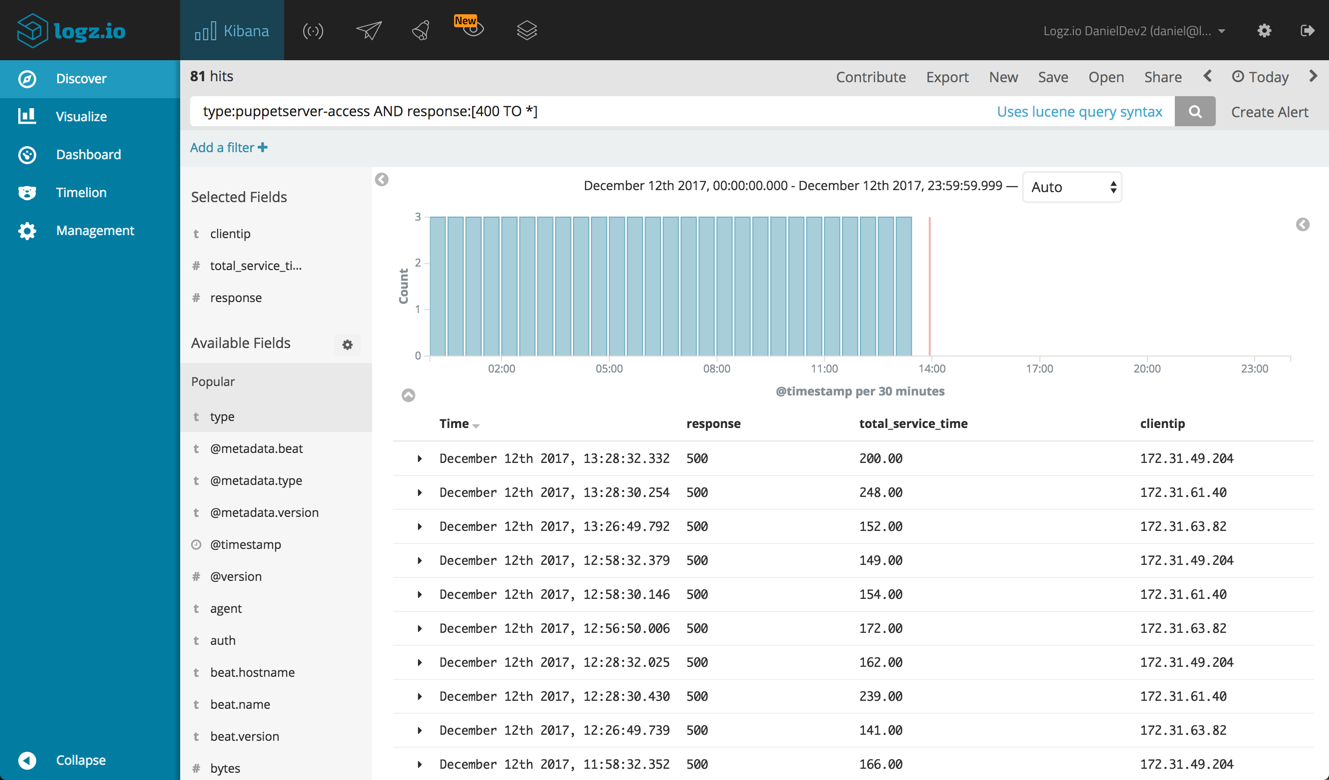
So you can search, for example, for error responses using this query:
type:puppetserver-access AND response:[400 TO *]
As before, we can add fields to the main display area to get more visibility into the data.
Visualizing the data
Kibana’s visualization capabilities make the task of monitoring the general health of our Puppet setup a relatively easy ride, allowing us slice and dice the data in any way we like.
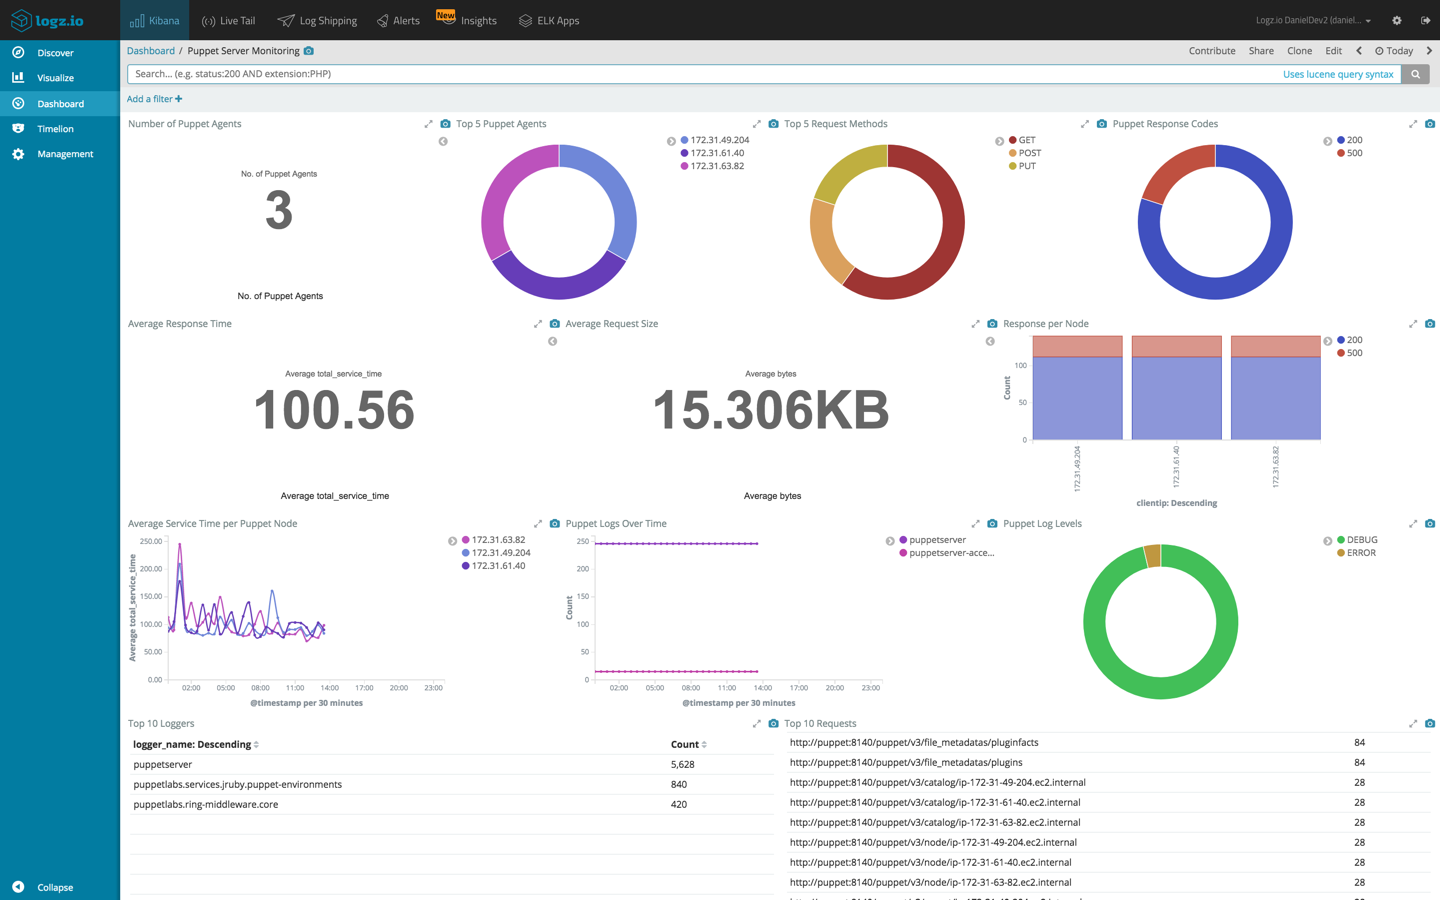
Here is a sample of what you can do with your logs using Kibana:
True, it does take awhile to understand how each Kibana visualization works, so the better you understand the data the better.
Below are some examples to help you hit the ground running.
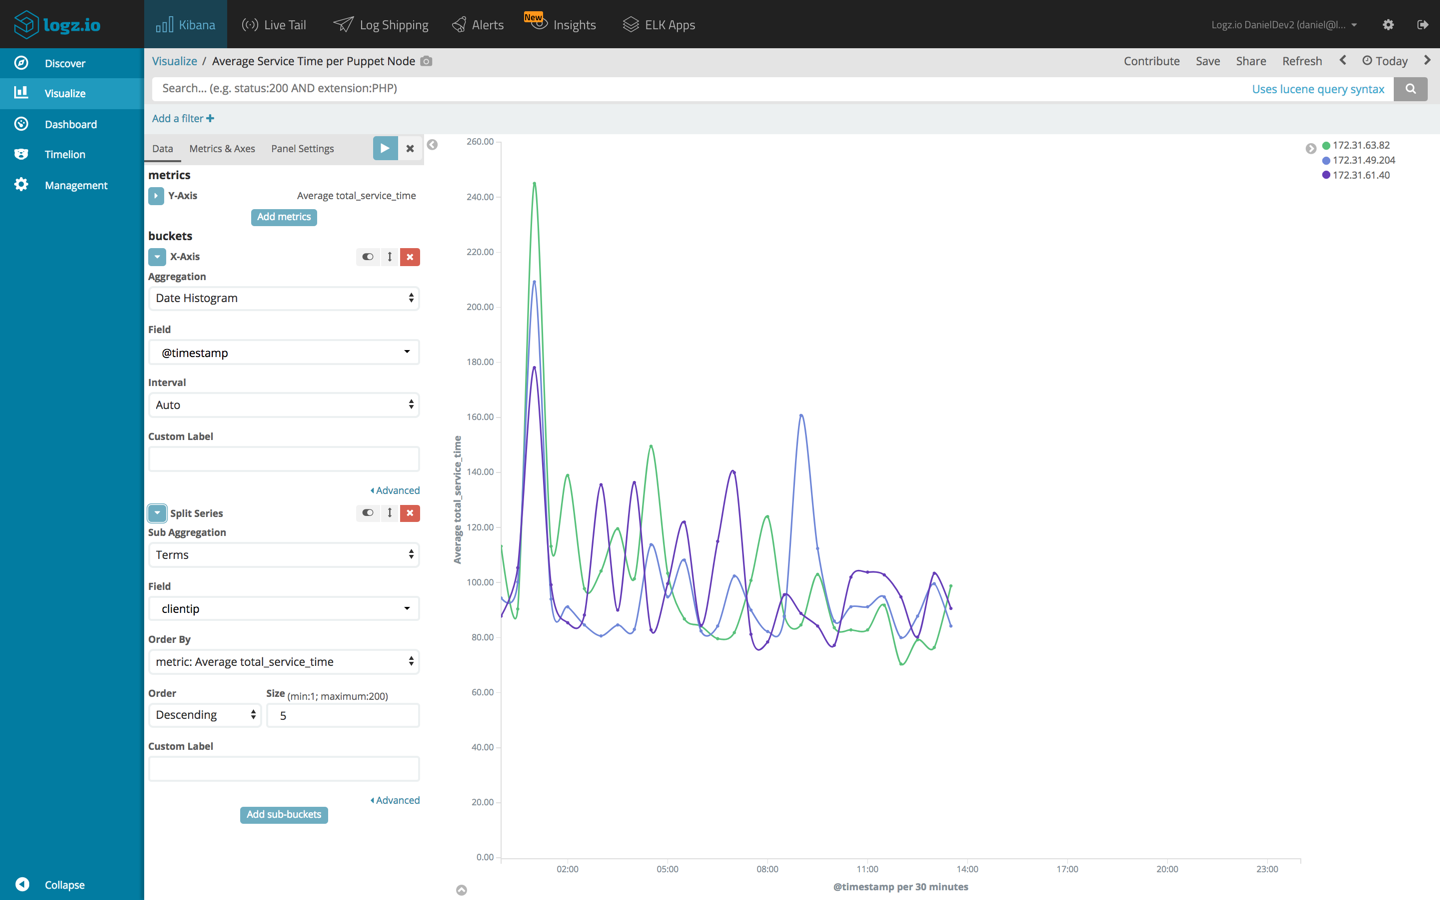
Average service time per agent
Using a Line Chart visualization, we can analyze the total service time for each Puppet agent in our deployment. To do this, we will use an average aggregation of the ‘total_service_time’ field as our Y axis, and both a date histogram and terms aggregation of the ‘clientip’ field, for our X axis.
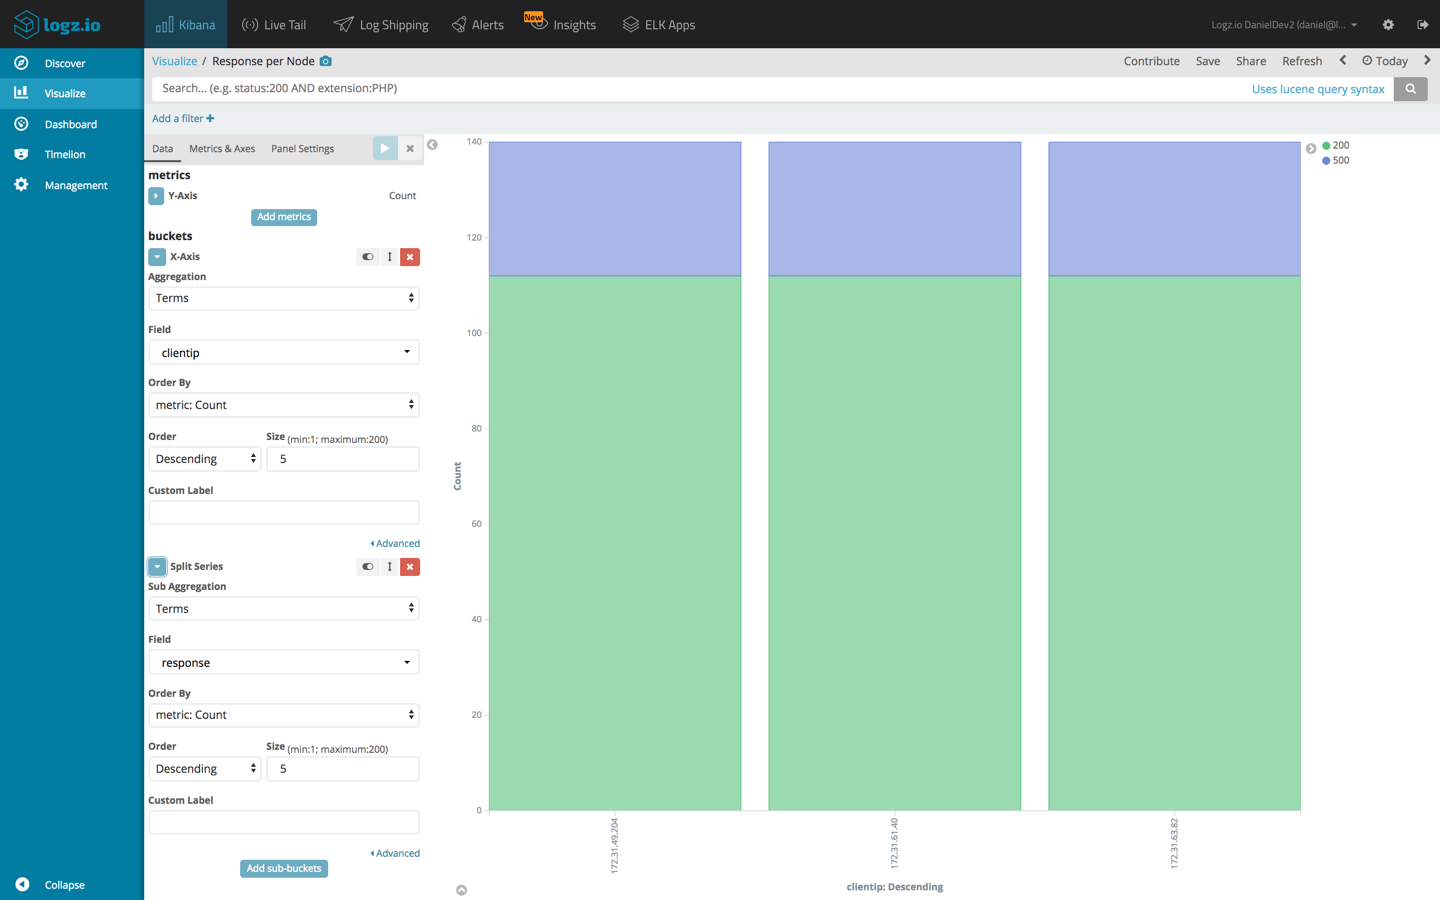
Response per agent
Another example is using a Bar Chart visualization to see a breakdown of the different response codes, per Puppet agent. To do this we will use the default count aggregation for our Y axis, and a terms aggregation of the ‘clientip’ field coupled with a terms aggregation of the ‘response’ field.
Examples abound, and I highly recommend you to do a bit of experimentation. The best Kibana dashboards are built with sweat and blood!
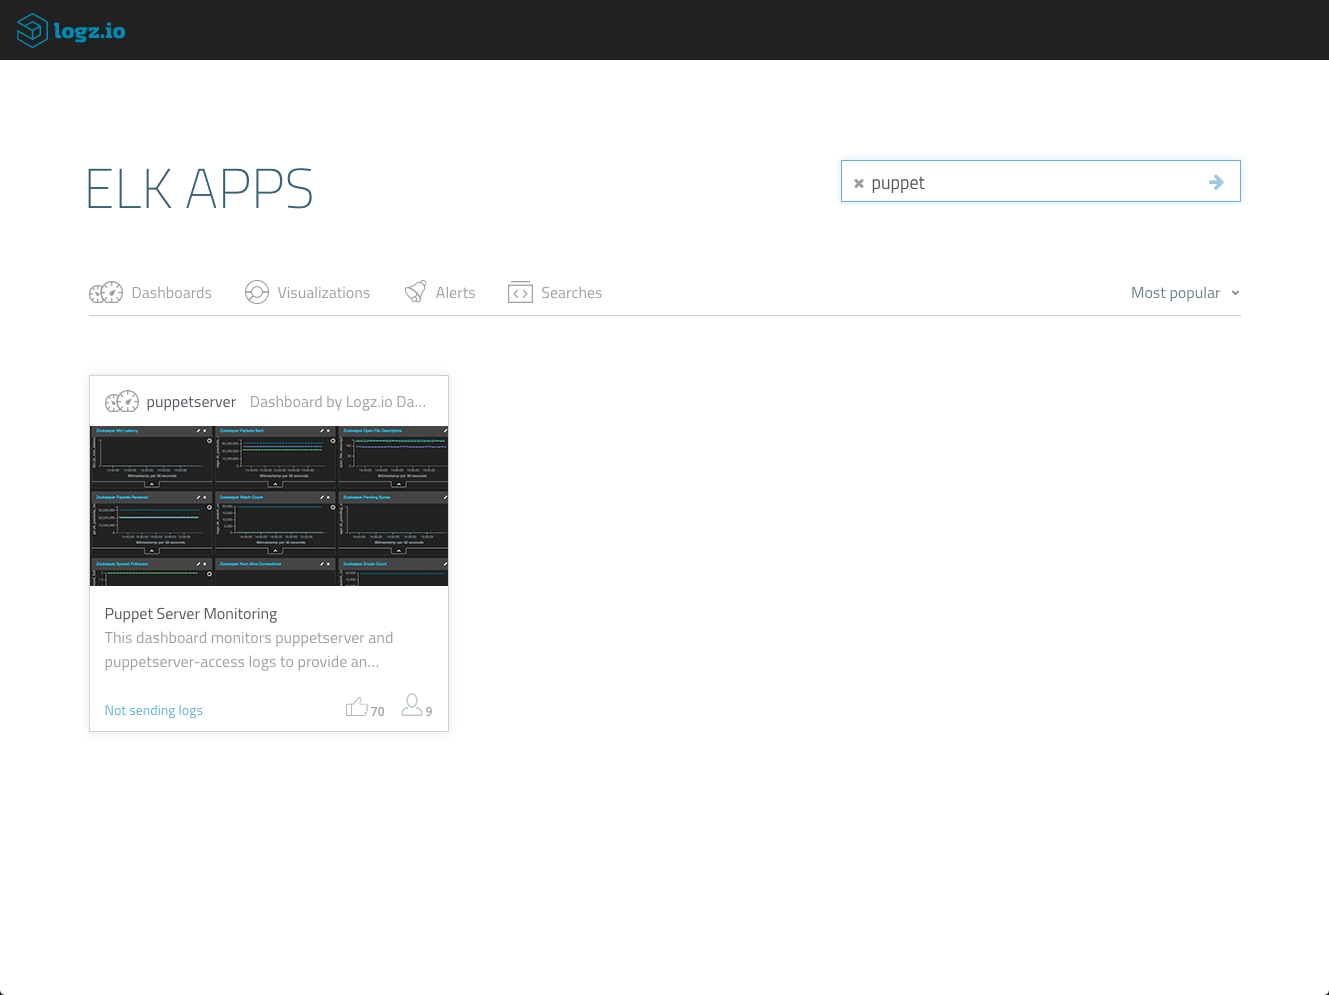
However, if you want to save some time and are using Logz.io, the dashboard above is available in ELK Apps, and can be installed in one click. Just open ELK Apps, search for ‘puppet’ and hit the Install button.
Getting alerted on Puppet logs
Traditional reactive log analysis is one thing, but if you want to be a touch more proactive, and get notified in real-time when an error has occurred with one of your Puppet configurations, you will need to set up some query-based alerts.
Now, alerting does not exist in the open source ELK Stack, unless you decide to use the X-Pack or configure your own workaround that is. This last section will show how to use Logz.io’s built in alerting mechanism to get alerted on specific Puppet errors, but the principle can be used with any other alerting mechanism you might be using.
Example 1 – Puppet server errors
One example of an alert is getting notified when a critical error occurs with your Puppet server. To create an alert for this kind of event, we can use a simple Kibana query:
type:puppetserver AND level:ERROR
Clicking the Create Alert button in the top-right corner of the Discover page in Kibana, opens up the Create a New Alert wizard where we can define how and when to get notified.
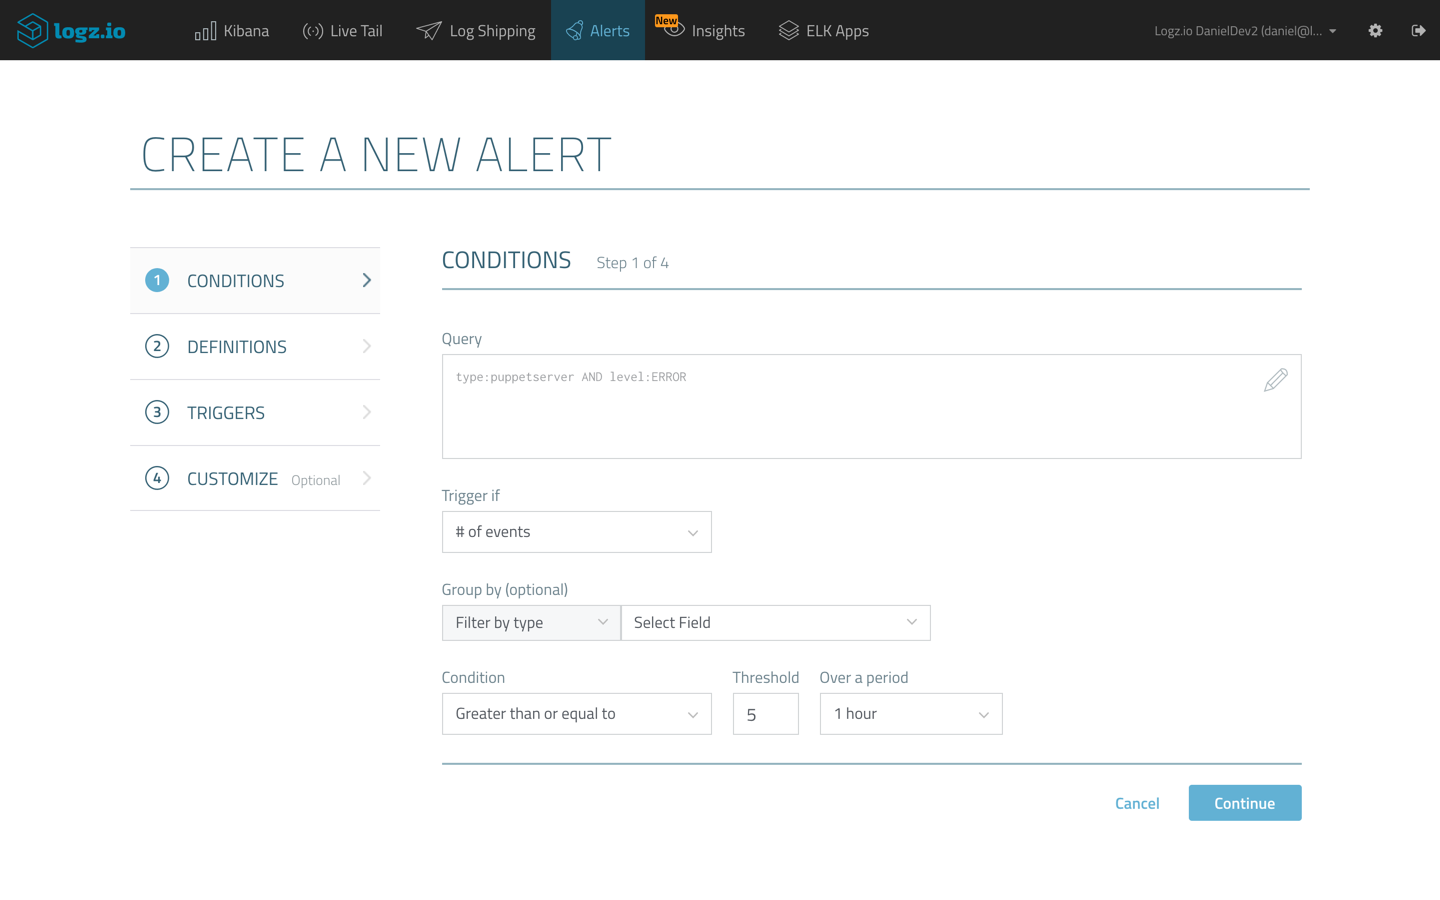
In the example here, I’m asking Logz.io to trigger an alert if this specific query is identified more than 5 times in a moving window of one hour. In the subsequent steps of the wizard, I will ask Logz.io to send me the alert via Slack, using a Slack endpoint I defined.
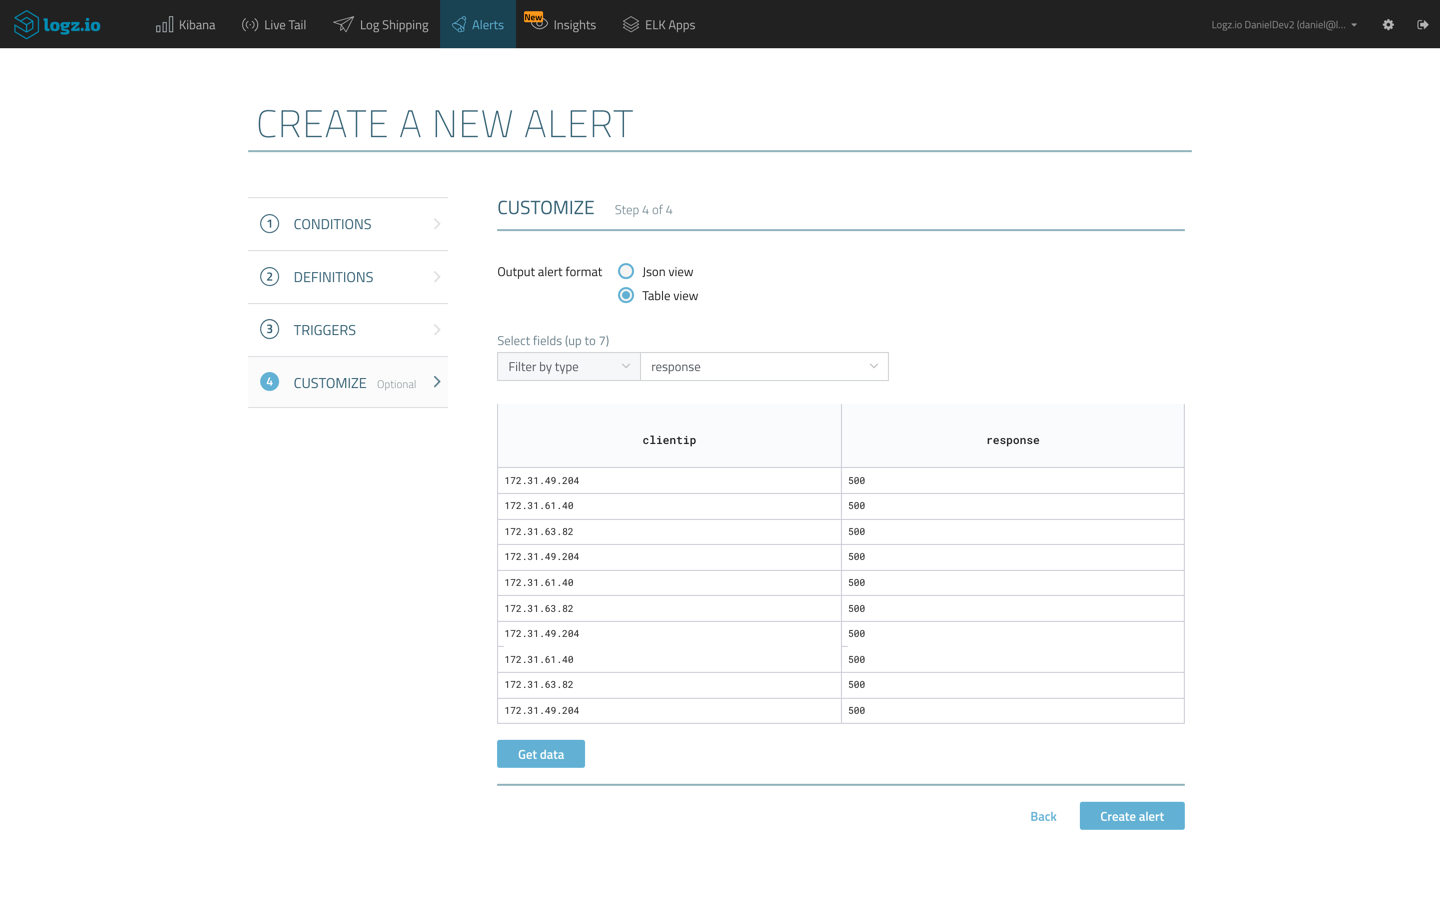
Example 2 – Puppet error responses
Another example is to get notified should Puppet HTTP traffic report an abnormal amount of response errors. In this case we can use this query as the base for the alert:
type:puppetserver-access AND response:[400 TO *]
Again, we can configure the threshold for triggering the alert. An interesting option here is to customize the format of the alert so we get an alert that is more readable and user friendly. On the last step of the wizard, we can decide to build the alert as a table, and decide what fields we want the table to list:
Using the same Slack endpoint to receive the alert, the end result of this configuration looks like this:
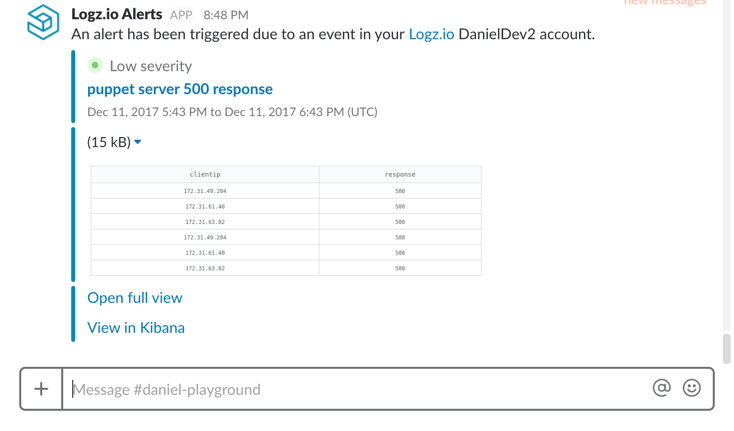
We can use the data provided in the two logs we’re shipping to get alerted on anomalous behavior, and as with visualizations, it’s important we understand the information provided in the logs so as not to create unnecessary operational noise.
Endnotes
Puppet deployments generate a large amount of logs. If you’re using Puppet Enterprise, you will have access to an even larger amount of log types. This blog series focused on only two log types, but the benefits of hooking these logs up with a centralized logging system are obvious.More on the subject:
Centralized management, analysis, visualization (and alerting if you have that configured) are all must-haves for effectively logging and monitoring a Puppet deployment. Puppet’s logging features make it relatively easy to ship logs, in JSON, into the ELK Stack to reap these benefits.
Read part 1 to learn how to configure logging in Puppet and establish a logging pipeline.

You Might Also Like

The Definitive Guide to AWS Log Analytics Using ELK