
Installing the ELK Stack on Docker
February 8, 2018
The ELK Stack (Elasticsearch, Logstash and Kibana) can be installed on a variety of different operating systems and in various different setups. While the most common installation setup is Linux and other Unix-based systems, a less-discussed scenario is using Docker.
One of the reasons for this could be a contradiction between what is required from a data pipeline architecture — persistence, robustness, security — and the ephemeral and distributed nature of Docker. Having said that, and as demonstrated in the instructions below — Docker can be an extremely easy way to set up the stack.
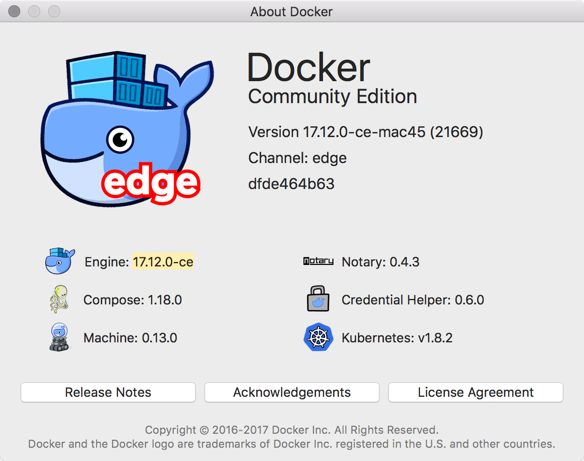
Just a few words on my environment before we begin — I’m using a recent version of Docker for Mac.
Running our Dockerized ELK
There are various ways to install the stack with Docker. You can pull Elastic’s individual images and run the containers separately or use Docker Compose to build the stack from a variety of available images on the Docker Hub.
For this tutorial, I am using a Dockerized ELK Stack that results in: three Docker containers running in parallel, for Elasticsearch, Logstash and Kibana, port forwarding set up, and a data volume for persisting Elasticsearch data.
To clone the repository:
git clone https://github.com/deviantony/docker-elk.git

remote: Counting objects: 1112, done.
remote: Total 1112 (delta 0), reused 0 (delta 0), pack-reused 1112
Receiving objects: 100% (1112/1112), 234.87 KiB | 84.00 KiB/s, done.
Resolving deltas: 100% (414/414), done.
Checking connectivity... done.
You can tweak the docker-compose.yml file or the Logstash configuration file if you like before running the stack, but for the initial testing, the default settings should suffice.
To run the stack, simply use:
cd /docker-elk
docker-compose up -d

Verifying the installation
It might take a while before the entire stack is pulled, built and initialized. After a few minutes, you can begin to verify that everything is running as expected.
Start with listing your containers:
docker ps

CONTAINER ID        IMAGE                             COMMAND                  CREATED             STATUS              PORTS                                            NAMES
a1a00714081a        dockerelk_kibana                  "/bin/bash /usr/loca…"   54 seconds ago      Up 53 seconds       0.0.0.0:5601->5601/tcp                           dockerelk_kibana_1
91ca160f606f        dockerelk_logstash                "/usr/local/bin/dock…"   54 seconds ago      Up 53 seconds       5044/tcp, 0.0.0.0:5000->5000/tcp, 9600/tcp       dockerelk_logstash_1
de7e3368aa0c        dockerelk_elasticsearch           "/usr/local/bin/dock…"   55 seconds ago      Up 54 seconds       0.0.0.0:9200->9200/tcp, 0.0.0.0:9300->9300/tcp   dockerelk_elasticsearch_1
You’ll notice that ports on my localhost have been mapped to the default ports used by Elasticsearch (9200/9300), Kibana (5601) and Logstash (5000/5044).
Everything is already pre-configured with a privileged username and password:
- user: elastic
- password: changeme
You can now query Elasticsearch using:
curl http://localhost:9200/_security/_authenticate
{
  "name" : "VO32TCU",
  "cluster_name" : "docker-cluster",
  "cluster_uuid" : "pFgIXMErShCm1R1cd3JgTg",
  "version" : {
    "number" : "6.1.0",
    "build_hash" : "c0c1ba0",
    "build_date" : "2017-12-12T12:32:54.550Z",
    "build_snapshot" : false,
    "lucene_version" : "7.1.0",
    "minimum_wire_compatibility_version" : "5.6.0",
    "minimum_index_compatibility_version" : "5.0.0"
  },
  "tagline" : "You Know, for Search"
}
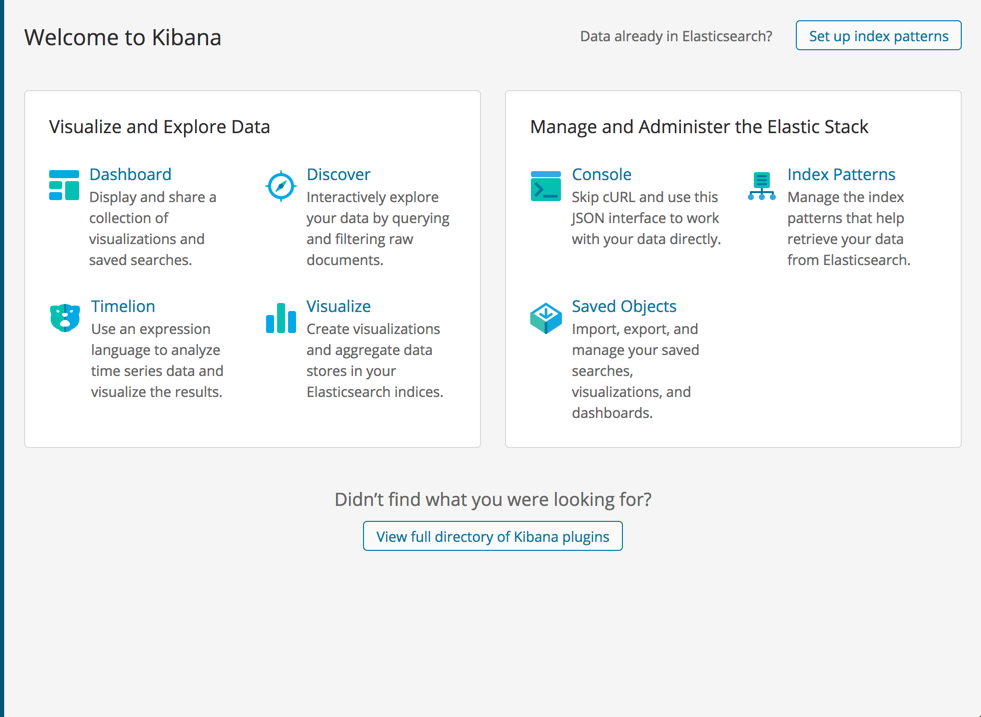
And finally, access Kibana by entering: http://localhost:5601 in your browser.
Shipping data into the Dockerized ELK Stack
Our next step is to forward some data into the stack. By default, the stack will be running Logstash with the default Logstash configuration file. You can configure that file to suit your purposes and ship any type of data into your Dockerized ELK and then restart the container.More on the subject:
Alternatively, you could install Filebeat — either on your host machine or as a container and have Filebeat forward logs into the stack. I highly recommend reading up on using Filebeat on the project’s documentation site.
I am going to install Metricbeat and have it ship data directly to our Dockerized Elasticsearch container (the instructions below show the process for Mac).
First, I will download and install Metricbeat:
curl -L -O
https://artifacts.elastic.co/downloads/beats/metricbeat/metricbeat-6.1
.2-darwin-x86_64.tar.gz

tar xzvf metricbeat-6.1.2-darwin-x86_64.tar.gz
Next, I’m going to configure the metricbeat.yml file to collect metrics on my operating system and ship them to the Elasticsearch container:
cd metricbeat-6.1.2-darwin-x86_64
sudo vim metricbeat.yml
The configurations:
metricbeat.modules:
- module: system
  metricsets:
    - cpu
    - filesystem
    - memory
    - network
    - process
  enabled: true
  period: 10s
  processes: ['.*']
  cpu_ticks: false

fields:
  env: dev

output.elasticsearch:
  # Array of hosts to connect to.
  hosts: ["localhost:9200"]
Last but not least, to start Metricbeat (again, on Mac only):
sudo chown root metricbeat.yml
sudo chown root modules.d/system.yml
sudo ./metricbeat -e -c metricbeat.yml -d "publish"
After a second or two, you will see a Metricbeat index created in Elasticsearch, and it’s pattern identified in Kibana.
curl -XGET 'localhost:9200/_cat/indices?v&pretty'

health status index                       uuid                   pri rep docs.count docs.deleted store.size pri.store.size
yellow open   .kibana                     XPHh2YDCSKKyz7PtmHyrMw   1   1          2            1       67kb           67kb
yellow open   metricbeat-6.1.2-2018.01.25 T_8jrMFoRYqL3IpZk1zU4Q   1   1      15865            0      3.4mb          3.4mb

Define the index pattern, and on the next step select the @timestamp field as your Time Filter.

Creating the index pattern, you will now be able to analyze your data on the Kibana Discover page.

Endnotes
For a sandbox environment used for development and testing, Docker is one of the easiest and most efficient ways to set up the stack. Perhaps surprisingly, ELK is being increasingly used on Docker for production environments as well, as reflected in this survey I conducted a while ago:
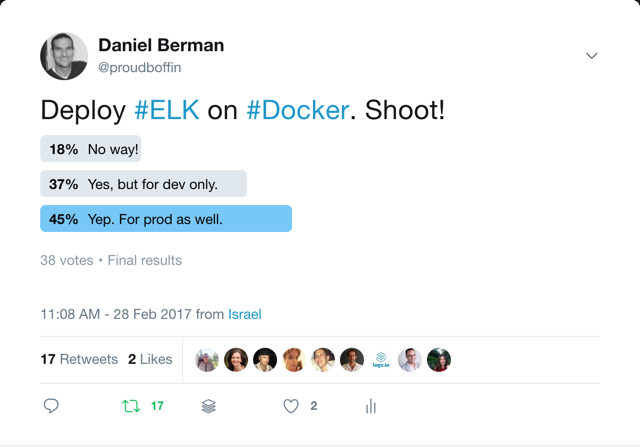
Of course, a production ELK stack entails a whole set of different considerations that involve cluster setups, resource configurations, and various other architectural elements.
You Might Also Like
Zero code tracing: Kubernetes observability with Logz.io and eBPF

