
Logging in a Serverless Architecture
August 30, 2017

In one of our previous articles, we wrote about NASA handling a communication problem with one of their spacecrafts that was sent to Mars for climate and atmospheric research and exploring the planet’s surface. Eventually, the Mars climate orbiter was declared lost, but in the 24 hours prior to announcing this, NASA engineers were trying to find a way to communicate with an object that was no longer there.
Working in a serverless architecture, where functions and their containers are turned on and off in a matter of seconds and, unless captured, their state, status, and information are irretrievably lost, is somewhat similar.
Serverless architecture pushes developers to write fast, independent, and executable code that is triggered by events and exists inside a temporary container. But what happens when one of these functions doesn’t work as expected? How can DevOps verify that events are activating the right functions?
In serverless applications, where services are small and their functionality precise, root cause analysis becomes much more complicated. When trying to track down the source of a fault, neither the services involved nor any of the integration points actually exist. When more than one function takes part in the operation, the investigation turns into a hunt in the dark.
To understand how the application behaves and what happens when it fails, logging is even more crucial for serverless applications.
What Makes Logging Serverless a Pain?
The necessity of logs is clear to developers, but there are some unique considerations that need to be taken into account when logging in a serverless architecture.
It’s obvious that when several functions fail and don’t deliver the requested functionality, the logs must contain a unified identifier for the transaction, so that when the different function logs are analyzed, the transaction can be easily detected and aggregated. In a serverless application, the same logs must contain more information about all the functions involved in the operation, including their response values and running times.
If a function crashes during operation, and its instance and container do not exist after the crash, then logging the crash is critical for understanding what went wrong. But how do we log a crash and get logs from a non-functioning function? This requires some creative thinking.
An interesting solution is to create a function that will be triggered when another function crashes, or to basically link functions. The linked function, charged with collecting all the information from the container, including all the records prior to the crash, is triggered by an event generated by the infrastructure, and can be configured to trigger another instance of the crashed function. In this way, logs enable self-maintenance by serverless applications by allowing them to respond to, and recover from, failures without manual intervention.
Serverless logs have other vital roles in application inspection. When cloud applications are attacked by malicious software or hackers, it’s quite easy to inspect services load or to identify attempts at service misuse. In serverless, where service execution is brief and automatic scaling is the goal, identifying and coping with these activities becomes a real challenge. Well-planned and professionally executed logging, together with the right analysis tool, can identify the type of attack while it is ongoing, indicate which functions are being targeted, and facilitate appropriate protective operations.
Serverless architecture introduces another problem that puts the software in a very problematic place. It’s stateless. Functions, sometimes existing for merely a few seconds, cannot preserve the state of their container and subsequent calls to the same function will not have access to data from previous runs. There are different solutions to this issue, some of which require integration with external tools or the implementation of a specially designed serverless framework.
But logs can solve this problem quite easily. Function logs—copied to a central location—can behave as storage, granting functions access to earlier results that would otherwise have been lost. Functions can start evaluating application state, and can make decisions based on previous events, not just on the current application status.
So, How Do I Log in a Serverless Environment?
Usually, application service logs are written to their container’s local disk. When a cloud-based application grows and scales, accessing, managing, and analyzing these logs can get really complicated. Searching for a particular error across hundreds of log files on hundreds of servers is difficult without the right tools.
It is customary to have a centralized logging solution based on file replication or syslog technologies. In serverless, logs MUST be located on a central server so that their data can be preserved and analyzed after the function and container turn off.
In the case of AWS Lambda, function logs can be collected and analyzed using the ELK Stack as a centralized log management solution. The ELK Stack (Elasticsearch, Logstash and Kibana) gives DevOps teams the ability to collect, store, and analyze logs, and to construct a view, or a dashboard, highlighting important information that helps inform decisions regarding the implementation and functionality of the functions.
Widely used today, the stack’s three components are a part of many IT organizations, supplying a clear view of application status and helping to direct root cause analysis efforts to the relevant failure points.
At the end of 2015, AWS introduced Kinesis Firehose, a solution for data collection and streaming which allows users to collect the data from all logs across the application and stream them to Amazon’s S3 or Redshift.
Elasticsearch indexes and analyzes the raw data, allowing users to query any information believed to be crucial for the business. Kibana creates visual representations of the information according to predefined criteria, so different teams in the organization can get the particular view they require of the production environment.
A basic EKK (Elasticsearch, Kibana, Kinesis) stack in a serverless architecture would look like this:
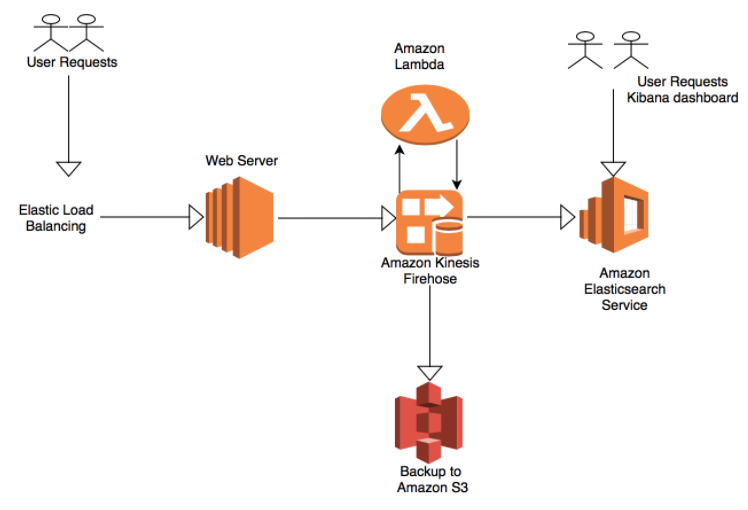
Alternatively, if you do not want to manage Elasticsearch and Kibana on AWS, Kinesis Firehose can be combined with a hosted ELK solution such as Logz.io by sending the function logs streamed by Kinesis Firehose to S3 into Logz.io. This solution provides you with a fully managed service in which you do not need to worry about management tasks such as scaling Elasticsearch, parsing the function logs or securing Kibana.
Conclusion
Despite reducing maintenance effort, scalability planning, and server management costs, serverless applications introduced a new challenge for R&D and DevOps when investigating system faults and trying to correctly identify the reasons for failure. Logs, showing the functionality of—and relationships between—functions and their containers, must be aggregated using designated tools, so that all the information can flow from production to the right R&D team, and assist the team with its maintenance tasks.
More on the subject:
Serverless logs must be collected and streamed to the analysis tool as part of the function execution so that data is not lost when the container is switched off. As serverless encourages fast execution, log collection tasks must also take place quickly. Several serverless open-source frameworks (mainly AWS Lambda but also Azure Functions) understand this complexity, and come with a solution for log collection. Having said that, none of these solutions is straightforward, and logging serverless is still a challenge that needs to be reckoned with.

You Might Also Like

Driving Innovation Aligned with the AWS Security Competency Re-launch

