
Installing the EFK Stack with Kubernetes with GKE
April 2, 2019
The ELK Stack (Elasticsearch, Logstash and Kibana) is the weapon of choice for many Kubernetes users looking for an easy and effective way to gain insight into their clusters, pods and containers. The “L” in “ELK” has gradually changed to an “F” reflecting the preference to use Fluentd instead of Logstash and making the “EFK Stack” a more accurate acronym for what has become the de-facto standard for Kubernetes-native logging.More on the subject:
While Elasticsearch, Logstash/Fluentd and Kibana can be installed using a variety of different methods, using Kubernetes is becoming more and more popular. The same reasons you’d use Kubernetes to deploy your application — for automanaging and orchestrating the underlying containers — apply here as well, and there are a lot of examples and resources online to make the process easier.
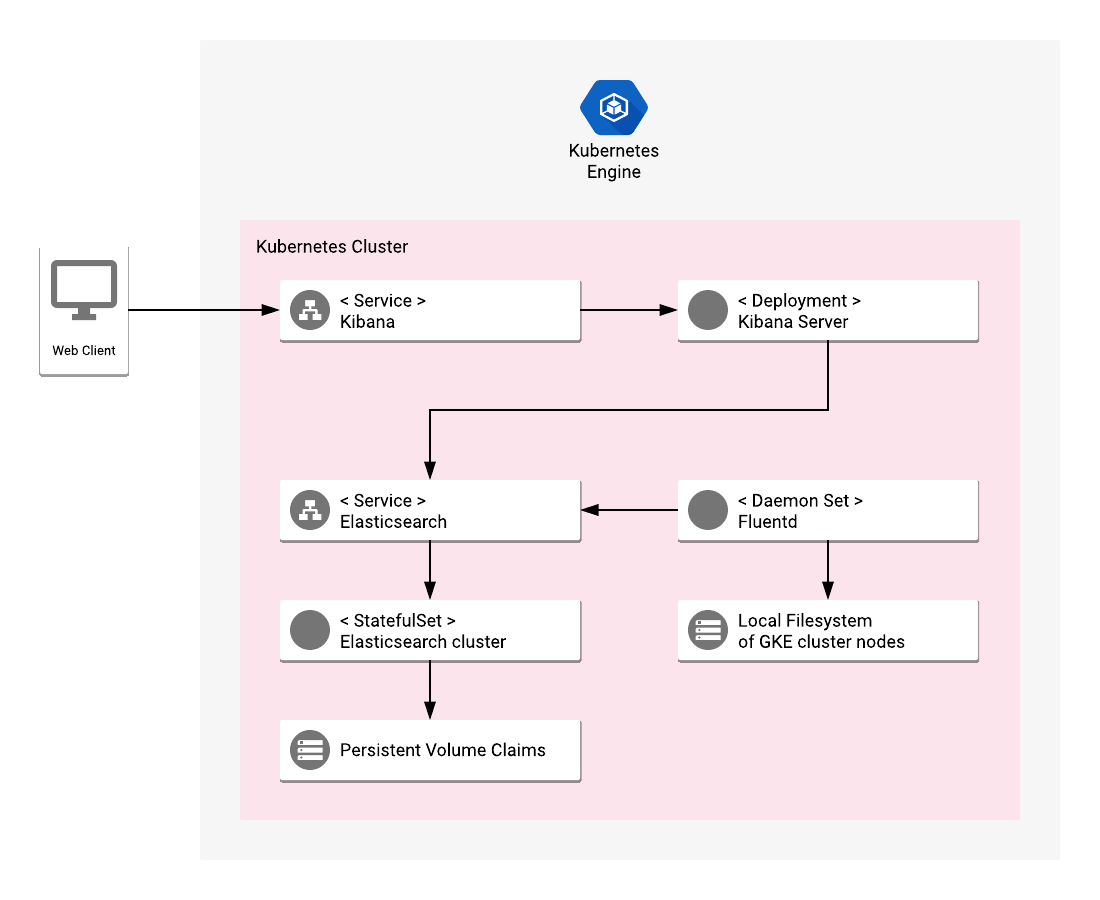
In this article, I’ll be taking a look at one of these resources — a relatively new app available in GKE’s app marketplace called, rather succinctly, “Elastic GKE Logging”. As the name implies, this app is a turnkey solution for deploying a fully functioning logging solution for Kubernetes comprised of Elasticsearch, Kibana and Fluentd.
As described on the GitHub page, the app deploys an Elasticsearch StatefulSet for the Elasticsearch cluster with a configurable number of replicas, a stateless Kibana deployment and a fluentd DaemonSet that includes predefined configurations for shipping different logs.
Step 1: Preparing your GKE environment
Before we can proceed with deploying the GKE Logging app from the marketplace, there are some basic steps to take to prepare the ground.
If you’re new to Google Cloud Platform (GCP) and haven’t created a project yet, this is the right time to do so. Projects are the basis for creating, enabling, and using GCP services, including GKE’s services.
Once you’ve created your GCP project, you will need to create a Kubernetes cluster on GKE. Just follow the steps as outlined in this article. When creating your cluster, I recommend you choose a node size with 4, 8, or 16 CPUs and a cluster size of at least 2. Of course, you can always start with a small setup and then scale up later.
To connect to my GKE cluster with kubectl, I use GCP’s CloudShell service. You can, of course, do the same from your own local terminal in which case you will need to download and set up gcloud.
Next, I find it a good best practice to use dedicated namespaces to separate between different deployments in my Kubernetes cluster. In this case, I’m going to create a new namespace for all our logging infrastructure:
Create a new object file:
sudo vim kube-logging-ns.yaml
Paste the following namespace configuration:
kind: Namespace
apiVersion: v1
metadata:
  name: kube-logging
Save the file, and create the namespace with:
kubectl create -f kube-logging-ns.yaml
Confirm that the namespace was created:
kubectl get namespaces

NAME           STATUS    AGE
default        Active    1d
kube-logging   Active    1m
kube-public    Active    1d
kube-system    Active    1d
Step 2: Deploying the EFK Stack
We’re now ready to deploy our EFK-based logging solution using the Elastic GKE Logging app.
In the GCP console, open the marketplace and search for “Elastic GKE Logging”. You will see only one choice — select it to see more information on the app.
Hit the Configure button. You’ll now be presented with a short list of configuration options to customize the deployment process.
- Cluster – In case you have multiple Kubernetes clusters, select the relevant one for deploying the EFK Stack. In my case, I only have on running in my project so it’s selected by default.
- Namespace – For your namespace, be sure to select the kube-logging namespace you created in the previous step.
- App instance name – You can play around with the name for the deployment or simply go with the provided name.
- Elasticsearch replicas – The default number of replicas for the Elasticsearch ReplicaSet is 2 but for larger environments and production loads I would change this to a higher number.
- Fluentd Service Account – You can leave the default selection for the fluentd service account.
Click the Deploy button when ready.
GKE will deploy all the components in the app within the namespace and the cluster you defined and within a few minutes will present you with a summary of your deployment.
Step 3: Reviewing the deployment
Before we take a look at our Kubernetes logs, let’s take a look at some of the objects created as part of the deployment.
First, the deployment itself:
kubectl get deployment --namespace kube-logging
We can take a closer look at the deployment configuration with:
kubectl describe deployment elastic-gke-logging-kibana --namespace kube-logging

Name:                   elastic-gke-logging-kibana
Namespace:              kube-logging
CreationTimestamp:      Sun, 24 Mar 2019 13:10:09 +0200
Labels:                 app.kubernetes.io/component=kibana-server
                        app.kubernetes.io/name=elastic-gke-logging
Annotations:            deployment.kubernetes.io/revision=2
                        kubectl.kubernetes.io/last-applied-configuration={"apiVersion":"apps/v1beta2","kind":"Deployment","metadata":{"annotations":{},"labels":{"app.kubernetes.io/component":"kibana-server","app.kubernetes.i...
Selector:               app.kubernetes.io/component=kibana-server,app.kubernetes.io/name=elastic-gke-logging
Replicas:               1 desired | 1 updated | 1 total | 1 available | 0 unavailable
StrategyType:           RollingUpdate
MinReadySeconds:        0
RollingUpdateStrategy:  25% max unavailable, 25% max surge
Pod Template:
  Labels:  app.kubernetes.io/component=kibana-server
           app.kubernetes.io/name=elastic-gke-logging
  Containers:
   kibana:
    Image:      gcr.io/cloud-marketplace/google/elastic-gke-logging/kibana@sha256:2d7675a1cc23800ab8040e28cd12f9ccdaceace4c0a2dae4a7802ed6be8964d7
    Port:       5601/TCP
    Host Port:  0/TCP
    Liveness:   http-get http://:5601/api/status delay=5s timeout=1s period=10s #success=1 #failure=3
    Readiness:  http-get http://:5601/api/status delay=5s timeout=1s period=10s #success=1 #failure=3
    Environment:
      ELASTICSEARCH_URL:    http://elastic-gke-logging-elasticsearch-svc:9200
      KIBANA_DEFAULTAPPID:  discover
    Mounts:                 <none>
  Volumes:                  <none>
Conditions:
  Type           Status  Reason
  ----           ------  ------
  Available      True    MinimumReplicasAvailable
  Progressing    True    NewReplicaSetAvailable
OldReplicaSets:  <none>
NewReplicaSet:   elastic-gke-logging-kibana-579db88676 (1/1 replicas created)
Events:          <none>
Diving a bit deeper, we can see that the deployment consists of 3 Elasticsearch pods, a Kibana pod and 3 Fluentd pods deployed as part of the DaemonSet:
kubectl get pods --namespace kube-logging

NAME                                          READY     STATUS      RESTARTS   AGE

elastic-gke-logging-elasticsearch-0           1/1       Running     0          1h
elastic-gke-logging-elasticsearch-1           1/1       Running     0          1h
elastic-gke-logging-elasticsearch-2           1/1       Running     0          1h
elastic-gke-logging-fluentd-es-6hxst          1/1       Running     4          1h
elastic-gke-logging-fluentd-es-sfskc          1/1       Running     5          1h
elastic-gke-logging-fluentd-es-zcl49          1/1       Running     0          1h
elastic-gke-logging-kibana-579db88676-tdqst   1/1       Running     0          1h
The provided configurations applied to the deployment can be viewed with:
kubectl get configmap --namespace kube-logging

NAME                                    DATA      AGE
elastic-gke-logging-configmap           2         1h
elastic-gke-logging-deployer-config     8         1h
elastic-gke-logging-fluentd-es-config   4         1h
elastic-gke-logging-kibana-configmap    6         1h
A closer look at the fluentd ConfigMap reveals the provided log aggregation and processing applied as part of the deployment. Here’s an abbreviated version of this configuration:
kubectl describe configmap elastic-gke-logging-fluentd-es-config --namespace kube-logging

Name:         elastic-gke-logging-fluentd-es-config
Namespace:    kube-logging
Labels:       app.kubernetes.io/component=fluentd-es-logging
              app.kubernetes.io/name=elastic-gke-logging
Annotations:  kubectl.kubernetes.io/last-applied-configuration={"apiVersion":"v1","data":{"containers.input.conf":"\u003csource\u003e\n  @id fluentd-containers.log\n  @type tail\n  path /var/log/containers/*.log\n ...

Data
====
containers.input.conf:
----
<source>
  @id fluentd-containers.log
  @type tail
  path /var/log/containers/*.log
  pos_file /var/log/es-containers.log.pos
  tag raw.kubernetes.*
  read_from_head true
  <parse>
    @type multi_format
    <pattern>
      format json
      time_key time
      time_format %Y-%m-%dT%H:%M:%S.%NZ
    </pattern>
    <pattern>
      format /^(?<time>.+) (?<stream>stdout|stderr) [^ ]* (?<log>.*)$/
      time_format %Y-%m-%dT%H:%M:%S.%N%:z
    </pattern>
  </parse>
</source>
Step 4: Accessing Kibana
The app deploys two ClusterIP type services, one for Elasticsearch and one for Kibana. Elasticsearch is mapped to ports 9200/9300 and Kibana to port 5601:
kubectl get svc --namespace kube-logging

NAME      TYPE        CLUSTER-IP      EXTERNAL-IP   PORT(S)             AGE
elastic-gke-logging-elasticsearch-svc   ClusterIP   10.39.243.235   <none>        9200/TCP,9300/TCP   1h
elastic-gke-logging-kibana-svc          ClusterIP   10.39.254.15    <none>
5601/TCP            1h
As seen above, the Kibana service does not have an external IP so we need to expose Kibana to be able to access it. To do this from your local terminal, use:
kubectl port-forward --namespace kube-logging svc/elastic-gke-logging-kibana-svc 5601
You will then be able to access Kibana at http://localhost:5601:
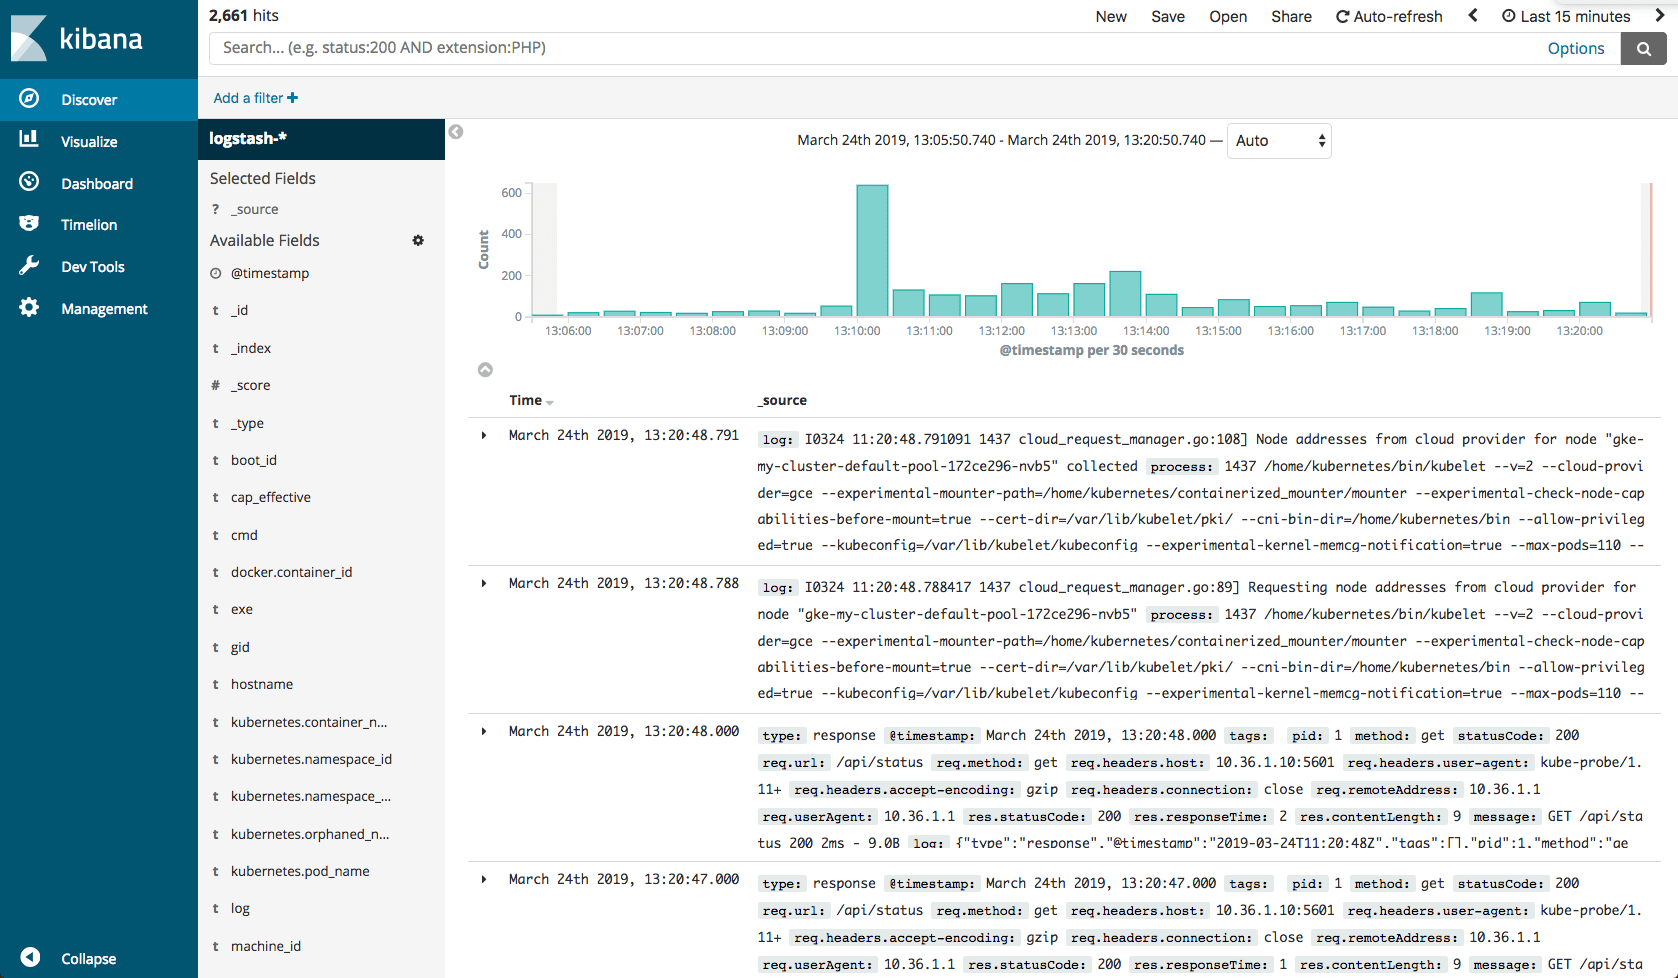
Your next step is of course to begin analyzing your Kubernetes logs. I’m not going to specify the different ways in which Kibana allows you to query and visualize the data, take a look at this article for more information. Suffice to say that within a few minutes, and without too much work on your part, you’ll be able to gain operational visibility into your cluster.
Endnotes
The Elastic GKE Logging app is a nice way to set up Elasticsearch, Kibana and Fluentd on Kubernetes. For production environments, however, you will want to explore more advanced Kubernetes deployment methods.
Separating nodes in different roles for example, with master, data and ingest nodes is a common design pattern that will result in better performance (I experienced some sluggish performance even with a basic configuration). Exposing both Elasticsearch and Kibana using ingress is also a better way of allowing access from the outside to the cluster. You will also need to look into ways of cleaning up your Elasticsearch clusters, with Curator being one way to go.
But again — if you’re just getting started with Kubernetes and want to set up a quick development EFK Stack, this is a great way to go about it.

You Might Also Like

Terraform is No Longer Open Source. Is OpenTofu the Successor?

