Videos
Browse through our video library for product insights.
Webinar: From Raw Telemetry to Actionable RCA
Speakers: David Lotan Bolotnikoff, VP Product, Logz.ioKevin Klein, AI Engineer, OrionIQ RCA Lead, Logz.io What we discuss in the webinar: Logz.io’s blueprint for cutting investigation time and what happens when you put an AI agent on top of it.Why incidents s...
AI for Observability: What Actually Works in Production
In this candid discussion with Logz.io AI Engineer Shevach Marantz and CEO & Co-founder Tomer Levy, we covered: Why incident investigation is fundamentally hard Why connecting a public LLM to logs breaks under scale What a domain expert observability A...
Smarter Incident Response with Logz.io and PagerDuty
In this candid discussion with Jackie Leybman (Principal Product Manager, PagerDuty) and David Lotan (VP Product, Logz.io), we covered: Why incident response still breaks at scale How AI agents close the gap between incident management and observability Breaking...

Product
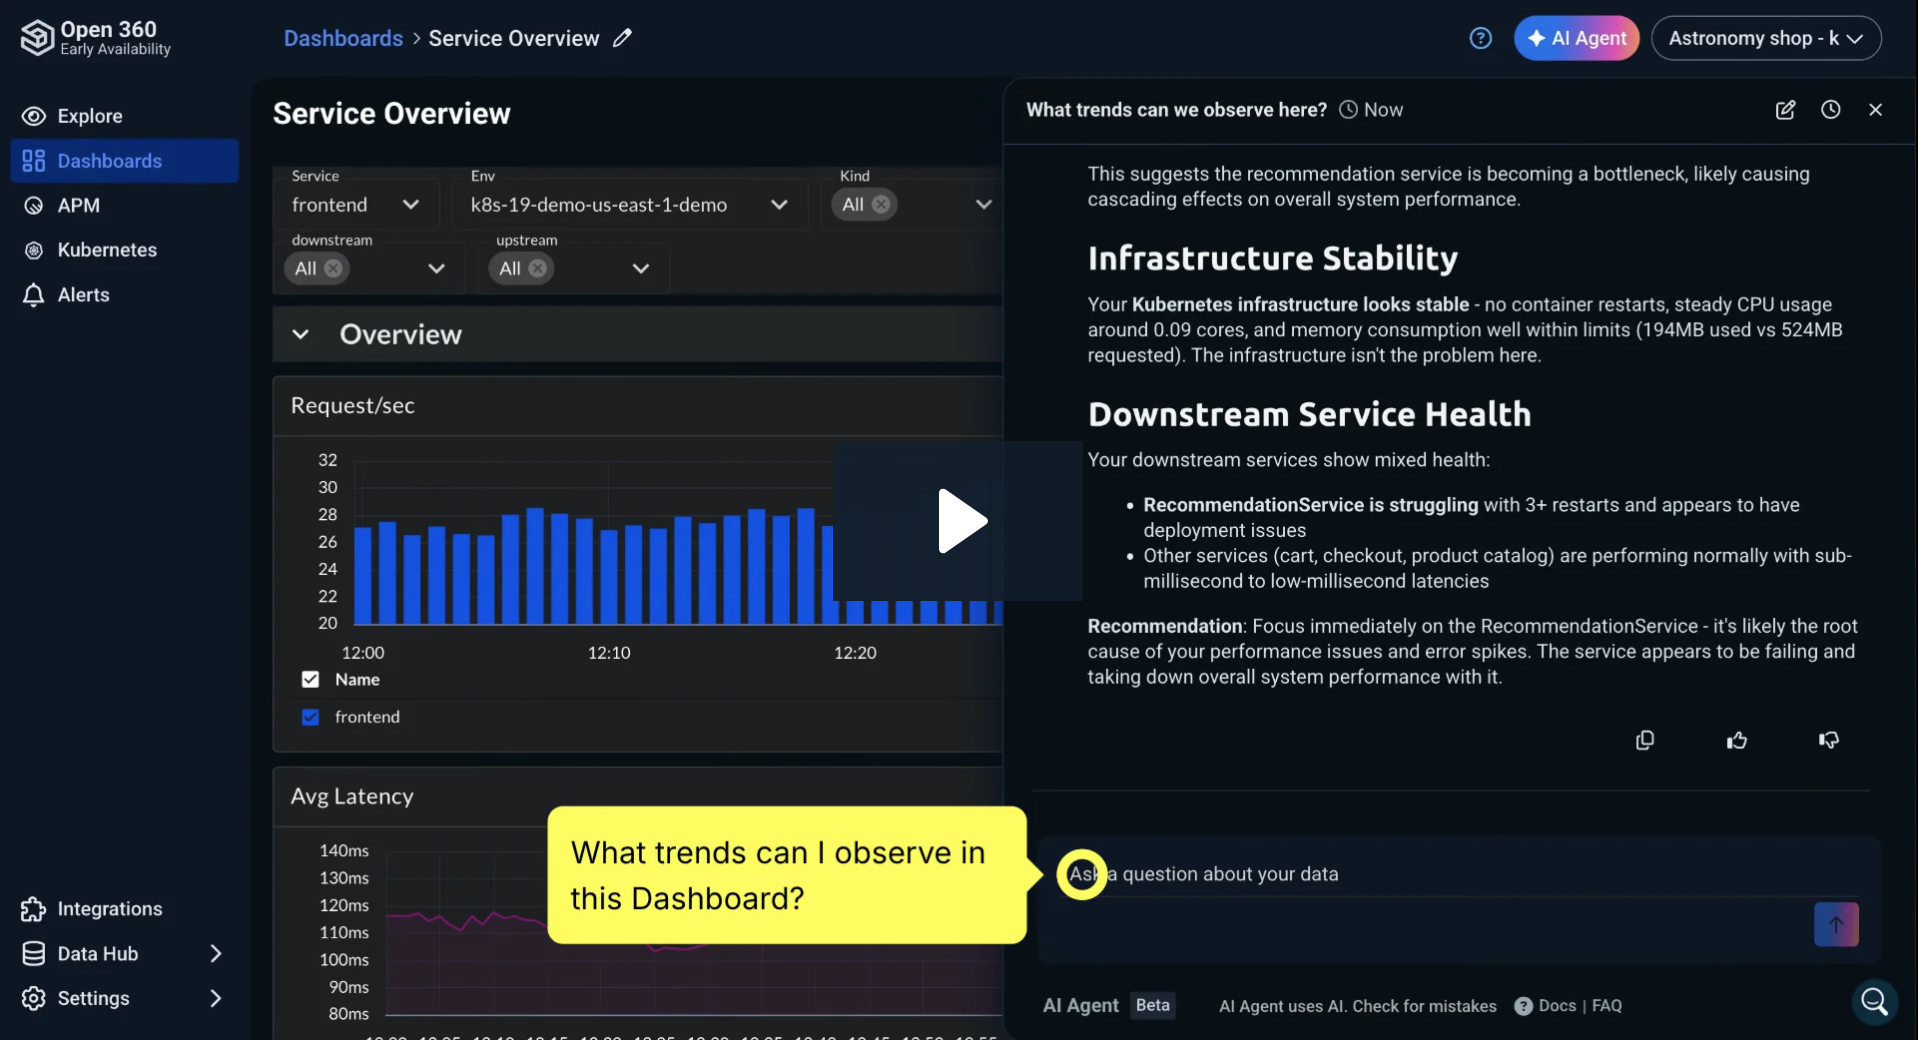
The Open 360 AI Experience
Experience the new Open 360 AI, built to help you explore, analyze, and act on your observability data in a smarter waySee h...
Investigating SIEM Incidents with Logz.io
A short demo showing how Logz.io, powered by the AI Agent, helps investigate security incidents by analyzing and correlating d...
The New Open 360 AI Experience
Experience the new Open 360 AI, built to help you explore, analyze, and act on your observability data in a smarter waySee h...

Open 360 AI Platform Overview
Welcome to Logz.io Open 360 AI, the first observability platform built for humans and AI agents working together. Our AI-driven...

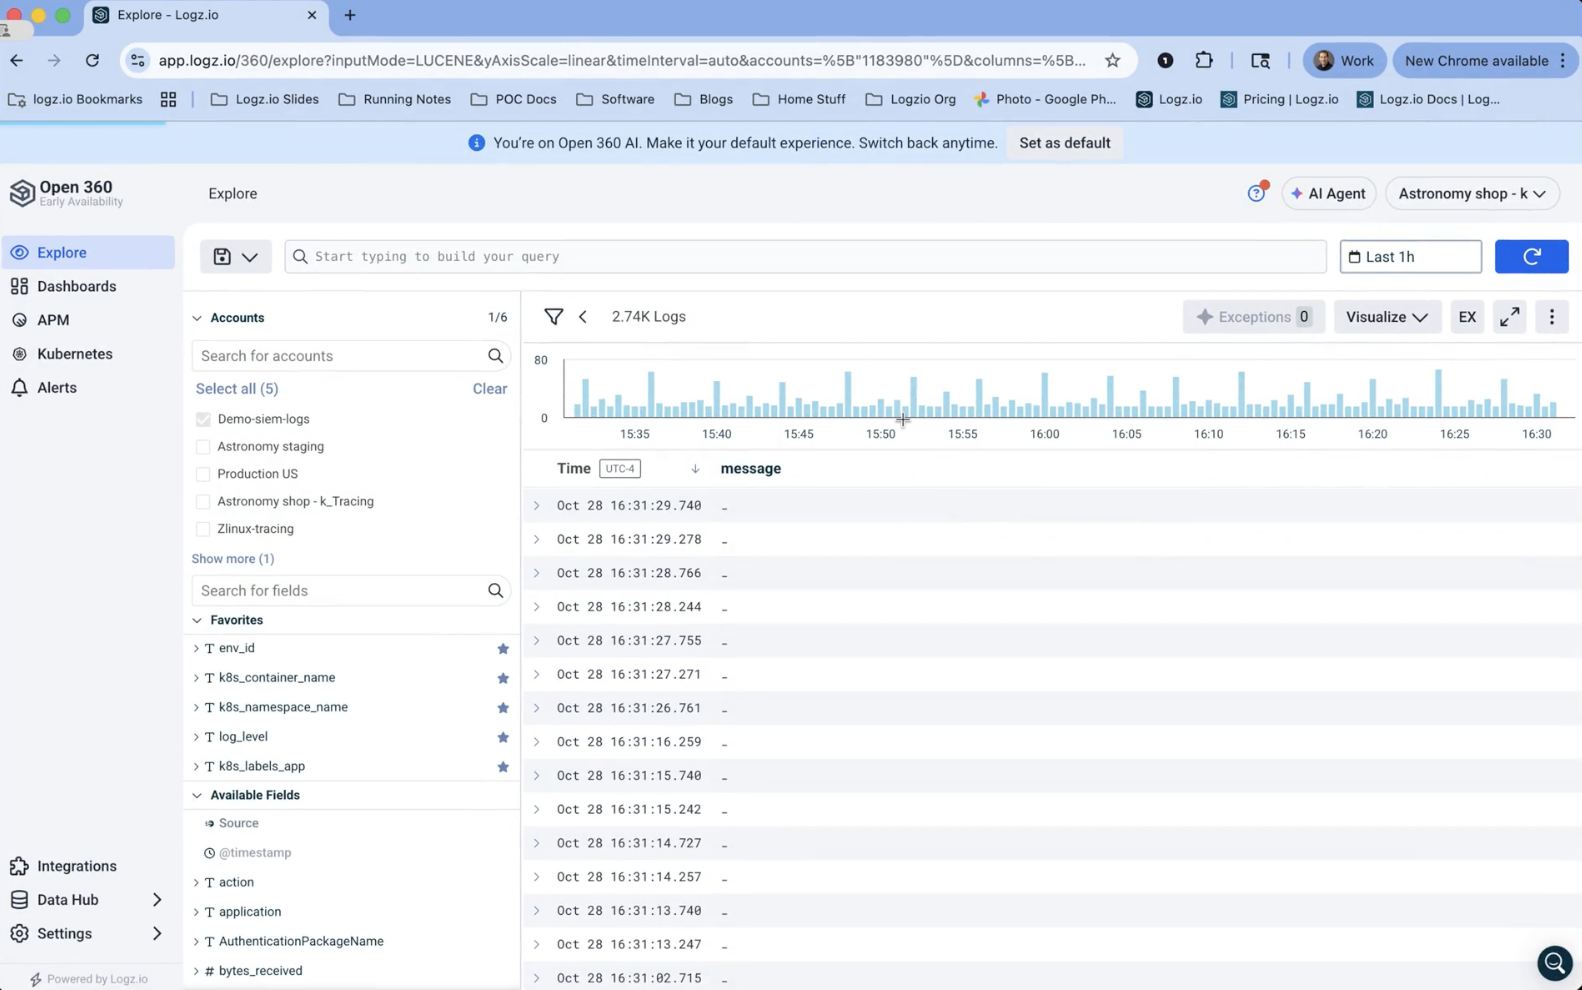
Logz.io Explore: Smarter, AI-Powered Log Analysis
Welcome to Explore, the new Logz.io UI designed to make log management and analytics faster and smarter with the power of...

AI in Observability: Mapping Root Causes with Precision
Explore how AI is transforming observability by mapping system connections and uncovering root causes with precision. The...

Getting Started with Logz.io: Sending Data Made Simple
Ready to start sending data to Logz.io? This quick guide walks you through the simplest ways to integrate your logs, metrics,...

AI-Powered Log Management: Faster Troubleshooting with Logz.io
Managing logs in a fast-paced cloud-native world can be tough. Log data is growing, and traditional tools just can’t keep u...

Logz.io Explore – Overview
Logz.io product manager Adam Cazes takes you on a high level overview and tour of Logz.io Explore. Learn how this powerful...

Anomaly Detection: Shedding Light on the Unknown Unknowns
In this webinar, CTO and Co-founder Asaf Yigal demonstrates with Anomaly Detection and the Open 360™ observability platform h...

Rethinking APM with App 360
In this webinar, see how Logz.io's latest offering, App 360, helps you: Automatically discover and instrument your services...

Solving Complexity Challenges with K8s 360
In this webinar, learn how to use Logz.io's Kubernetes 360 for: Identification and resolution of potential security issues...

Logz.io Overview
A brief intro to Logz.io

Logz.io Open 360 Observability Platform Demo
Logz.io’s Open 360TM Observability Platform unifies log, metric, and trace data into a single platform for full visibility i...

Data Optimization Hub
The average Logz.io customer reduces their cost by 32% with Data Optimization Hub. Learn how you can too!

Telemetry Collector
Easily integrate Logz.io with your stack to get full observability in minutes with Logz.io's Telemetry Collector.

Observability for Teams that Love Open Source
See how Logz.io’s Open 360 Platform unifies log, metric, & trace data into a single platform built on the most popular o...

Logz.io Cloud SIEM
See how Logz.io Cloud SIEM can help you quickly identify and investigate threats across your cloud environment

Logz.io™ Log Management
Centralize and analyze all of your log data to quickly investigate production issues with Logz.io Log Management.

Getting Started with Prometheus-as-a-Service
Learn how to get started with the Logz.io Infrastructure Monitoring free trial by sending your metrics to our scalable SaaS...

Logz.io™ Infrastructure Monitoring
Monitor with Prometheus, the best cloud-native tool for metrics storage and analytics. Provided on an easy-to-use cloud service, integrated with logs and metrics.

Logz.io™ Distributed Tracing
Based on Jaeger, the popular open source for distributed tracing chosen for CNCF. Provided as an easy-to-use, fully managed solution, integrated with log and metrics analytics.
Case
Studies

Dormakaba Group leverages Logz.io to visualize and resolve production issues faster
As the team responsible for building the first cloud access control solution, Exivo, the Cloud Development team at Dormakaba EMEA needed a logging solution that could scale throughout their global environment, handle a tremendous amount of throughput, integrate with their API, and remain extremely secure. Logz.io was the perfect fit for these requirements. Watch our latest Customer Perspective to learn how they leverage Logz.io to visualize and resolve production issues faster.

How Snyk Gains End-to-end Observability using Logz.io
Snyk is a developer-centric organization focused on open source and container security for modern engineering teams. In our latest customer perspective, Anton Drukh, VP of Engineering, sat down with our team to discuss how the organization gains full production visibility and end-to-end observability with the help of Logz.io.

Logz.io Interview with Dave from Dyn
Learn about how Logz.io helped Dyn scale their infrastructure and accommodate their diverse logging needs.

Logz.io Interview with Joe from Pantheon
Find out how Logz.io has helped Pantheon run ELK at a scale for better, more efficient log analysis.

Logz.io Interview with Chris from Dyn
Find out how Logz.io reduced Dyn’s mitigation time from 5 seconds to 1 second, helping to combat DDoS attacks.

Nailing ELK at Scale – A Real World Success Story from Holler
Ever use stickers or GIFs to make your texts, messages, or DMs more interesting? If yes, you’ve probably used Holler - a messaging tool that makes digital conversations come to life. The engineers at Holler have the daunting task of monitoring the performance and reliability of a service used by millions of people around the globe on a daily basis. Like many modern DevOps teams, they chose the ELK Stack to manage and analyze their log data. Hear from Daniel Seravalli, a Lead Engineer at Holler, on their story about grappling with the complexities of managing their ELK Stack at scale.

How Jacada DevOps Integrated Security into Observability
Watch this webinar to hear how Jacada leverages open-source technology to meet their observability, monitoring and security objectives.

Training

Rise of Shadow AI & Tech Debt Tsunami
Generative AI is revolutionizing the technology landscape—but with innovation comes complexity, technical debt, and the n...

Troubleshoot Kubernetes Performance Issues with Logz.io AI Agent
Struggling with Kubernetes performance issues? This video introduces an AI-powered agent designed to help users quickly identify...
Optimizing Observability Data Volume and Cost with Logz.io AI Agent
Struggling with high observability costs? In this video, Jade Lassery breaks down the challenges of managing excessive data...
Finding Root Cause Quickly with Logz.io AI Agent
In the video, Jade Lassery discusses how to effectively manage complex environments, especially when faced with unexpected...
Logz.io Explore: Smarter, AI-Powered Log Analysis
Welcome to Explore, the new Logz.io UI designed to make log management and analytics faster and smarter with the power of...
Getting Started with Logz.io: Sending Data Made Simple
Ready to start sending data to Logz.io? This quick guide walks you through the simplest ways to integrate your logs, metrics,...

Monitoring K8s Using Prometheus
Logz.io Customer Success Engineer Shawn Pitts dives into how to effectively monitor K8s using Prometheus and Logz.io during...

Getting Started with OpenTelemetry
Everything you need to know to get started with OpenTelemetry and Logz.io.

What’s New in Open 360?
Deep dive into all the new capabilities that App 360 has to offer including how to: Automatically discover and instrument...

Querying Metrics with PromQL
Learn how to query metrics in Logz.io using PromQL.

How to Create Grafana Dashboards
Learn how to create Grafana dashboards tailored to your needs in Logz.io.

How to Use Grafana Alerts Manager in Logz.io
Learn how to use Grafana Alerts Manager in Logz.io

Understanding the Rate Function
Everything you need to know about the rate function and how it works with counter metrics.

4 Types of Prometheus Metrics
Gauges, counters, histograms and more. Dive into everything you need to know about the four types of Prometheus metrics.

5 Tips for Accelerating Troubleshooting
Find and remediate issues faster than ever with new features: Service Overview and a new and improved Kubernetes 360.

How to Reduce Observability Costs
Logz.io CEO Tomer Levy and CTO Asaf Yigal deep dive into the rising costs of observability and share useful tips on how teams...

Open 360TM Platform Overview Webinar
Making observability faster, simpler, and more cost efficient to address today's requirements.

Accelerating Your Incident Response Workflow
Learn how to accelerate your incidence management workflow with Logz.io

Searching and Filtering
Learn how to search and filter your log data with Logz.io.

Create Log Visualizations with Logz.io
Learn how to build log visualizations with Logz.io.

Sending Prometheus Metrics to Logz.io
Learn how to send Prometheus metrics to Logz.io

Accelerating Cloud Monitoring via the Logz.io Azure Native Integration
Watch this Logz.io and the Azure Cloud team webinar to learn about the Logz.io Azure Marketplace native integration.

Collect and Analyze Kafka JMX Metrics with Logz.io
In this webinar, Noni Peri, our Production Team Lead at Logz.io, discussed how to monitor Kafka’s performance and reliability by collecting and analyzing its JMX metrics with Logz.io

Quickly Identify and Resolve Kubernetes Production Issues with Logz io
In this webinar, we discussed how Logz.io addresses the challenge of gaining observability into Kubernetes and the applications it powers.

Collecting and Shipping Kubernetes logs at scale with FileBeat Autodiscover
In this webinar, Dan Avigdor, Solutions Architect, Logz.io discussed how to configure and implement Autodiscover to automatically collect and ship your logs in Kubernetes environments at scale.

Simplified Monitoring for AKS Deployments with Logz.io
To deliver reliable, performant, and secure microservices on AKS, DevOps teams must be prepared to identify and fix production issues before they impact customer experiences. However, considering the scale and variety of log data generated by modern AKS deployments, gaining observability into AKS and the applications it powers is a significant data analytics challenge.

Webinars
Webinar: From Raw Telemetry to Actionable RCA
Speakers: David Lotan Bolotnikoff, VP Product, Logz.ioKevin Klein, AI Engineer, OrionIQ RCA Lead, Logz.io What we discuss...
AI for Observability: What Actually Works in Production
In this candid discussion with Logz.io AI Engineer Shevach Marantz and CEO & Co-founder Tomer Levy, we covered: Why i...
Smarter Incident Response with Logz.io and PagerDuty
In this candid discussion with Jackie Leybman (Principal Product Manager, PagerDuty) and David Lotan (VP Product, Logz.io),...
2026 Observability Predictions: What Lies Ahead
In this candid discussion with Logz.io Sales Engineer Spencer Bos and CTO & Co-founder Asaf Yigal, we covered: How t...
Your Next Observability RFP is All Wrong: Why AI Changes Everything
In this candid discussion with Logz.io founders Tomer Levy and Asaf Yigal, we covered: What's Really Happening:...
AI-Driven Alert Triage and RCA
In this live technical demonstration, AI agent experts presented: AI agent alert investigation in action Real-time correlation...

Logz.io & PagerDuty Joint Webinar

Redefine Observability Spending
The pressure is on: 91% of organizations are actively trying to reduce observability spend. With rising data volumes...

Demystifying Kubernetes Observability with Generative AI and LLMs
Join Asaf Yigal, co-founder and CTO of Logz.io, as he discusses the future of Kubernetes observability in an era driven by...

Webinar: Transform Troubleshooting with Logz.io’s AI Agent
Watch this webinar for an exclusive demo showcasing the new Logz.io AI Agent—an intelligent GenAI assistant designed to ...

Tired of just hearing about AI vision and ready for real success stories?
Listen in as Logz.io CTO and Co-Founder, Asaf Yigal, speaks directly with a Logz.io user about their experience with AI and...

Webinar: Translating Telemetry into Insights
The first step in engaging any successful log management or observability practice is gettingyour telemetry data to the platform...

Webinar: Introducing Your Faster, Easier Log Management UI
Log management has seen limited innovation in recent years, with open source tools and platform solutions failing to deliver...

Meet Logz.io‘s Observability IQ Assistant, which aims to turn this vision into reality.
There’s so much hype around the use of AI in observability — but how does that translate into your day-to-day? Now picture hav...

Completing the K8s Monitoring Puzzle
Deep dive into the complexities people are facing with monitoring and troubleshooting K8s. See how to get a single view into...

Beyond Logs, Metrics and Traces
Event Replay: ContainerDays 2023 September 11-13, 2023 @ Hamburg, DE At ContainerDays in Hamburg, Germany last year, Logz.io...

Open Source Observability is the Way Forward, and Here’s Why – Logz.io at AWS re:Invent
Open source is the best option for observability today because it’s a model that supports unlimited growth and innovation. Y...

When Your Open Source Tool Turns to the Dark Side
Imagine waking up one morning to find out that your beloved open source database, which lies at the heart of your system,...

Driving Your Business Forward with an Open Source Approach to Observability
The webinar explores the latest trends, challenges, and opportunities in deploying observability and monitoring solutions...

DevOps Best Practices for CI/CD and Observability
In this webinar, we heard from Mike and Sam from Logz.io and CircleCI, respectively, on how CircleCI and Logz.io can work together to simplify and accelerate application delivery and response to production issues.