Incident Management with Logz.io and VictorOps
May 4, 2017
In previous posts, we described integrating the Logz.io ELK Stack with a number of messaging and paging services including PagerDuty, Datadog, and BigPanda. These articles highlighted the ability to create alerts based on Kibana queries and ship them to an external tool using premade integrations.
However, Logz.io also supports hooking in any application that accepts data via REST API. All that is needed is a webhook URL and any additional parameters required by the API.
This article will show one such example using the incident management tool VictorOps. I’ve been meaning to check out VictorOps for some time now, and hooking it up with Logz.io was a great opportunity to do so.
Here are the results!
Two Steps in VictorOps
Before you can create a new custom endpoint in Logz.io, we need to perform a few simple steps within VictorOps.
First, you will need to retrieve the VictorOps webhook URL for receiving alerts from Logz.io.
In VictorOps, open the Settings page and then select Alert Behavior -> Integrations.
From the list of integrations, select the REST generic integration. Since this is the first REST integration we are setting up, we will need to enable the integration to retrieve a REST URL with an integration key:
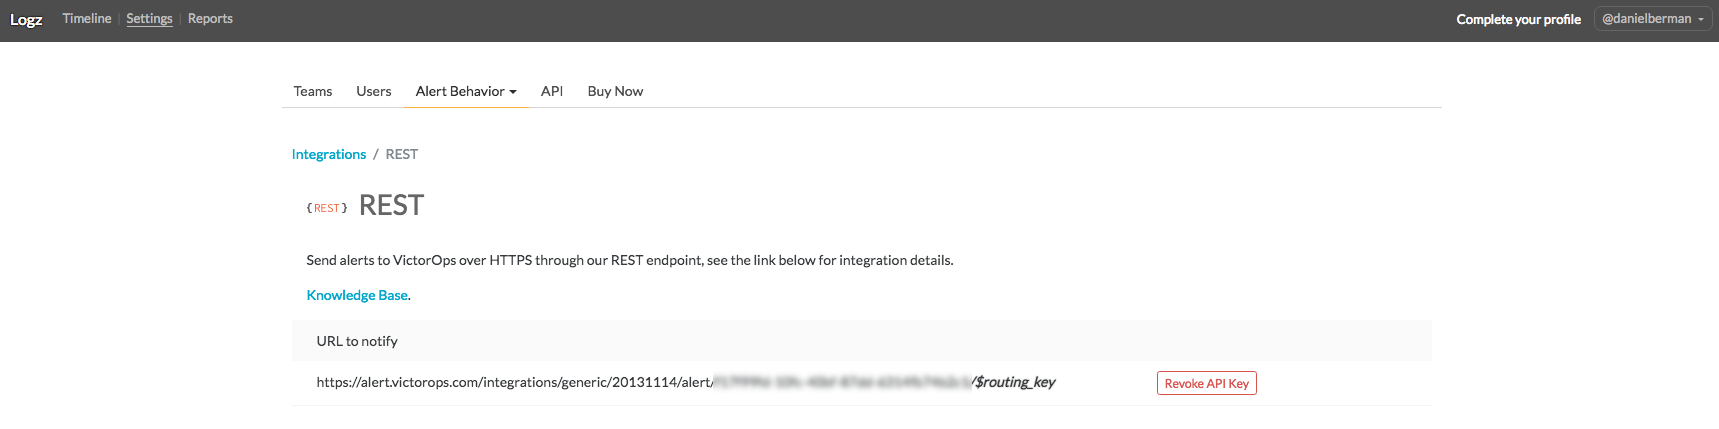
Note that the URL also includes an extra parameter called $routing_key — this allows you to route specific incidents to a specific VictorOps team.
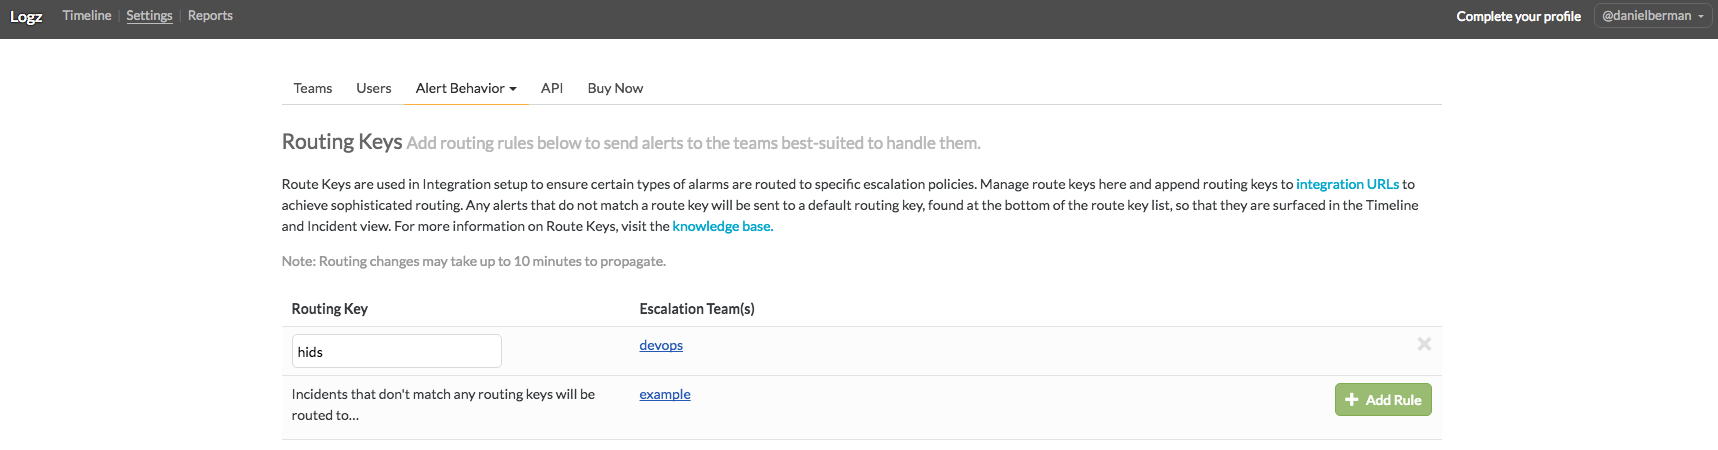
To create a new routing key, go to the Alert Behavior → Routing Keys page and add a new rule. You will need an existing team to whom to route incidents, so if you do not have a team set up in VictorOps, do so before adding the routing key.
The result of these actions in VictorOps is a complete integration URL that we will use in the following steps to create a custom webhook in VictorOps. Together with the routing key, it should look something like this:
https://alert.victorops.com/integrations/generic/20131114/alert/xxxxxxxx-xxxx-xxxx-xxxx-xxxxxxxxxxxx/hids
Creating a New Custom Endpoint in Logz.io
Next up, we will use the integration URL to create a new endpoint in Logz.io.
All the endpoints in Logz.io are managed on the Alerts → Alert Endpoints page. To add a new endpoint, click New Endpoint.
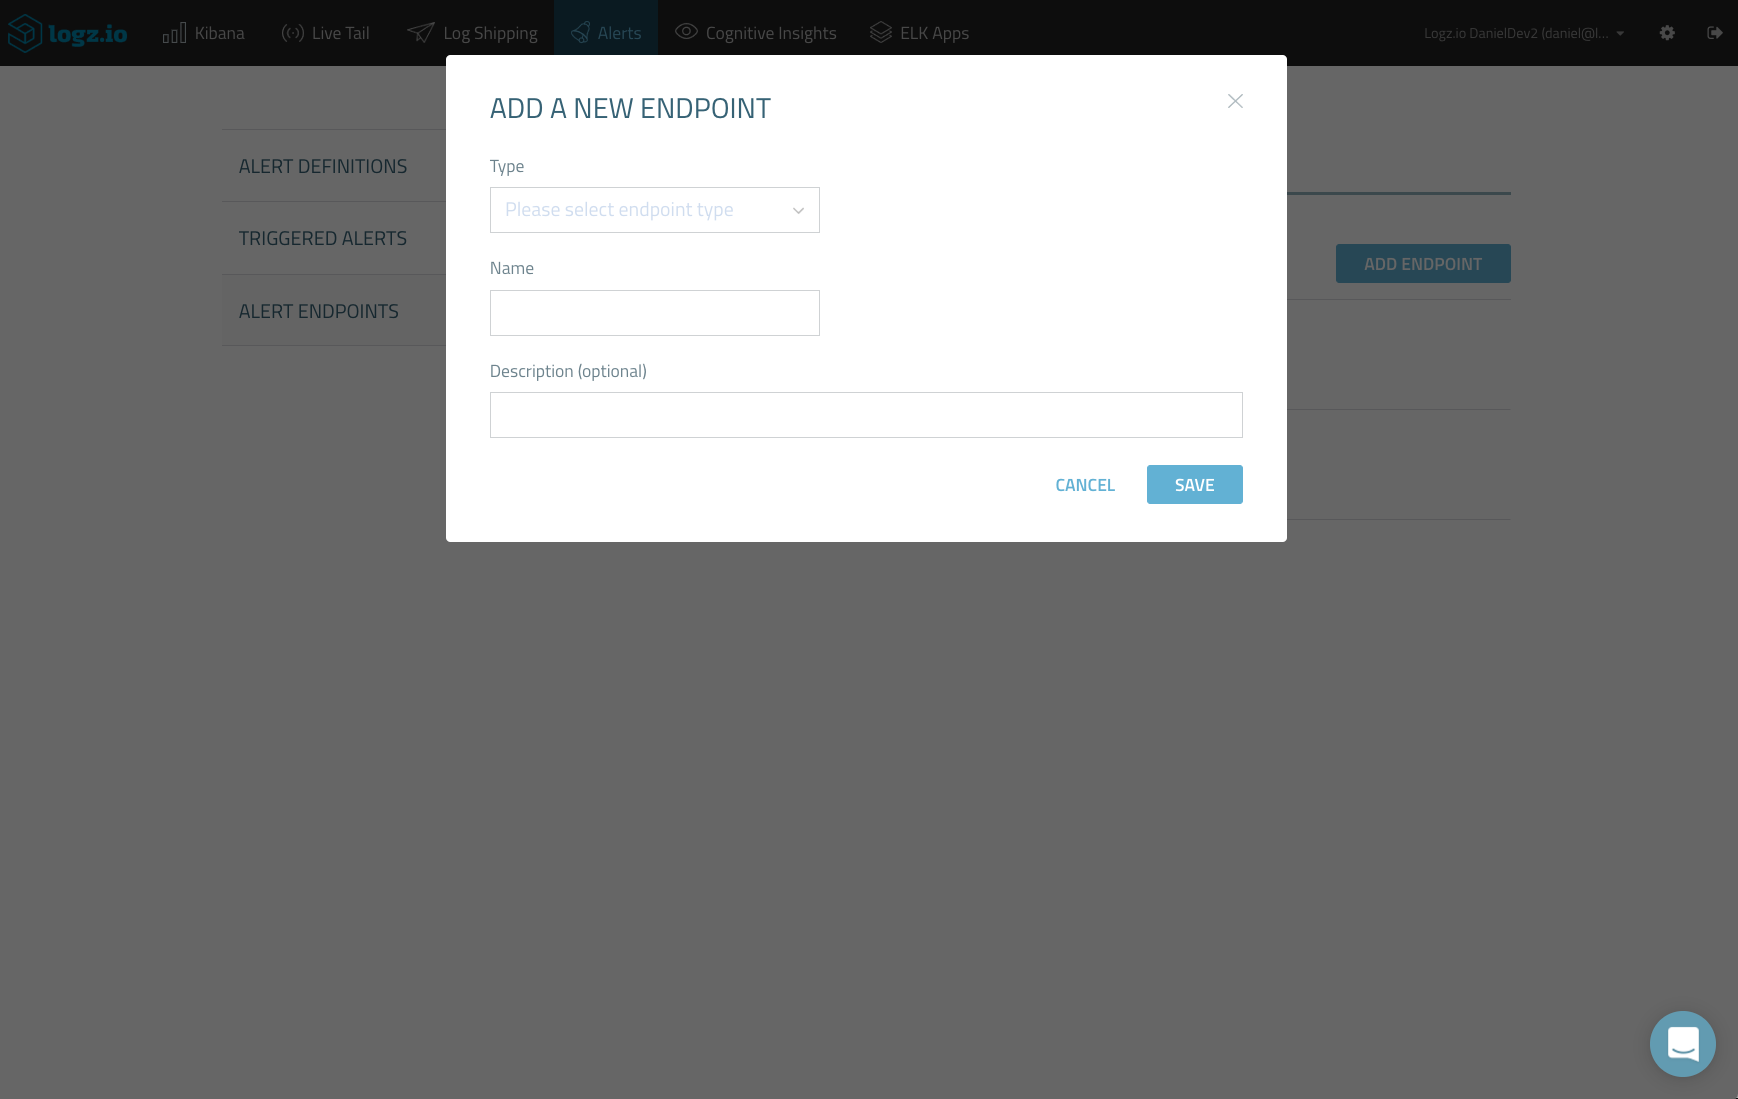
Configuring the new endpoint is simple.
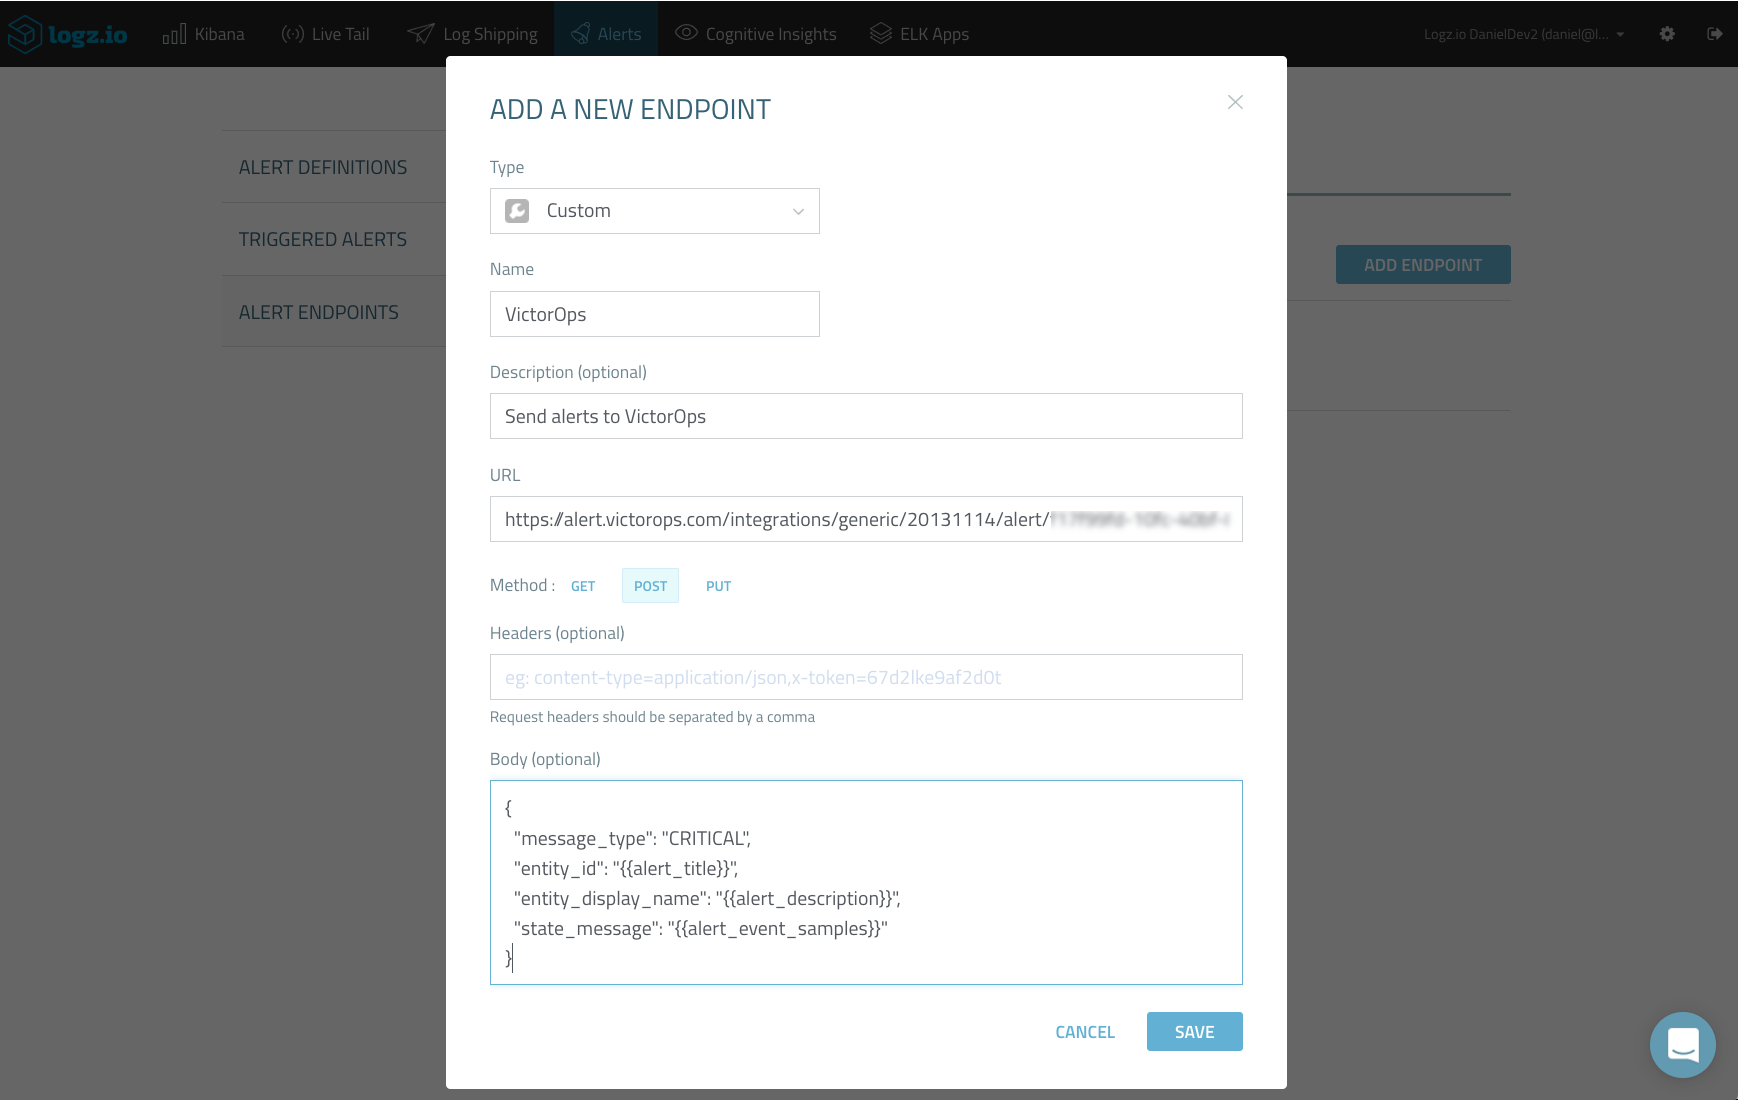
After selecting Custom from the Type drop-down menu, we need to fill in the following parameters:
- Name and description — a descriptive name and description for the new endpoint
- URL — the integration URL you retrieved from VictorOps
- Method — select the POST method
- Headers — not necessary in our case
- Body — VictorOps API only requires passing the “message_type” parameter, but we are going to use additional parameters that will be replaced with metadata supplied by the Logz.io alert engine — alert name, description and samples:
{
 "message_type": "CRITICAL",
 "entity_id": "{{alert_title}}",
 "entity_display_name": "{{alert_description}}",
 "state_message": "{{alert_event_samples}}"
}
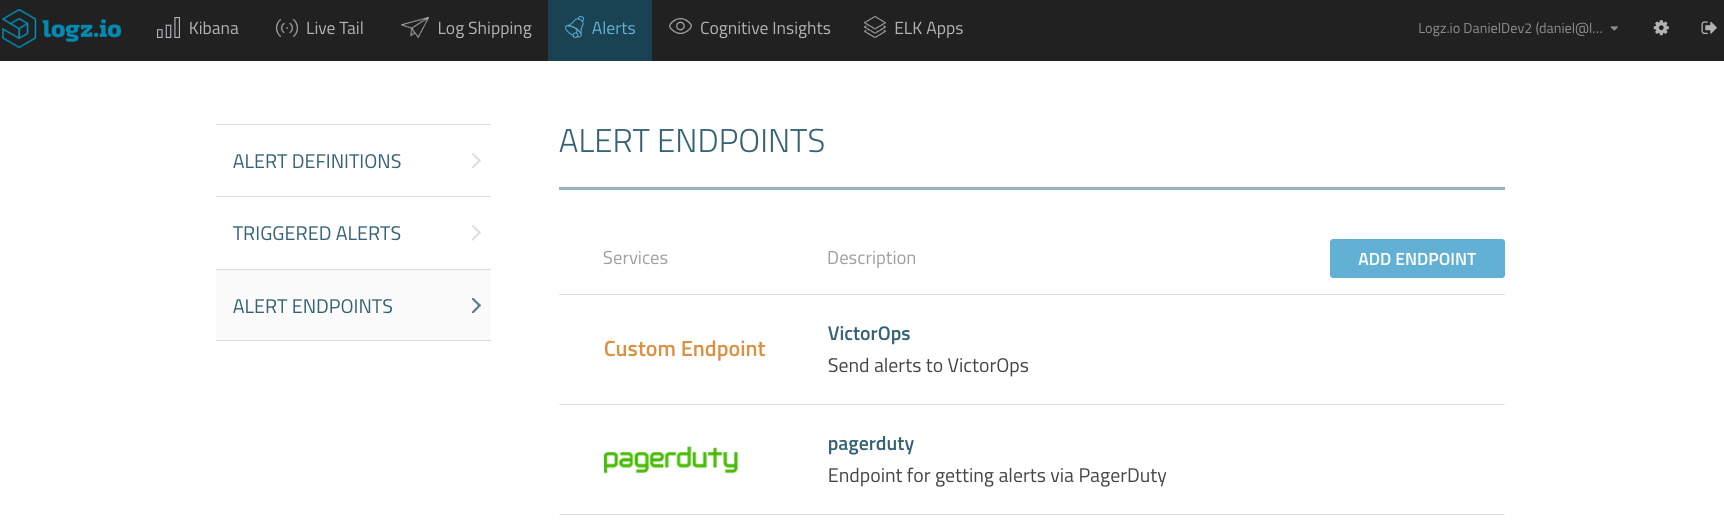
Save the new endpoint. It will be displayed on the Alert Endpoints page.
Creating a New Alert in Logz.io
Next, we will create a query-based alert in Logz.io that will use the new endpoint to send it off to VictorOps for incident management.
In the case of this tutorial, you will be monitoring Wazuh OSSEC logs for HIDS (Host Intrusion Detection System).
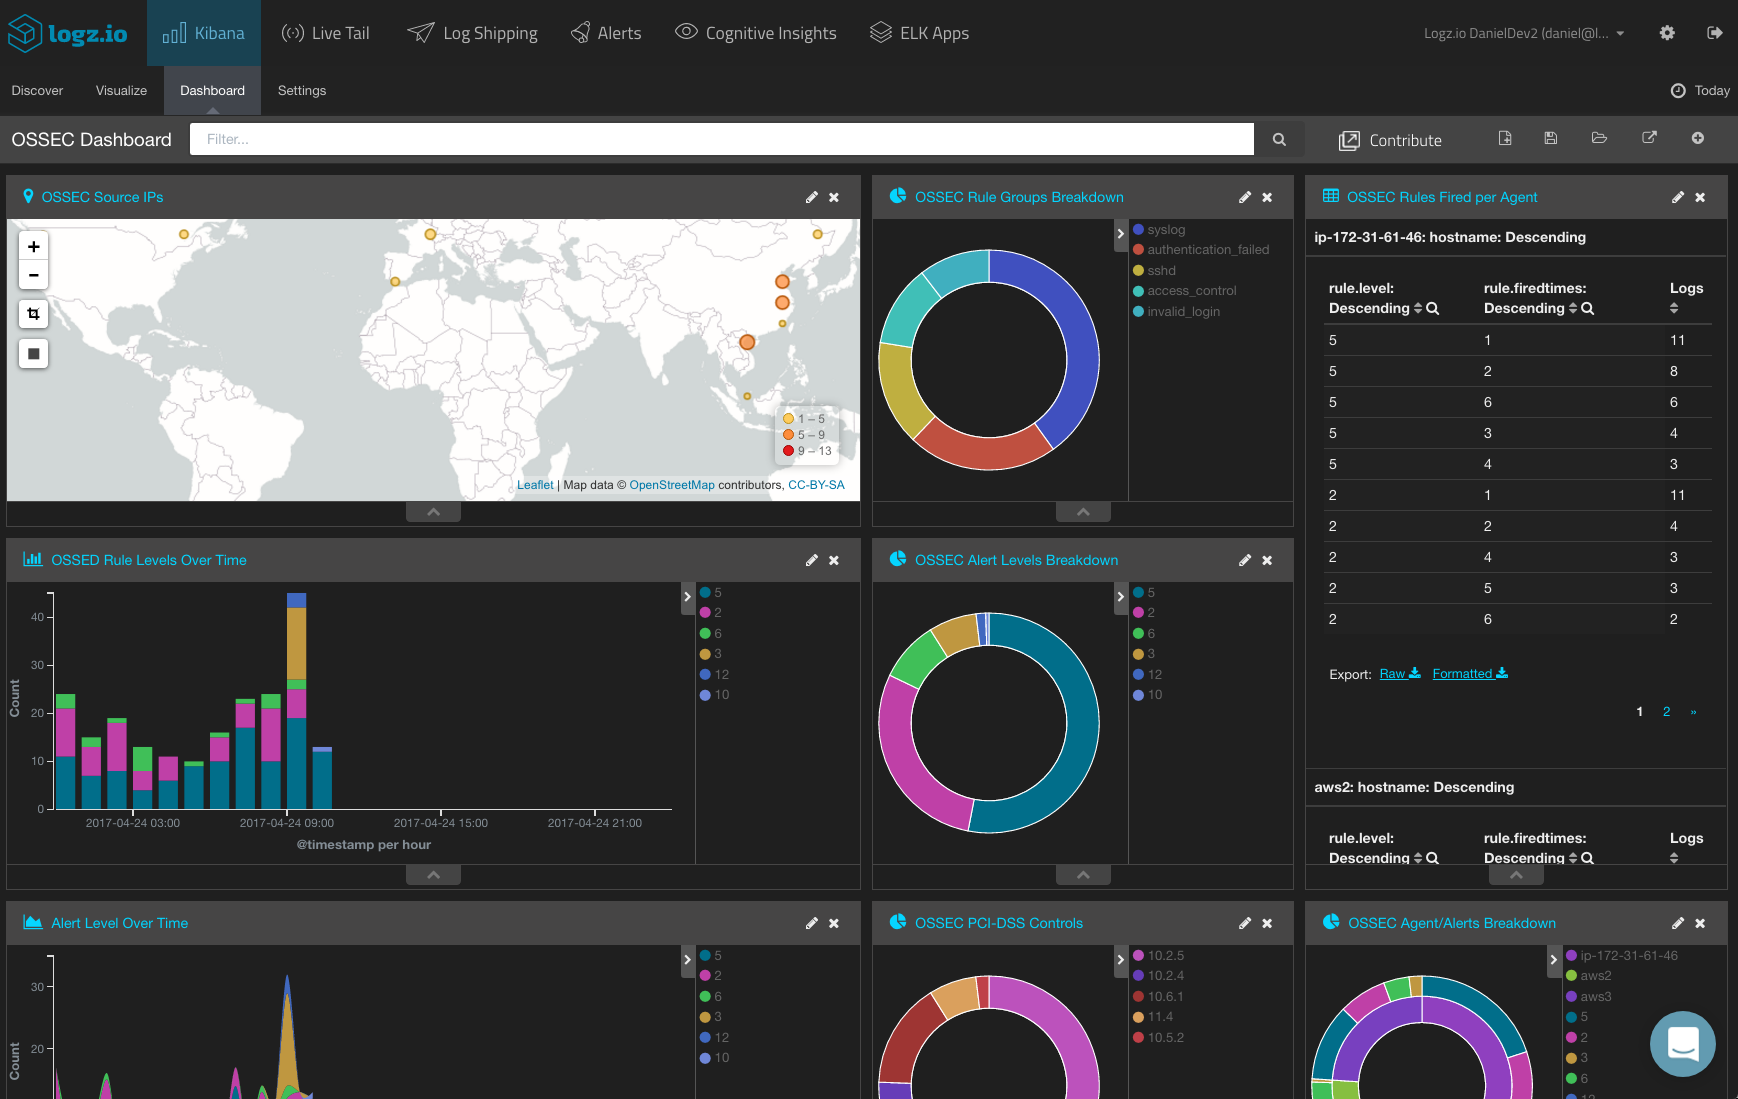
In this example, you want to be notified when your system records an unusual amount of actions with an assigned rule group level of 12. In OSSEC, logs belonging to rule group 12 may indicate an attack against a specific application.
In Kibana, search for:
rule.level:12
Then, hit the Create Alert button.
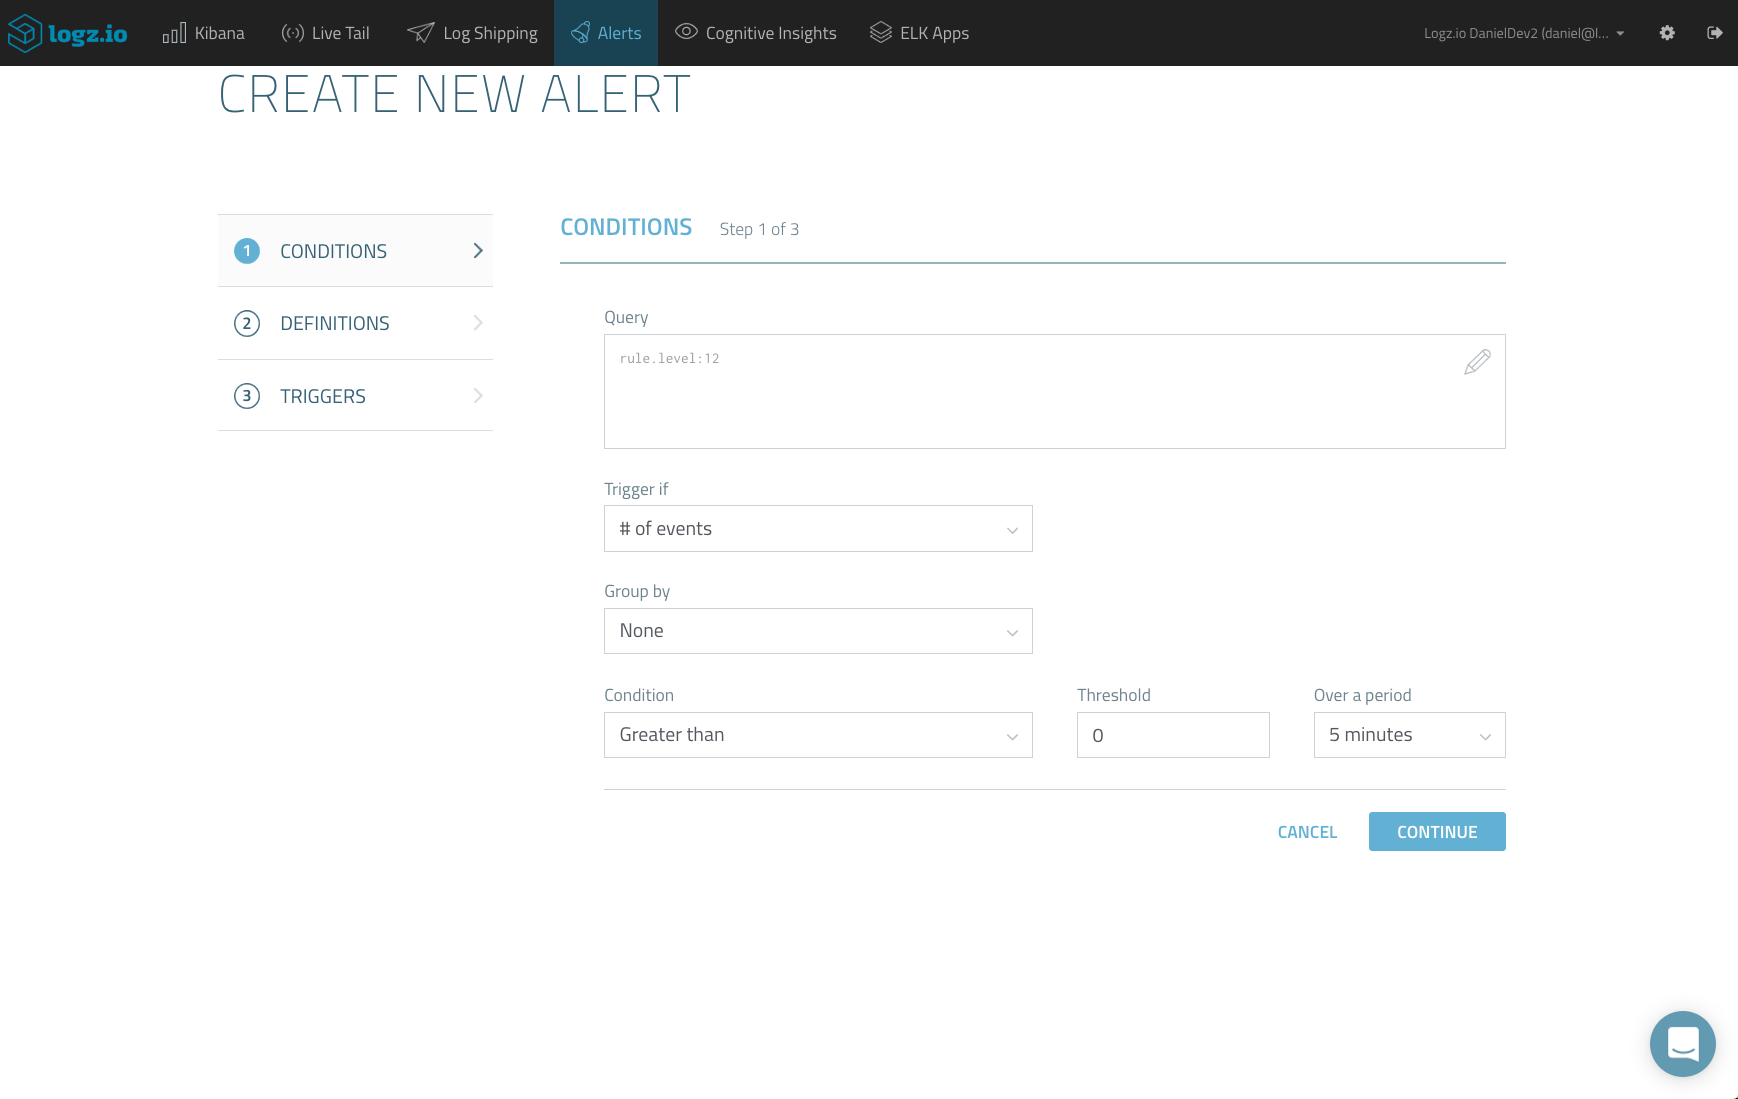
On the first page of the Create New Alert wizard, you will see that the Kibana query is already loaded. Complete the conditions that will trigger an alert. (For example, you can set a threshold that, if passed, will trigger an alert.)
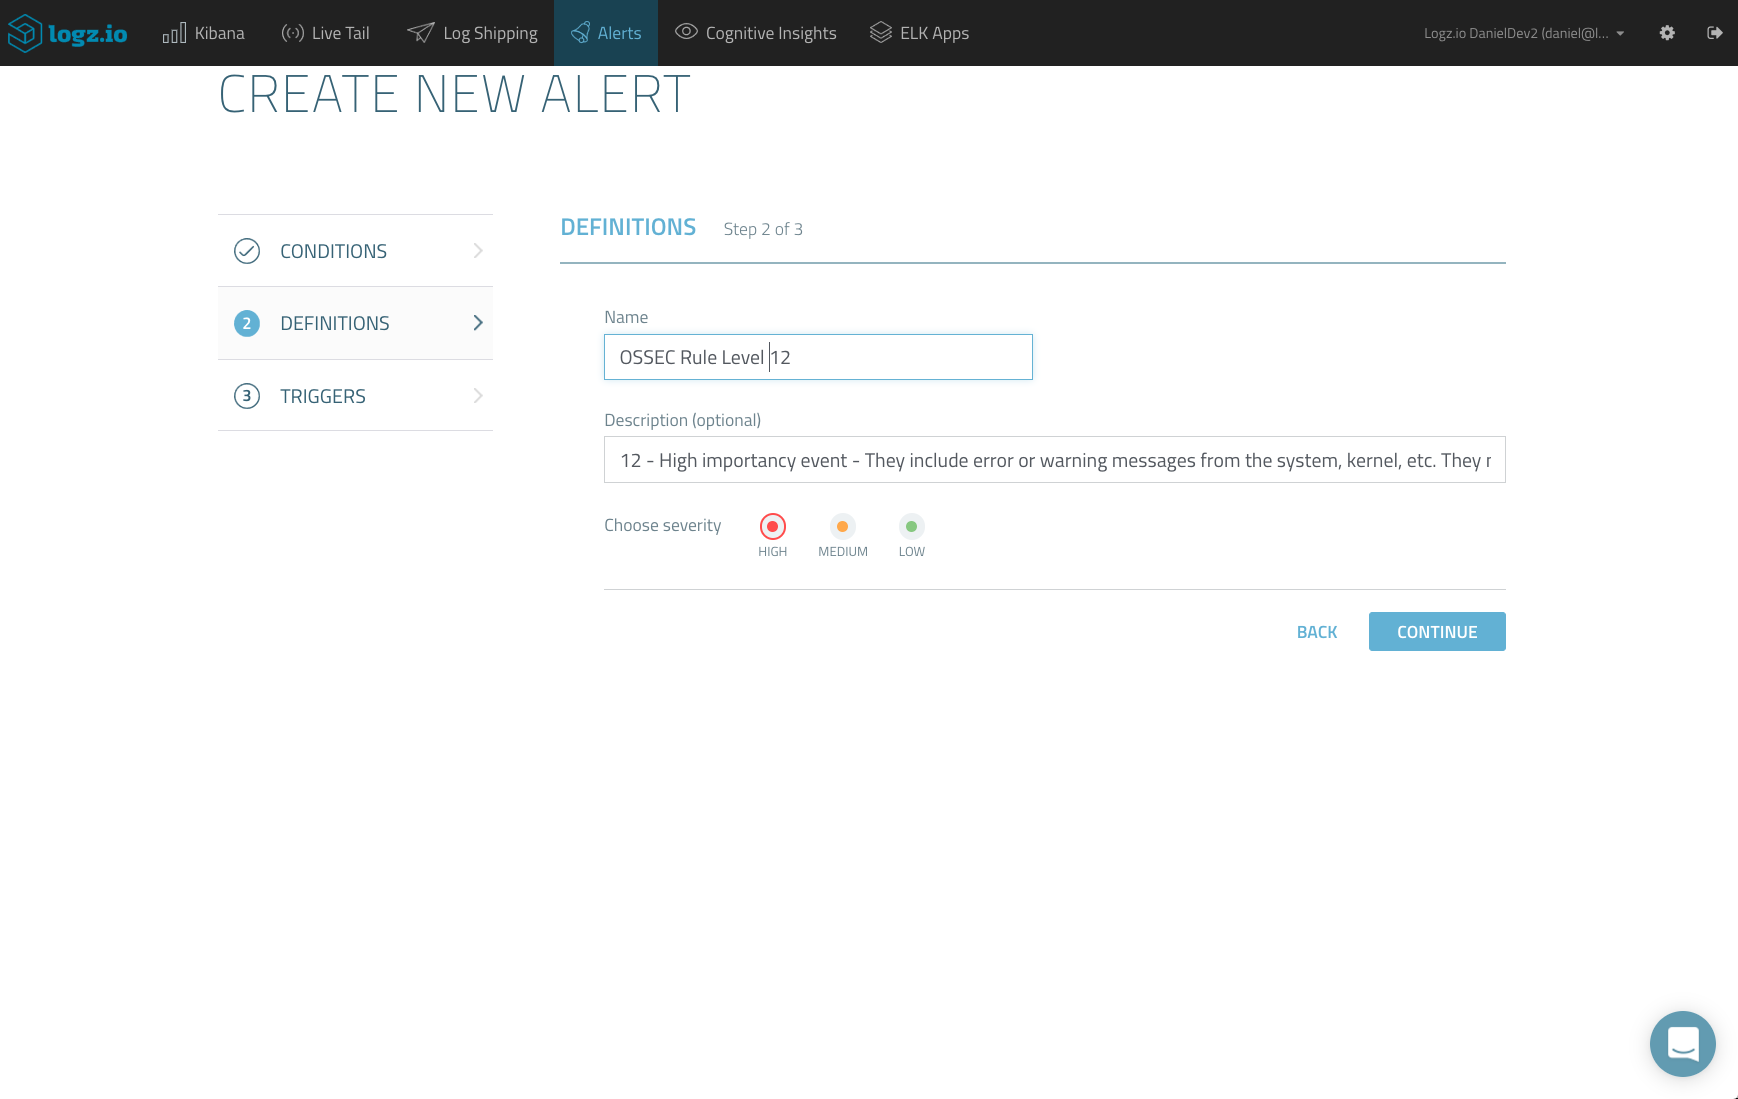
In the next step, enter a name and description for the alert and set the severity level. While the description is optional, I highly recommend you give a meaningful description — this will help you manage your alerts in VictorOps.
Last but not least, for the third and final step, enter how you want to be notified. You can enter an email address, but in this case, select the new custom endpoint that we created in the previous step.

Once created, your alert is added to the Alert Definitions page, and the Logz.io alert engine will check once a minute whether the threshold that you configured has been surpassed.
Once triggered (and if all was configured correctly) you will see your alert — now an incident — on your timeline in VictorOps. Open it to see more details.
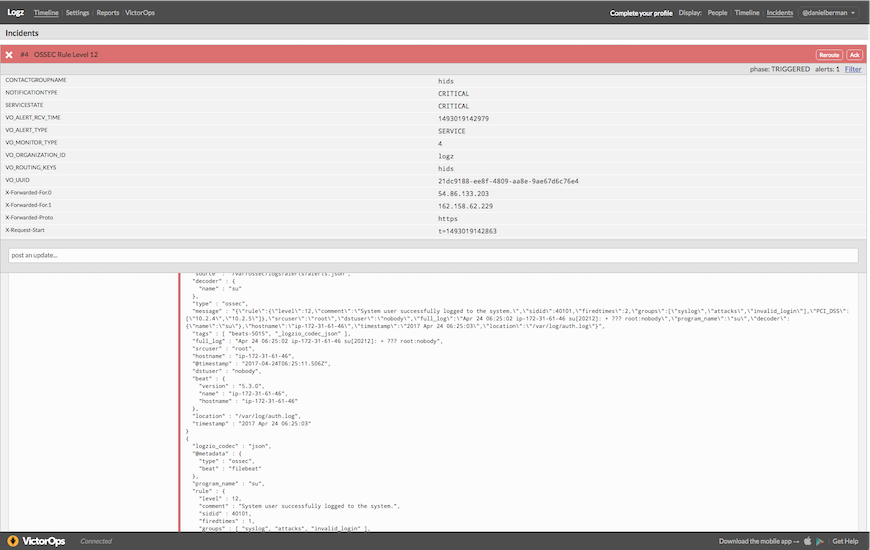
As you will see, the “state_message” field includes samples of the event. To reduce the amount of “log noise,” Logz.io will send a maximum of five samples of the same event.
It’s now up to you to manage the incident — use VictorOps features to “Ack,” reroute it to a different team, or resolve it.
Summary
Getting notified when a specific log message is recorded has huge benefits when monitoring mission-critical applications and services. It allows you to get notified, in real time, when something out of the ordinary is happening in your environment.
More on the subject:
Logz.io Alerts, an enterprise-grade alerting mechanism built on top of the ELK Stack, allows you to combine real-time reporting and logging with any platform you may be used for incident management and messaging. Incident management tools such as VictorOps allow you and your team to effectively handle these critical events on time.
In three words, this is called proactive log analysis.

You Might Also Like

The Cardinality Challenge in Monitoring

