
Logs or Metrics – A Conceptual Decision
July 24, 2017
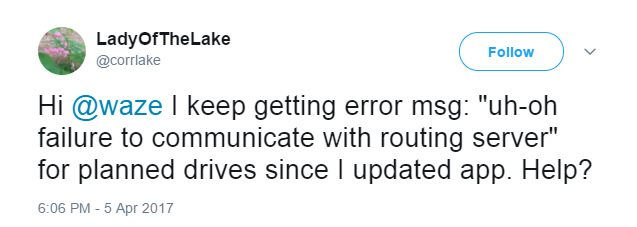
Maintaining a cloud production environment is not an easy task. Just ask Amazon, WhatsApp, or Waze:
There are endless suggestions, best practices, and tips on how to keep production environments stable and prevent service outages. But let’s face it, there will always be problems that must be detected early, handled correctly and speedily, and learned from for the future.
To achieve these objectives, production environments must be monitored closely and every event must be recorded and studied.
I bet the first thing that came to mind when you read the last sentence was, “Wow, that’s a lot of data!” The infrastructure of even a basic cloud-based application consists of multiple possible points of failure—potentially involving services, containers, UIs, and integrations.
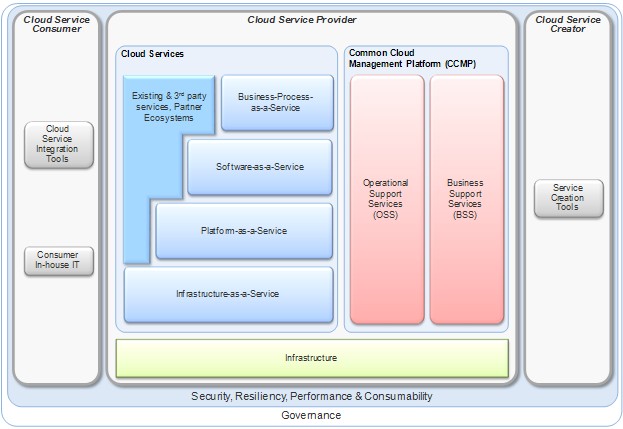
Figure 1—Cloud application architecture*
Source: Dustin’s Blog
At present, software monitoring is generally accomplished by one of three methods: logs, metrics, or a combination of both. These methods assist in collecting and processing production data, but poor implementation can cause chaos, distort significant information, and obstruct problem handling.
Why Metrics?
As explained above and shown in Figure 1, even a simple cloud-based application relies on several components that are all deployed in an environment that DevOps teams find very hard to control. If one of these components fails to function as expected, the whole application might be in jeopardy.
Metrics help measure component functionality and define thresholds for attention-required usage. Metrics give DevOps engineers the ability to assess service value over time and provide a continuous view of the whole environment. There is an infinite number of metrics that can be used to evaluate an application, so it is important to specify the business-critical functionality and build the metrics plan accordingly.
Basic metrics such as transaction throughput and response time are applicable for all applications, while clicks-per-second or new users per month are used for more sophisticated use cases. Metrics are not only relevant for the code, but can also be applied to the containers hosting the services. Metrics such as tasks/consumption/memory and network throughput help DevOps teams to understand the velocity and efficiency of a system and determine the level of readiness for traffic spikes or continuous load.
For serverless applications, metrics are absolutely crucial—container startup time, response time, and average container execution time reflect the application usage and the platform’s ability to satisfy the application’s needs.
Metrics are relatively easy to implement, but once in place, they can pose a scaling challenge as the data and required infrastructure grow. There are, however, several tools that can monitor cloud services, and the information gathered is used for the metrics. When the services load requires scaling, these monitoring tools know to collect the same data for the new instances, so the metrics automatically contain the new data and require zero manual intervention.
Using metrics has its disadvantages. To obtain data for each metric, an event must be generated for each occurrence of the activities being measured. Designing and implementing these events is an extra task in every development assignment, and the service overhead — including memory usage and service uptime — should also be taken into account.
Also, as implied above, metrics are easy to create and store, so inexperienced teams might make the mistake of creating too many and may not be able to choose the metrics relevant to them. Metrics are good for identifying trends, relating application behavior to groups of events, and foreseeing system deficiencies — an action that helps to avoid customer-facing issues, particularly around performance.
Why Logs?
Metrics are critical to have an overview of how cloud-deployed software behaves over time and informs decisions on the improvement of deployment and maintenance processes.
But many developers find metrics to be insufficient and sometimes not even useful. While metrics show the tendencies and propensities of a service or an application, logs focus on specific events. The purpose of logs is to preserve as much information—mostly technical—as possible on a specific occurrence. The information in logs can be used to investigate incidents and to help with root-cause analysis of the faults or defects but also for a growing amount of additional use cases.
Another aspect where metrics differ from logs is that logs can be unique in each R&D team (application logs for example), and are structured according to either the needs of the incident investigation team or the system that collects and analyzes them. Logs attend to some other aspects of monitoring—identifying security breach attempts and misuse of the application’s functionality, and maintaining records for legal compliance needs.
But logs aren’t easy to use either. They require bigger storage and have more complicated processing procedures than metrics. Implemented incorrectly, they contain a large amount of unusable data concealing the pieces of information actually required for the analysis process.
When logs look like this, it is not clear where the error is, when it happened, what caused it, and how to understand its origins:
20170330 19-13-01.654 LicenseManager - check license mode
20170330 19-13-01.738 TrayIconManager - IconManager - init
20170330 19-13-01.738 TrayIconManager - No icon UI mode
20170330 19-13-01.745 TrayIconManager - No icon UI mode
20170330 19-13-01.768 TrayIconManager - No icon UI mode
20170330 19-13-01.800 ProcessWatchDog - starting to watch process: 5716 on platform: win32
20170330 19-13-02.843 DirectChannel - Connect called for direct channel client of tunnel LWE-PMR
20170330 19-13-02.845 DirectChannel - Connect called for direct channel client of tunnel LWE-PMR
20170330 19-13-02.848 DirectChannel - init direct channel client for tunnel LWE-PMR
20170330 19-13-02.850 Engine.ChannelManager - onListening: listening to:  SDK
20170330 19-13-02.850 ERROR LightWeight.Dispatcher - onListening: no listening event from  { target: 'SDK' }
20170330 19-13-02.850 DirectChannelListener - DirectChannelListener.clientConnected : Client has connect
20170330 19-13-02.850 Engine.ChannelManager - onConnect: got connection from PackageManager with id: 1
20170330 19-13-02.850 LightWeight.Dispatcher - onConnect: Got connection from  { target: 'PackageManager_1' }
20170330 19-13-02.850 PackagesManager.ChannelManager - onConnect: got connection from lwe with id: undefined
20170330 19-13-02.850 Dispatcher - onConnect: Got connection from  { target: ’?????’}
20170330 19-13-02.850 Dispatcher - connected: { target: ’?????’}
20170330 19-13-02.850 Dispatcher - onConnect: Got connection to the parent dispatcher going to send registration message
20170330 19-13-02.850 LightWeight.Dispatcher - registerDispatcher: Got registration from  PackageManager_1
20170330 19-13-02.850 ERROR SessionManager - packageManagerConnected: Failed connection to  { target: 'PackageManager_1' }
20170330 19-13-02.850 LightWeight.Dispatcher - registerDispatcher:
Log output should be planned and tested like any other application functionality, so that when push comes to shove the necessary information is available, clear, and useful. In order to be effective, logs should meet specific standards, such as displaying human-readable language and date time in a clear format, highlighting errors and having context for each record.
What About Tracing?
Tracing is another way to keep track of the environment status, allowing developer-level logging.
When logs are configured to trace level, all communications, events and data are recorded, creating many different types of records. Most of these are not localized, meaning they are not readable, some might even expose sensitive information.
Several approaches hold the view that tracing is the right way to log all activities in the ecosystem, but only when done right. If tracing is not following a clear set of rules, the immense amount of data in the logs obscures important data and requires a deeper examination to collect relevant information. Incorrect implementation of tracing can also affect the performance of the system, as a huge amount of data is being registered in the logs, and every action is being documented thoroughly.
Tracing is recommended only for power users with a genuine need for the low-level data.
So, What Method Should I Use?
As explained above, metrics and logs address two different needs of cloud applications and are both critical to the business.
Metrics can be used to monitor performance, recognize events of importance, and facilitate prediction of future lapses. Logs are usually used for troubleshooting issues, but also for analyzing user behavior, application metrics and a growing variety of additional use cases.
Metrics help with pointing out points of improvement for processes and allowing a birdseye view of the application. Logs are especially useful when they become practical—if the application is facing many functional problems and constantly requiring deep examination.
The good news is that DevOps teams do not necessarily need to choose one method over the other. Logs and metrics can be used in tandem. The bad news is that mastering both monitoring methods requires handling a huge amount of data and the ability to filter out the insubstantial information and focus on what is meaningful and relevant for application maintenance.
There are several tools designed to solve these problems, overseeing the monitoring process and extracting the significant data. These tools implement different mechanisms for collecting, analyzing and displaying the data in a manner that help to investigate problems and understanding consequences.
More on the subject:
Playing such a substantial part in the world of Big Data, logs and metrics require a profound solution for information extraction and segment intelligence so R&D and DevOps teams do not have to filter through the data themselves. The ELK Stack does exactly that, helping to store and analyze big data and then retrieve and display trends and insights about the application and its resources.

You Might Also Like

Tool Consolidation Is Dead. Long Live Agentic AI.

