
Introducing Scheduled Reporting
September 3, 2019
We’re happy to announce the release of Logz.io Reports — an easy way to set up scheduled reporting for both operational and security use cases.
Kibana dashboards provide you with a window into your environment, visualizing the different signals being tracked in a beautiful mix of graphs, charts, and maps. Often used in times of crisis and as the starting point for an investigation, dashboards can also be useful as a static reporting tool for multiple use cases.
You might need to send a daily system health report to your manager or other key stakeholders in the organization. Or, you might be required to save a weekly report on security events for compliance and auditing.
There are various ways to share or export dashboards with other team members, the simplest being using share URLs or the Snapshots feature we developed on top of Kibana. You can even use the Snapshots API to set up a script that automates the process.
But this is not the type of user-friendly experience we want to provide our users with. A much simpler approach is required. And that’s where Logz.io Reports come into the picture. More on the subject:
End-to-end reporting automation
Simply put, Logz.io Reports allow you to automatically generate a report — in essence a snapshot of a Kibana dashboard — on a regular schedule and covering a time range of your choice.
Reports can be managed and created from the new Reports page located under Alerts & Events (Logz.io Security Analytics users will see the page appear as a separate tab in the top menu).
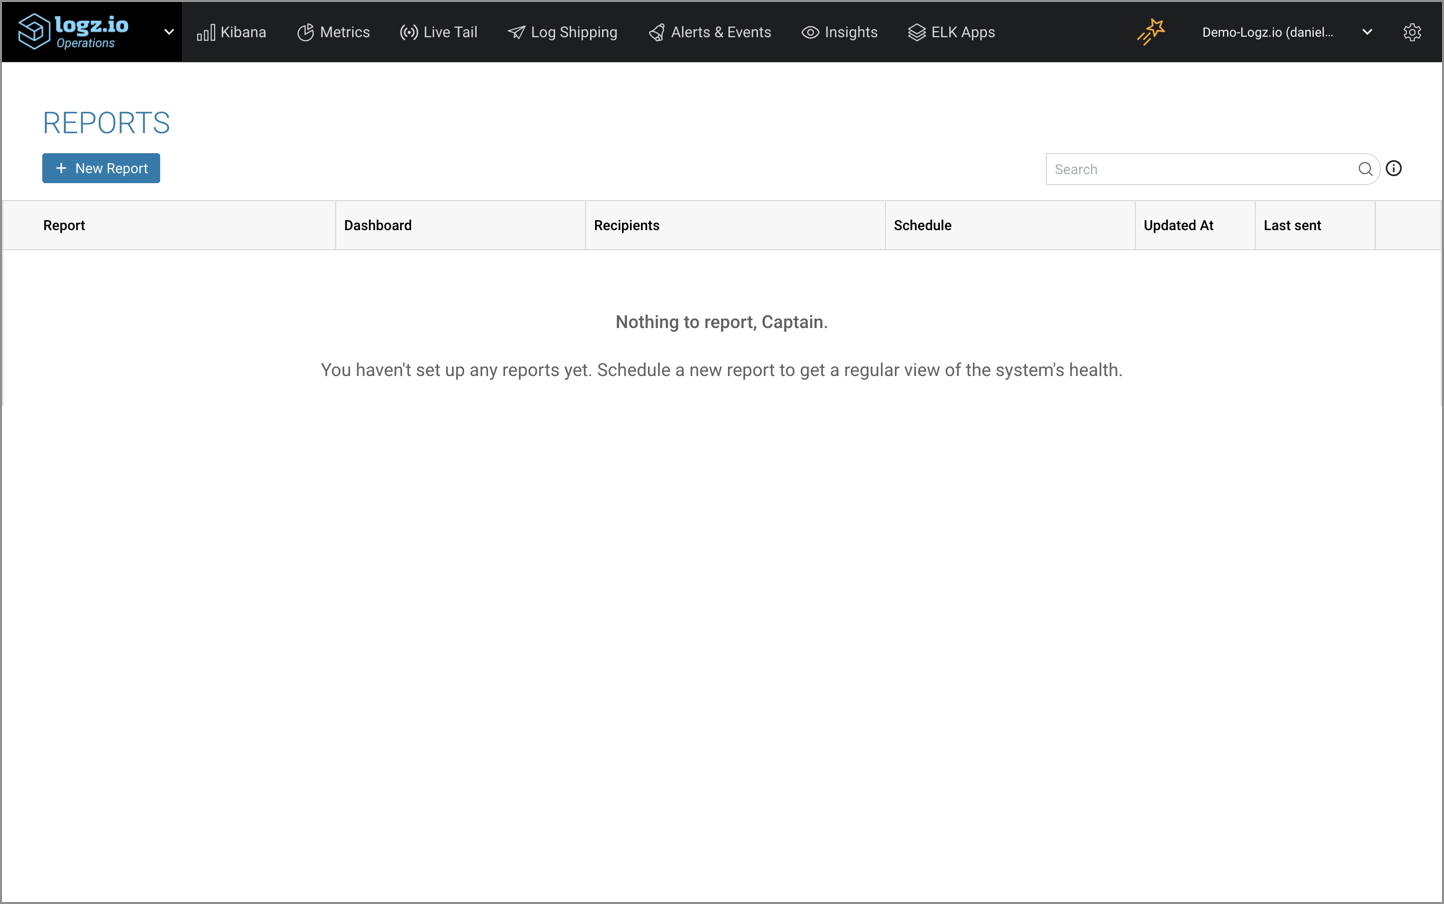
Hitting the + New Report button, you’re presented with the New report page where you can totally customize what report to send, when to send it and to whom.

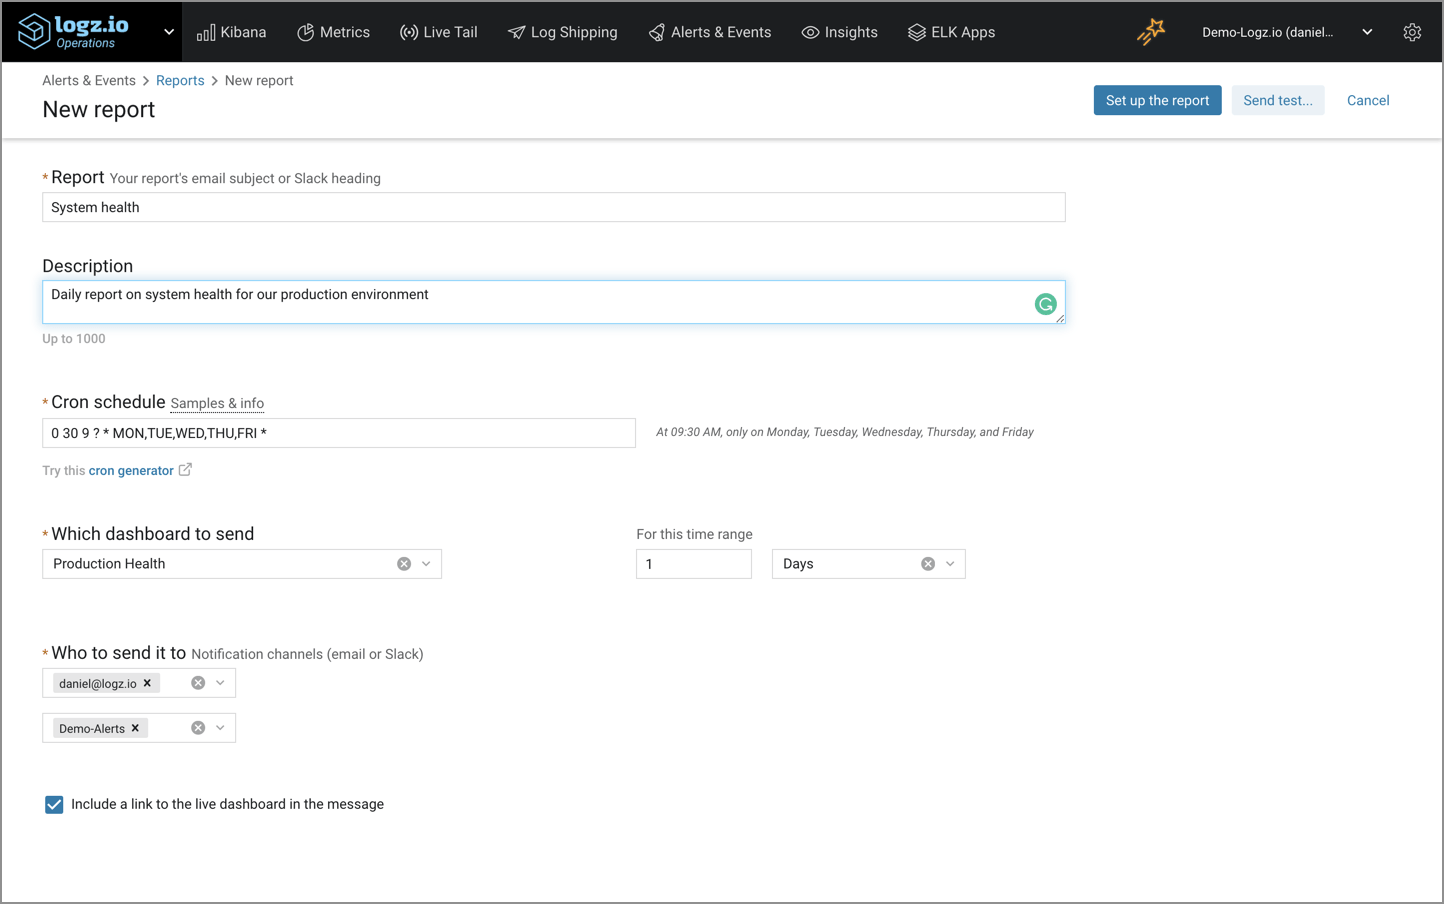
Start by giving your report a name (depending on how you decide to distribute the report, this name will appear as an email subject or Slack notification heading) and a description.
Next, set up a cron schedule for generating the report. If you’re not an expert at cron scheduling, no worries — use the provided examples and link to an online tool. You’ll quickly get the hang of it.
You then need to decide what Kibana dashboard to send as the basic of your report, from what time frame and who to send it to. As mentioned before, Reports support email or Slack endpoints at this stage.
In the example below, we’re sending a “Production Health” dashboard at 9:00 AM every weekday via email and Slack:
If you’re not sure if this is the report you want to send, you can give it a dry run! Click Send test… in the top-right corner of the page, select an endpoint to send the test report to, and within a minute or two you’ll receive a sample report.
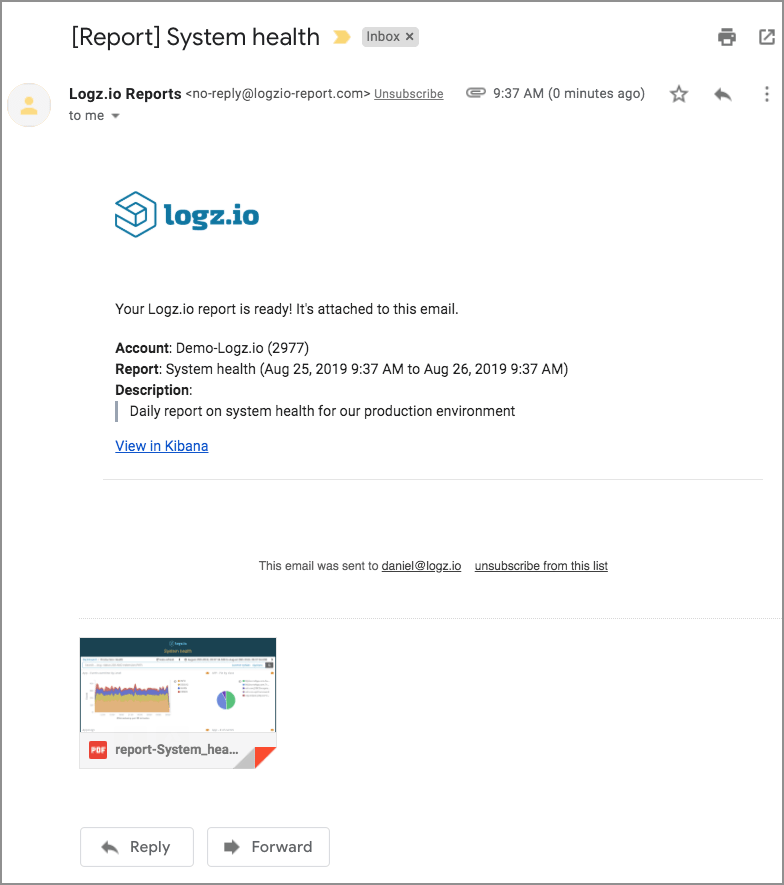
As seen above, the report itself consists of some metadata information such as the Logz.io account sending the report and its description and of course the dashboard itself in PDF format.
If satisfied, you’re ready to create the report. To do this, simply hit Set up the report. The report is created and added to the list on the Reports page.
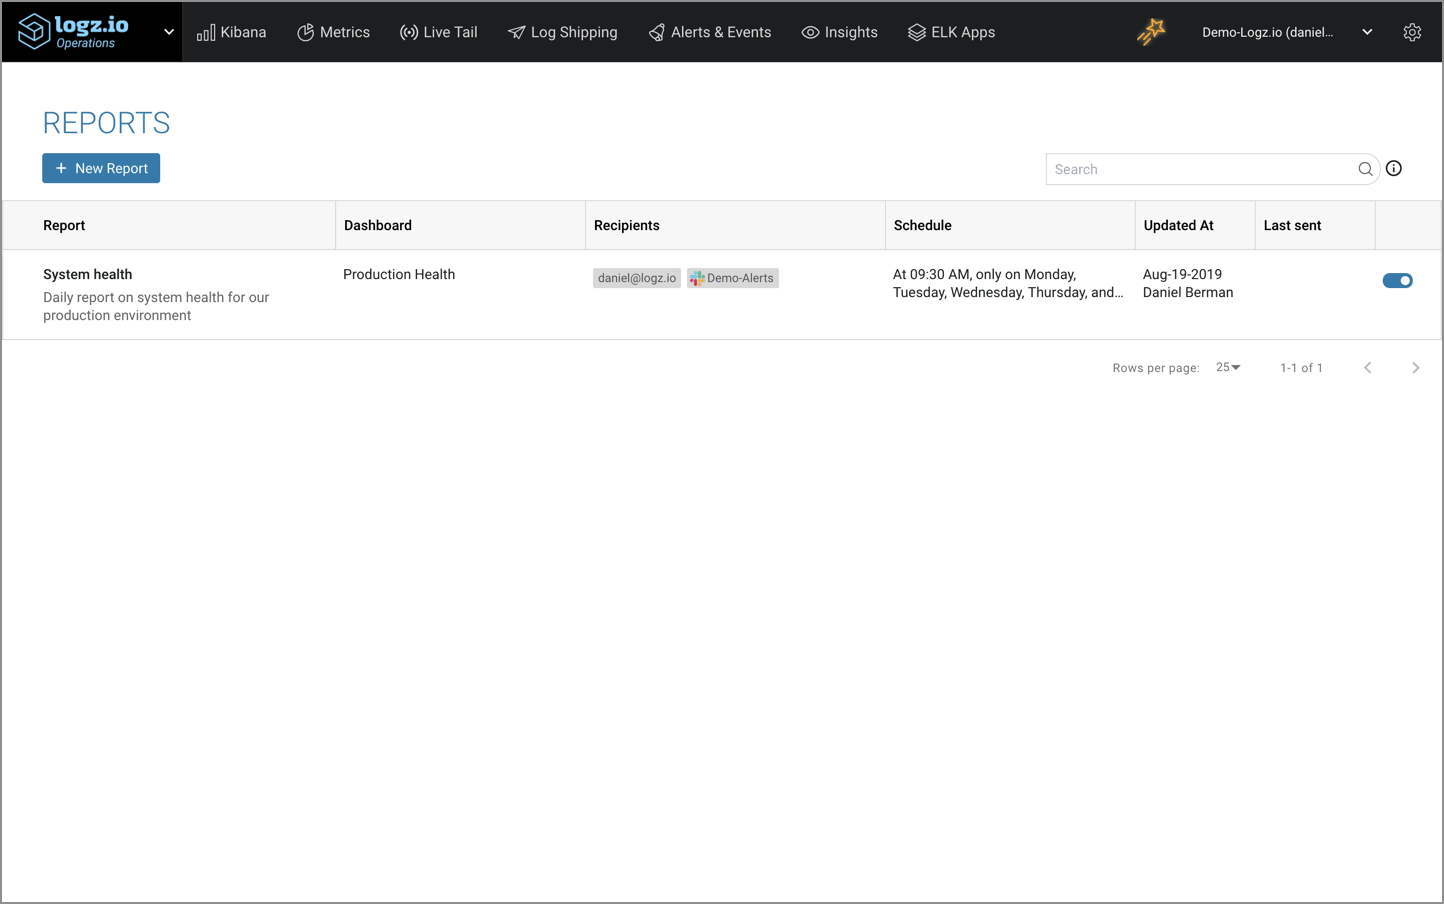
Managing your reports
Need to tweak a report? Turn reporting off for another? Maybe you’d like to totally remove a report from the list?

All of these actions are available on the Reports page, making managing your reports an extremely easy task.
Endnotes
To sum it up, Logz.io Reports provides you with an easy way to automate the generation and sending of Kibana dashboards as reports, helping you ensure the right people are receiving the right information at the right time.
Reports are available in all our plans, the only limit being a max of 50 active reports per account.
As with any new feature, we’d love to get your input. If you have any feedback whatsoever, feel free to let us know at: info@logz.io.
Happy reporting!

You Might Also Like

Prometheus Roadmap and Latest Updates

