
Open Distro for Elasticsearch – How Different Is It?
April 24, 2019
Last month, AWS announced an initiative called Open Distro for Elasticsearch. Since then, there has been a lot of debate as to what this move means for the future of the ELK Stack and the community. What are the motives behind this move? Does this split actually signify a fork? More on the subject:
While these questions are extremely important to answer, I’m not going to attempt to answer them here. What I do think might benefit end users at this point is an understanding of what this new stack (yes, it’s not just Elasticsearch) actually includes in comparison to Elastic’s open source and commercial repositories, and how to get started.
A few clarifications
We will take a closer look at specific features included in the project later on, but just to make things clear — Open Distro for Elasticsearch, despite the misleading name that hopefully will be changed soon, does not include only Elasticsearch but also Kibana and some additional plugins. It does NOT include Logstash or any of the Beats. The Elasticsearch and Kibana version currently used is 6.6.2 and Kibana 6.5.4.
A second point worth pointing out, and this is probably obvious — at version 0.8.0 Open Distro for Elasticsearch is not production-ready. There are some nifty features included in the package but I think we still have some time to wait until version 1.0.0.
Installing Open Distro for Elasticsearch
Currently, the project supports two installation methods – via RPM package or suing Docker images. Since I have Docker Desktop installed on my Mac, I opted for the latter.
You can pull and run the individual Elasticsearch and Kibana images if you like, but the easier option is using docker-compose. One important note if you’re using Docker Desktop — be sure to allocate at least 8GB of RAM to the program (Preferences → Advanced).
Create a docker-compose.yml file:
sudo mkdir open-distro-elasticsearch
cd open-distro-elasticsearch
sudo vim docker-compose.yml
Paste the following configuration:
version: '3'
services:
  odfe-node1:
    image: amazon/opendistro-for-elasticsearch:0.7.0
    container_name: odfe-node1
    environment:
      - cluster.name=odfe-cluster
      - bootstrap.memory_lock=true # along with the memlock settings below, disables swapping
      - "ES_JAVA_OPTS=-Xms512m -Xmx512m" # minimum and maximum Java heap size, recommend setting both to 50% of system RAM
    ulimits:
      memlock:
        soft: -1
        hard: -1
    volumes:
      - odfe-data1:/usr/share/elasticsearch/data
    ports:
      - 9200:9200
      - 9600:9600 # required for Performance Analyzer
    networks:
      - odfe-net
  odfe-node2:
    image: amazon/opendistro-for-elasticsearch:0.7.0
    container_name: odfe-node2
    environment:
      - cluster.name=odfe-cluster
      - bootstrap.memory_lock=true
      - "ES_JAVA_OPTS=-Xms512m -Xmx512m"
      - discovery.zen.ping.unicast.hosts=odfe-node1
    ulimits:
      memlock:
        soft: -1
        hard: -1
    volumes:
      - odfe-data2:/usr/share/elasticsearch/data
    networks:
      - odfe-net
  kibana:
    image: amazon/opendistro-for-elasticsearch-kibana:0.7.0
    container_name: odfe-kibana
    ports:
      - 5601:5601
    expose:
      - "5601"
    environment:
      ELASTICSEARCH_URL: https://odfe-node1:9200
    networks:
      - odfe-net

volumes:
  odfe-data1:
  odfe-data2:

networks:
  odfe-net:
As you can see, there are no big surprises here, with the regular ports for Elasticsearch and Kibana mapped (9200/5601) as well as an additional port for the Perf Analyzer (9600). Memory swap is disabled and JVM heap size set.
It’s time to deploy the images:
docker-compose up
Docker will take a while to download the images and run the containers, but when done, you’ll see two Elasticsearch containers and one Kibana container running:
docker ps

CONTAINER ID        IMAGE                                              COMMAND                  CREATED             STATUS              PORTS                                                      NAME
9873efd238ab        amazon/opendistro-for-elasticsearch:0.7.0          "/usr/local/bin/dock…"   About a minute ago   Up About a minute   9200/tcp, 9300/tcp, 9600/tcp                               odfe-node2
e3d5558670df        amazon/opendistro-for-elasticsearch-kibana:0.7.0   "/usr/local/bin/kiba…"   About a minute ago   Up About a minute   0.0.0.0:5601->5601/tcp                                     odfe-kibana
1cb902342766        amazon/opendistro-for-elasticsearch:0.7.0          "/usr/local/bin/dock…"   About a minute ago   Up About a minute   0.0.0.0:9200->9200/tcp, 0.0.0.0:9600->9600/tcp, 9300/tcp   odfe-node1
Once you’ve verified all the containers are up and running as expected, we can test our stack by querying Elasticsearch and opening Kibana in our browser.
Now, one key difference compared to what we’ve been used to with the ELK Stack is that the security plugin is enabled by default.
Opening the Elasticsearch configuration file (on Docker container, located at: /usr/share/elasticsearch/elasticsearch.yml) this difference is quickly apparent:
cluster.name: "docker-cluster"
network.host: 0.0.0.0

# minimum_master_nodes need to be explicitly set when bound on a public IP
# set to 1 to allow single node clusters
# Details: https://github.com/elastic/elasticsearch/pull/17288
discovery.zen.minimum_master_nodes: 1

######## Start OpenDistro for Elasticsearch Security Demo Configuration ########
# WARNING: revise all the lines below before you go into production
opendistro_security.ssl.transport.pemcert_filepath: esnode.pem
opendistro_security.ssl.transport.pemkey_filepath: esnode-key.pem
opendistro_security.ssl.transport.pemtrustedcas_filepath: root-ca.pem
opendistro_security.ssl.transport.enforce_hostname_verification: false
opendistro_security.ssl.http.enabled: true
opendistro_security.ssl.http.pemcert_filepath: esnode.pem
opendistro_security.ssl.http.pemkey_filepath: esnode-key.pem
opendistro_security.ssl.http.pemtrustedcas_filepath: root-ca.pem
opendistro_security.allow_unsafe_democertificates: true
opendistro_security.allow_default_init_securityindex: true
opendistro_security.authcz.admin_dn:
  - CN=kirk,OU=client,O=client,L=test, C=de

opendistro_security.audit.type: internal_elasticsearch
opendistro_security.enable_snapshot_restore_privilege: true
opendistro_security.check_snapshot_restore_write_privileges: true
opendistro_security.restapi.roles_enabled: ["all_access", "security_rest_api_access"]
cluster.routing.allocation.disk.threshold_enabled: false
node.max_local_storage_nodes: 3
And Kibana’s configuration (on Docker container, located at config/kibana.yml):
server.name: kibana
server.host: "0"
elasticsearch.url: https://localhost:9200
elasticsearch.ssl.verificationMode: none
elasticsearch.username: kibanaserver
elasticsearch.password: kibanaserver
elasticsearch.requestHeadersWhitelist: ["securitytenant","Authorization"]

opendistro_security.multitenancy.enabled: true
opendistro_security.multitenancy.tenants.preferred: ["Private", "Global"]
opendistro_security.readonly_mode.roles: ["kibana_read_only"]
So using the default authentication credentials, admin: admin, we will first query Elasticsearch:
curl -XGET https://localhost:9200 -u admin:admin --insecure

{
  "name" : "28j31GT",
  "cluster_name" : "odfe-cluster",
  "cluster_uuid" : "xIMhCp8zR1CVM0t3mfFYow",
  "version" : {
    "number" : "6.5.4",
    "build_flavor" : "oss",
    "build_type" : "tar",
    "build_hash" : "d2ef93d",
    "build_date" : "2018-12-17T21:17:40.758843Z",
    "build_snapshot" : false,
    "lucene_version" : "7.5.0",
    "minimum_wire_compatibility_version" : "5.6.0",
    "minimum_index_compatibility_version" : "5.0.0"
  },
  "tagline" : "You Know, for Search"
}
And then access Kibana at: http://localhost:5601:

Security plugin
Security is the most meaningful open source addition to the ELK Stack and as such deserves a followup article. Still, some points are worth mentioning.
AWS concurs that most of the security features in Open Distro for Elasticsearch are based on Search Guard code, developed together with floragunn, the developers of Search Guard.
Anyone familiar with this security plugin for ELK will find a lot of the same functionality. Role-based access, user control and mapping, audit logging, API, AD and LDAP support — these are all part and parcel of the security plugin.

As mentioned above, Open Distro for Elasticsearch will authenticate with some default credentials (admin:admin) but you should definitely change those after setup.
You can of course disable security if you like by adding the following line to your elasticsearch.yml file:
opendistro_security.disabled: true
Alerting plugin
Open Distro for Elasticsearch provides a built-in mechanism for sending an alert when an Elasticsearch index meets a threshold and conditions that you define.
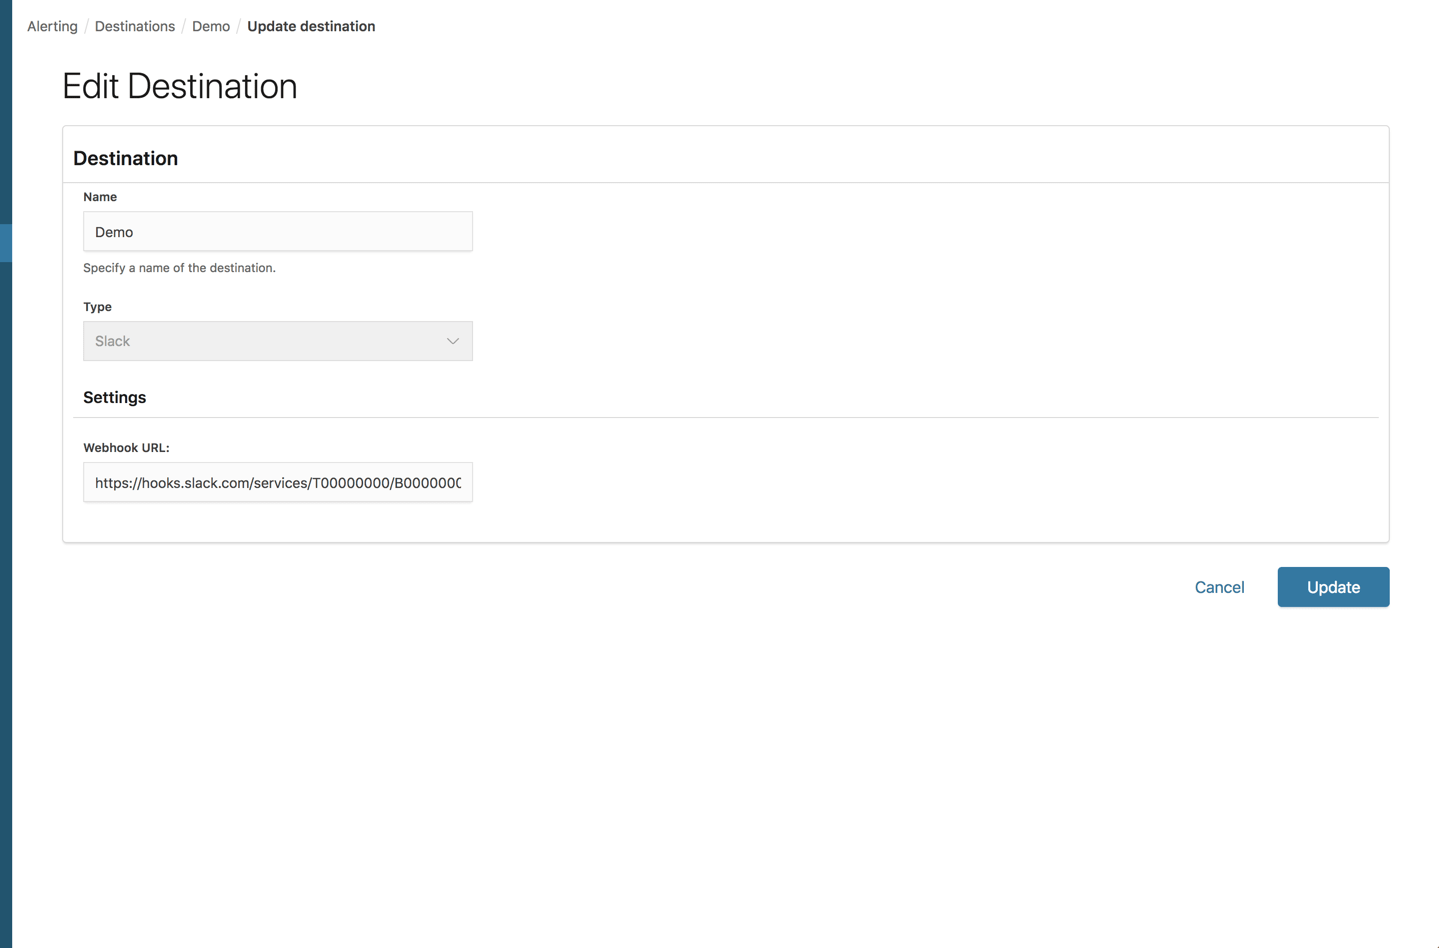
On the new Alerts page in Kibana, you will find a tab where you can define where you want to send the alert to (destination). Currently, Slack and AWS Chime are the only built-in destinations.
The alerts themselves are configured on the Monitors tab. Here you define the schedule of the alert (i.e. when you want the monitor to run) and the specific query you want to run against your Elasticsearch indices. You can build the query itself or use a graph as a visual aid to building the query.
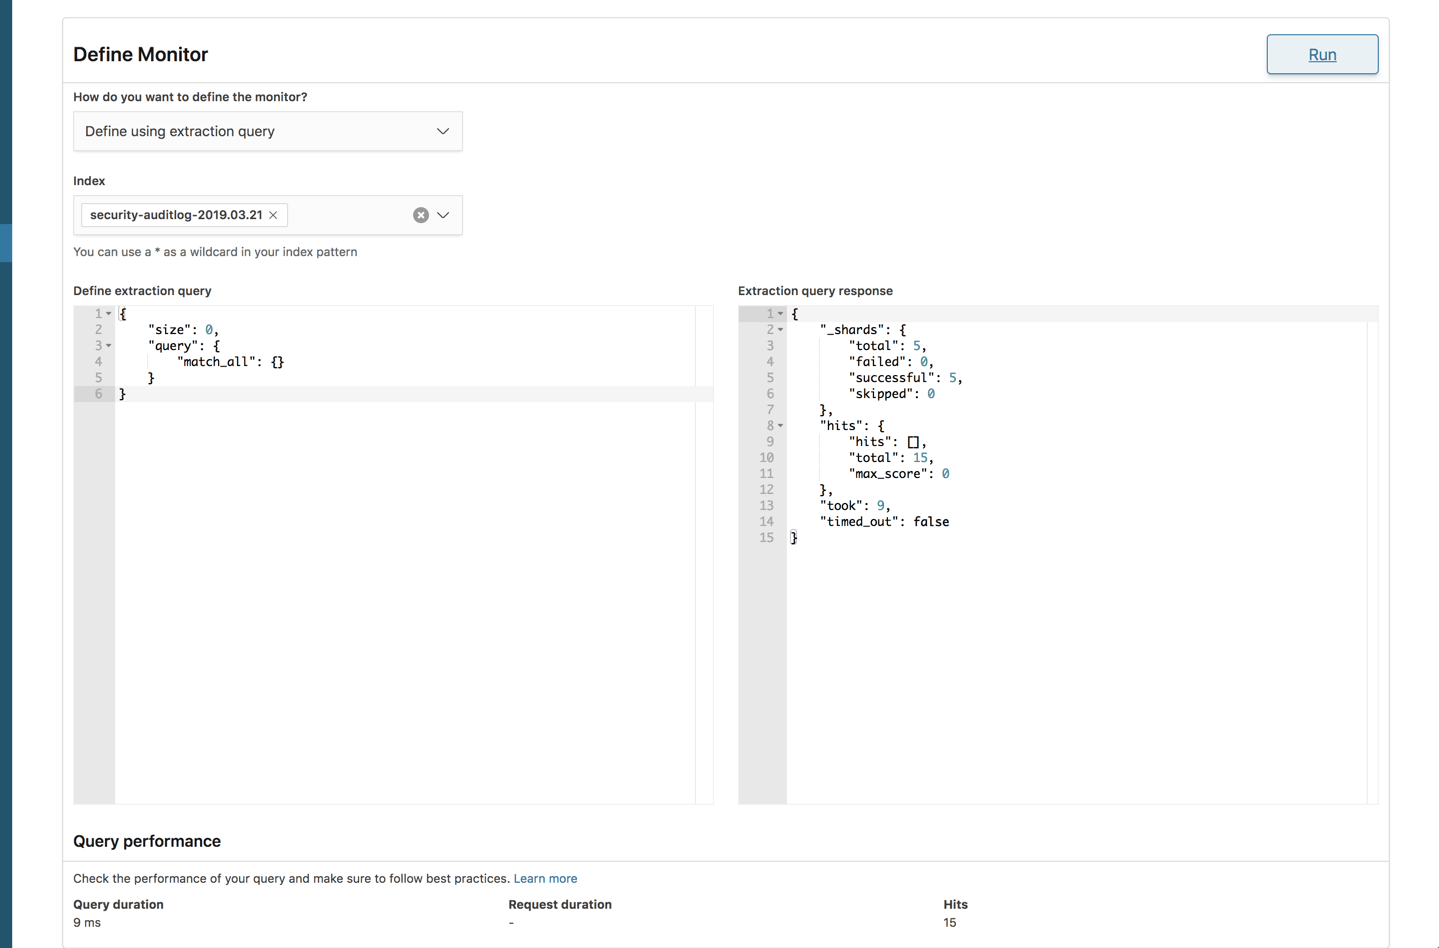
You then need to build what’s called a trigger which defines the specific condition that the monitor checks and an action to execute when an alert is triggered.
After an initial look, I would carefully say that the alerting mechanism in Open Distro for Elasticsearch is still a bit raw at the edges and immature but let’s wait and see how it evolves.
Performance Analyzer
A known pain point with handling Elasticsearch is monitoring performance. The Performance Analyzer plugin is an agent that can be installed locally and used to query performance metrics on your cluster.
First, you’ll need to download the Performance Analyzer from: https://opendistro.github.io/for-elasticsearch/downloads.html
Extract it, and access the main installation folder:
sudo unzip perf-top-0.7.0.0-MACOS.zip
cd perf-top-0.7.0.0-MACOS
In the dashboards folder, you’ll see four provided dashboards which we can use to monitor our Elasticsearch cluster: ClusterNetworkMemoryAnalysis.json, ClusterOverview.json, ClusterThreadAnalysis.json and NodeAnalysis.json. You can also create your own dashboards for monitoring other metrics.
The syntax for using the Performance Analyzer specifies the dashboard name and an endpoint for the cluster, in our case, our local cluster (remember, we opened port 9600 when deploying the cluster):
./perf-top-macos --dashboard dashboards/ClusterNetworkMemoryAnalysis.json --endpoint localhost:9600
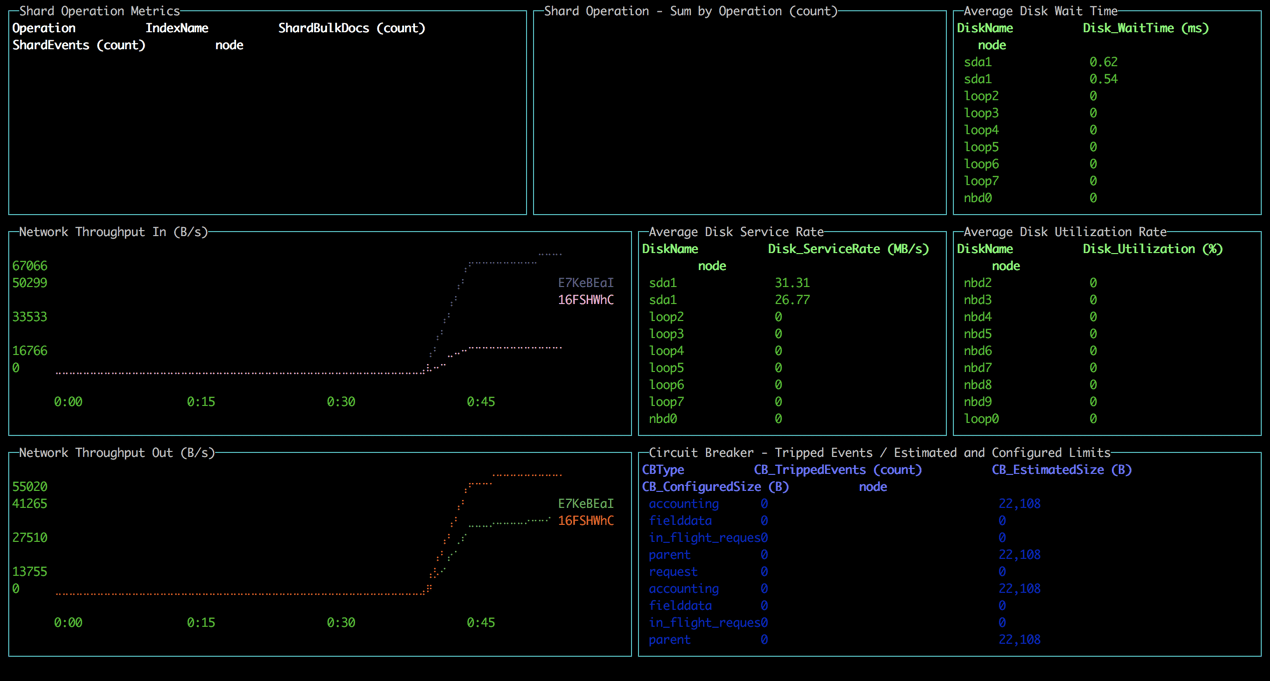
All in all, the tool is easy to install and use but of course lacks the ability to perform analysis over time.
Side-by-side
So is all the fuss we’ve seen in the ELK community warranted?
From a features perspective, all versions support the key functionality provided in Elasticsearch and Kibana — data indexing, searching, aggregation and analysis.
The added plugins provided in Open Distro for Elasticsearch are more or less on par with the corresponding features in the ELK Stack available under the Basic license. The only exception here is the Alerting feature, which seems to be a nice first step, if somewhat more complicated to use.
Here’s a comparison that sums up the key differences. I’m comparing Open Distro for Elasticsearch with the open source ELK Stack and the commercial version of the ELK Stack:
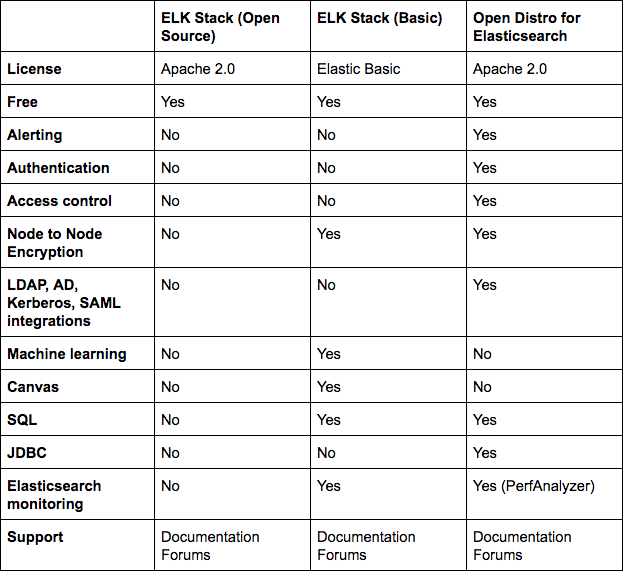
The biggest difference, of course, is licensing. This was the key driver behind the project to start with. The additional plugins reviewed above are all Apache 2.0 licensed and completely open sourced compared to the same features in the ELK Stack. For many users, the fact that they can freely use security, alerting, and the other plugins provided in Open Distro for Elasticsearch that I didn’t mention here — JDBC and SQL, makes all the difference.
Everything comes at a cost
I’d like to end this review with another point that I think is worth mentioning — the cost.
If it’s open source then there is no cost, right? Well, we’ve been very clear in the past on what it entails to maintain the ELK Stack at scale. Handling large data pipelines in production, deploying buffering mechanisms, monitoring your Elasticsearch cluster and maintaining it, handling upgrades — all these will come at a cost. There is little to no difference between Open Distro for Elasticsearch and Elastic’s ELK Stack when looking at the real costs of doing ELK on your own.
I think it’s great to see how more groups are contributing to the ecosystem and I believe that at the end of the day, this new development will benefit ELK users by driving new innovation and developing the stack.
Reiterating what I said in the introduction, Open Distro for Elasticsearch is not production-ready. Proceed with caution!

You Might Also Like

The Complete Guide to Capacity Management in Kubernetes

