
How to Install the ELK Stack on AWS: A Step-By-Step Guide
April 16, 2019
The ELK Stack is a great open-source stack for log aggregation and analytics. It stands for Elasticsearch (a NoSQL database and search server), Logstash (a log shipping and parsing service), and Kibana (a web interface that connects users with the Elasticsearch database and enables visualization and search options for system operation users). With a large open-source community, ELK has become quite popular, and it is a pleasure to work with. In this article, we will guide you through the simple installation of the ELK Stack on AWS, or Amazon Web Services.
The following instructions will lead you through the steps involved in creating a working sandbox environment. Due to the fact that a production setup is more comprehensive, we decided to elaborate on how each component configuration should be changed to prepare for use in a production environment.
We’ll start by describing the environment, then we’ll walk through how each component is installed, and finish by configuring our sandbox server to send its system logs to Logstash and view them via Kibana.

AWS Environment: What to know about putting the ELK Stack on AWS
We ran this tutorial on a single AWS Ubuntu 16.04 instance on an m4.large instance using its local storage. We started an EC2 instance in the public subnet of a VPC, and then we set up the security group (firewall) to enable access from anywhere using SSH and TCP 5601 (Kibana). Finally, we added a new elastic IP address and associated it with our running instance in order to connect to the internet.
Production tip: A production installation needs at least three EC2 instances — one per component, each with an attached EBS SSD volume.
Installing Elasticsearch
Elasticsearch is a widely used database and a search server, and it’s the main component of the ELK setup.
Elasticsearch’s benefits include:
- Easy installation and use
- A powerful internal search technology (Lucene)
- A RESTful web interface
- The ability to work with data in schema-free JSON documents (noSQL)
- Open source
There are various ways to install Elasticsearch but we will be using DEB packages.
To begin the process of installing Elasticsearch, add the following repository key:
wget -qO - https://artifacts.elastic.co/GPG-KEY-elasticsearch | sudo apt-key add -
Install the apt-transport-https package:
sudo apt-get install apt-transport-https
Add the following Elasticsearch list to the key:
echo "deb https://artifacts.elastic.co/packages/7.x/apt stable main" | sudo tee -a /etc/apt/sources.list.d/elastic-7.x.list
To install a version of Elasticsearch that contains only features licensed under Apache 2.0, use:
echo "deb https://artifacts.elastic.co/packages/oss-7.x/apt stable main" | sudo tee -a /etc/apt/sources.list.d/elastic-7.x.list
Update your system and install Elasticsearch with:
sudo apt-get update && sudo apt-get install elasticsearch
Open the Elasticsearch configuration file at: /etc/elasticsearch/elasticsearch.yml, and apply the following configurations:
network.host: "localhost"
http.port: 9200
cluster.initial_master_nodes: ["<PrivateIP"]
Start the Elasticsearch service:
sudo service elasticsearch start
Verify the installation by cURLing:
sudo curl http://localhost:9200
If the output is similar to this, then you will know that Elasticsearch is running properly:
{
 "name" : "ip-172-31-49-60",
 "cluster_name" : "elasticsearch",
 "cluster_uuid" : "yP0uMKA6QmCsXQon-rxawQ",
 "version" : {
   "number" : "7.0.0",
   "build_flavor" : "default",
   "build_type" : "deb",
   "build_hash" : "b7e28a7",
   "build_date" : "2019-04-05T22:55:32.697037Z",
   "build_snapshot" : false,
   "lucene_version" : "8.0.0",
   "minimum_wire_compatibility_version" : "6.7.0",
   "minimum_index_compatibility_version" : "6.0.0-beta1"
 },
 "tagline" : "You Know, for Search"
}
To make the service start on boot run:
sudo update-rc.d elasticsearch defaults 95 10
Production tip: DO NOT open any other ports, like 9200, to the world! There are many bots that search for 9200 and execute groovy scripts to overtake machines. DO NOT bind Elasticsearch to a public IP.
Installing Logstash
Logstash is an open-source tool that collects, parses, and stores logs for future use and makes rapid log analysis possible. Logstash is useful for both aggregating logs from multiple sources, like a cluster of Docker instances, and parsing them from text lines into a structured format such as JSON. In the ELK Stack, Logstash uses Elasticsearch to store and index logs.
Installing Java
Logstash requires the installation of Java 8 or Java 11:
sudo apt-get install default-jre
Verify that Java is installed:
java -version
If the output of the previous command is similar to this, then you’ll know that you’re heading in the right direction:
openjdk version "1.8.0_191"
OpenJDK Runtime Environment (build 1.8.0_191-8u191-b12-2ubuntu0.16.04.1-b12)
OpenJDK 64-Bit Server VM (build 25.191-b12, mixed mode)
Install Logstash with:
sudo apt-get install logstash
Example pipeline: Collect Apache Access Logs with Logstash
For the purpose of this tutorial, we’ve prepared some sample data containing Apache access logs that is refreshed daily.
Create a Logstash configuration file:
sudo vim /etc/logstash/conf.d/apache-01.conf
Enter the following configuration:
input {
  file {
    path => "/home/ubuntu/apache-daily-access.log"
  start_position => "beginning"
  sincedb_path => "/dev/null"
  }
}

filter {
  grok {
    match => { "message" => "%{COMBINEDAPACHELOG}" }
  }
  date {
    match => [ "timestamp" , "dd/MMM/yyyy:HH:mm:ss Z" ]
  }
  geoip {
    source => "clientip"
  }
}

output {
  elasticsearch {
  hosts => ["localhost:9200"]
  }
}
This file is telling Logstash to collect the local /home/ubuntu/apache-daily-access.log file and send it to Elasticsearch for indexing.
The input section specifies which files to collect (path) and what format to expect. The filter section is telling Logstash how to process the data using the grok, date and geoip filters. The output section defines where Logstash is to ship the data to – in this case, a local Elasticsearch.
More on the subject:
In this example, we are using localhost for the Elasticsearch hostname. In a real production setup, however, the Elasticsearch hostname would be different because Logstash and Elasticsearch should be hosted on different machines.
Production tip: Running Logstash and Elasticsearch is a very common pitfall of the ELK stack and often causes servers to fail in production. You can read some more tip on how to install ELK in production.
Finally, start Logstash to read the configuration:
sudo service logstash start
To make sure the data is being indexed, use:
sudo curl -XGET 'localhost:9200/_cat/indices?v&pretty'
You should see your new Logstash index created:
health status index                      uuid                   pri rep docs.count docs.deleted store.size pri.store.size
yellow open   logstash-2019.04.16-000001 rfA5aGYBTP6j27opDwD8VA   1   1          4168            0       230b           230b
You can set up your own ELK stack using this guide or try out our simple ELK as a Service solution.
Installing Kibana on AWS
Kibana is an open-source data visualization plugin for Elasticsearch. It provides visualization capabilities on top of the content indexed on an Elasticsearch cluster. Users can create bar, line, and scatter plots; pie charts; and maps on top of large volumes of data.
Among other uses, Kibana makes working with logs super easy and even fun, and its graphical web interface lets beginners execute powerful log searches.
To install Kibana, use this command:
sudo apt-get install kibana
Open the Kibana configuration file and enter the following configurations:
sudo vim /etc/kibana/kibana.yml
server.port: 5601
server.host: "localhost"
elasticsearch.hosts: ["http://localhost:9200"]
Start Kibana:
sudo service kibana start
Test:
Point your browser to ‘http://YOUR_ELASTIC_IP:5601’ after Kibana is started (this may take a few minutes).
You should see a page similar to this:

Your next step in Kibana is to define an Elasticsearch index pattern.
What does an “index pattern” mean, and why do we have to configure it? Logstash creates a new Elasticsearch index (database) every day. The names of the indices look like this: logstash-YYYY.MM.DD — for example, “logstash-2019.04.16” for the index we created above on April 16, 2019.
Kibana works on top of these Elasticsearch indices, so it needs to know which one you want to use. Go to Management -> Kibana Index Patterns. Kibana automatically identifies the Logstash index, so all you have to do is define it with ‘logstash-*:

In the next step, we will select the @timestamp timestamp field, and then click the “Create index pattern” button to define the pattern in Kibana.
Production tip: In this tutorial, we are accessing Kibana directly through its application server on port 5601, but in a production environment you might want to put a reverse proxy server, like Nginx, in front of it.
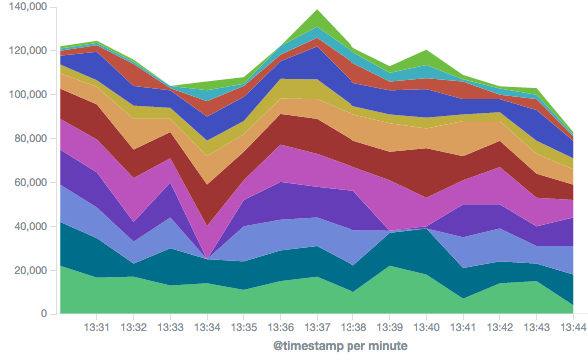
To see your logs, go to the Discover page in Kibana:

As you can see, creating a whole pipeline of log shipping, storing, and viewing is not such a tough task. In the past, storing, and analyzing logs was an arcane art that required the manipulation of huge, unstructured text files. But the future looks much brighter and simpler.

You Might Also Like

What’s New at Logz.io – January 2026

