
Announcing the Kibana Contest Finalists
October 2, 2017

Time flies when you’re having fun! Since announcing the Logz.io Kibana dashboard contest back in July, we’ve seen some great submissions showcasing Kibana’s visualization capabilities and a wide variety of use cases.
We’re now happy to reveal the final contenders and open voting to the community. Just a reminder — the winner receives a full package to AWS re:Invent 2017!
The finalists were selected based on the following criteria:
- Relevance and impact of the dashboard use case
- Number of visualizations
- Visualization types in the dashboard
To ensure the voting is as unbiased as possible, we’ve omitted any personal information on the submitters.
AWS Security
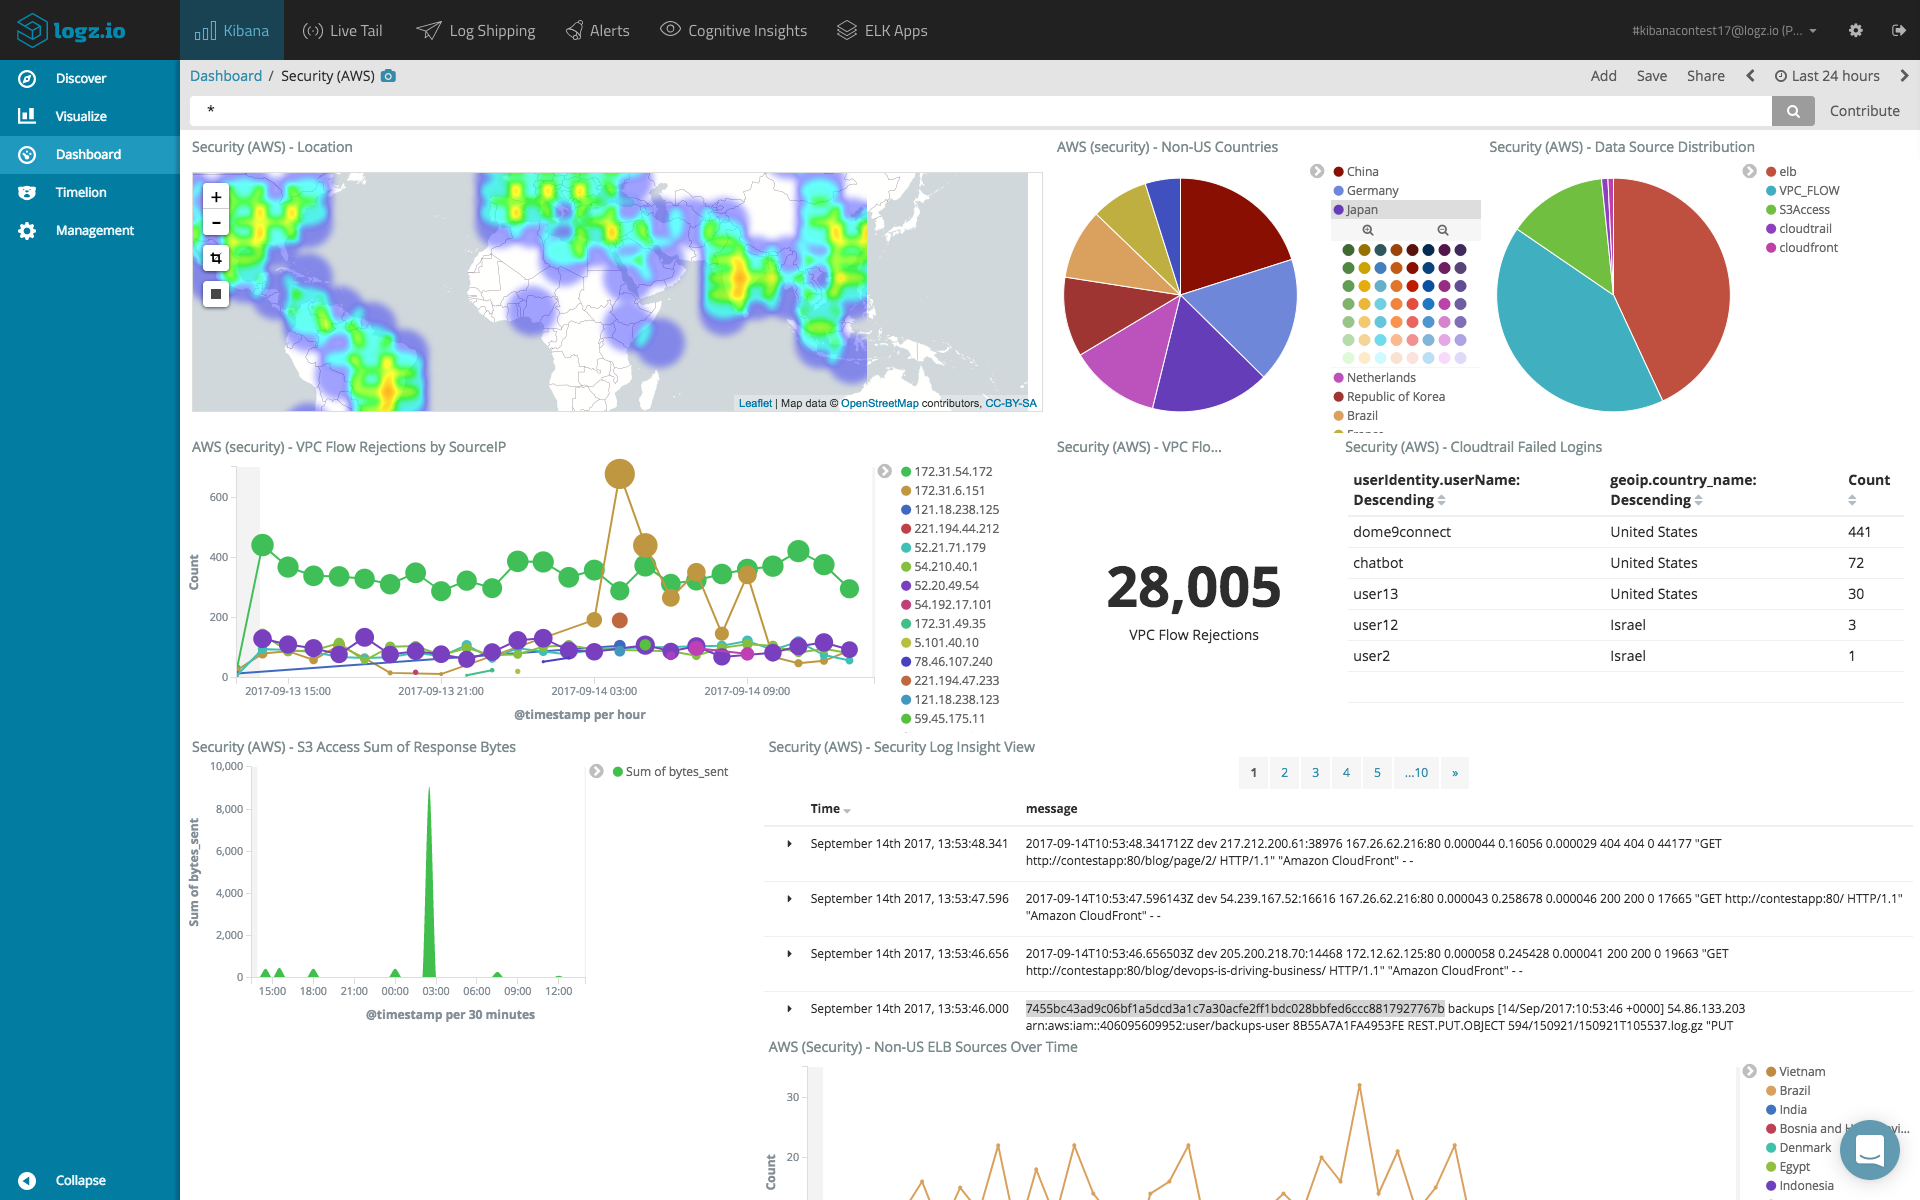
A large number of AWS-related dashboards were submitted but none were as interesting as this one — a comprehensive security dashboard that monitors data generated by a number of AWS services together.
The dashboard combines VPC Flow, ELB access, S3 access, CloudTrail and CloudFront logs to provide a beautiful representation of traffic flowing through and recorded by these services. The dashboard includes a geographic map for VPC traffic, a breakdown of failed logins by user based on CloudTrail data, VPC Flow rejections and more.
The logs were shipped using multiple methods, and included Logz.io’s built-in AWS support together with a Lambda function for streaming VPC FLow logs into Logz.io.
MongoDB
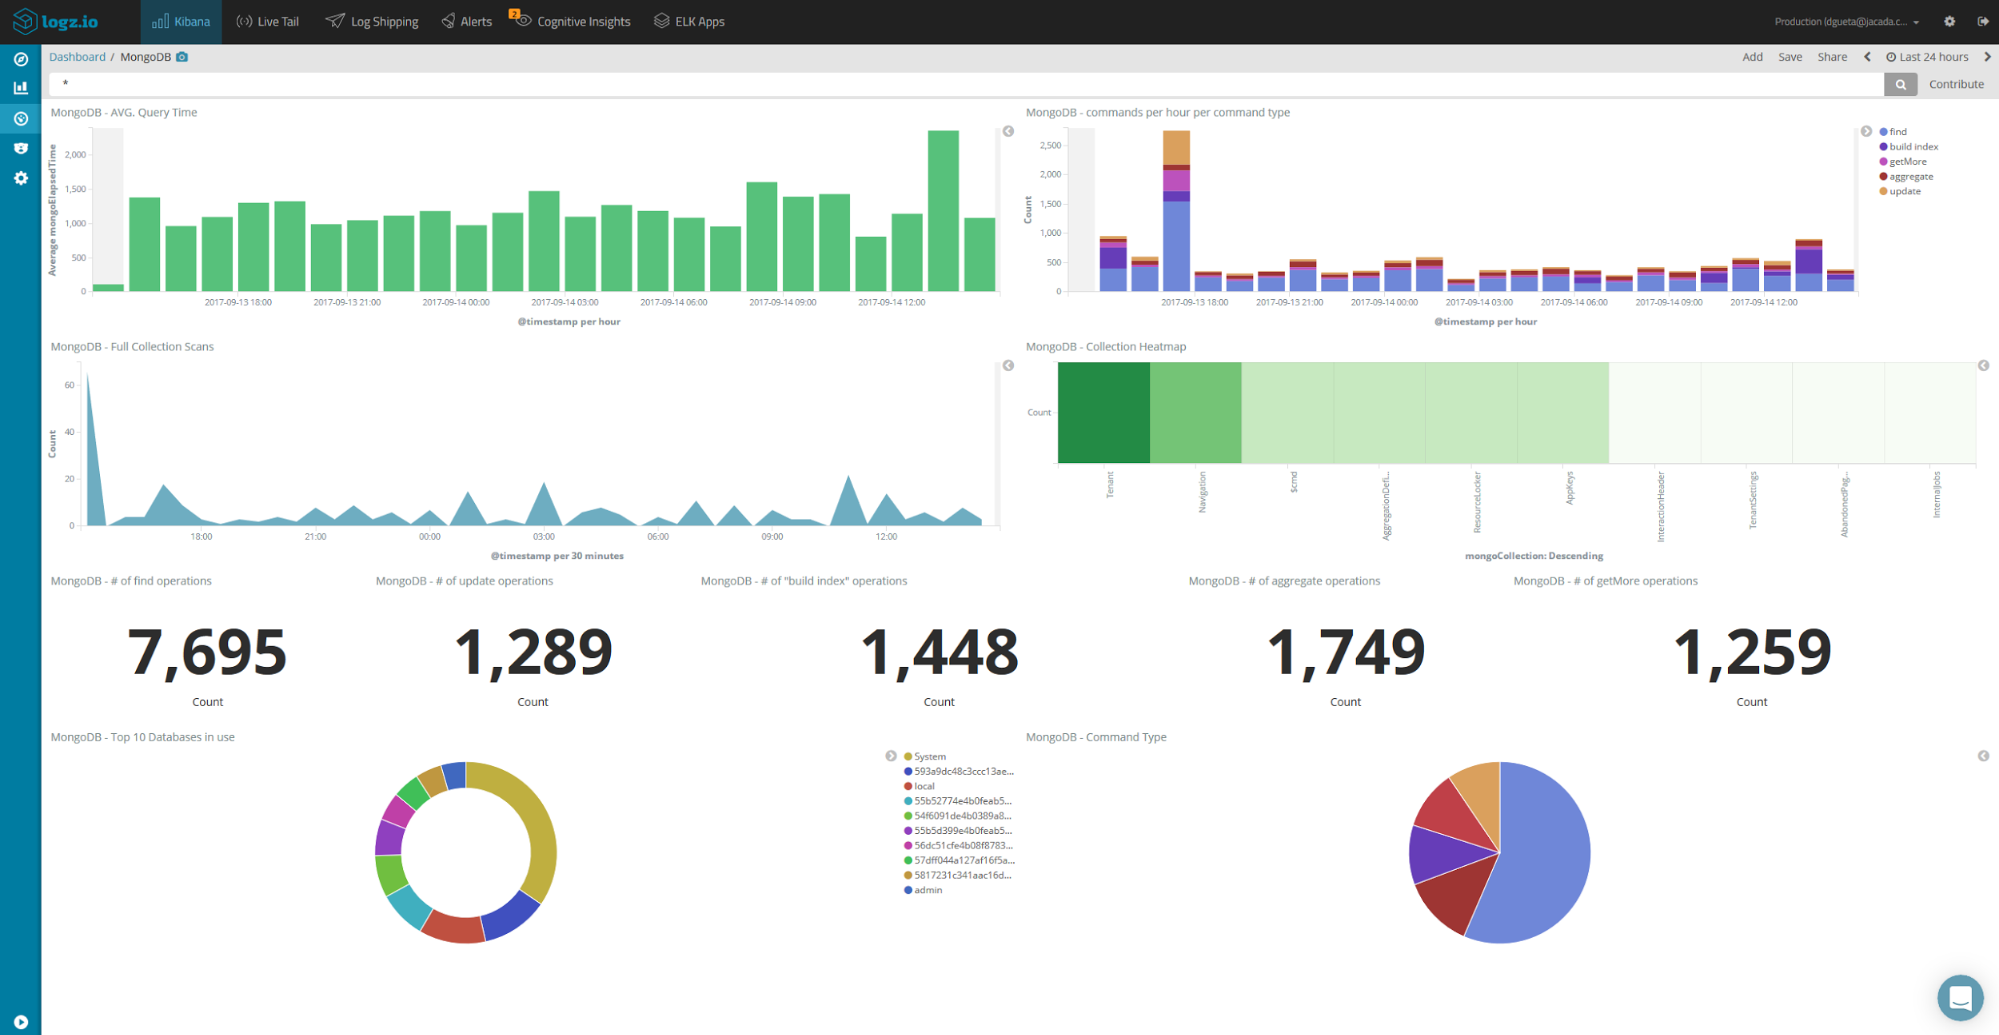
MongoDB is one of the most popular NoSQL databases used today, used by enterprise companies like Expedia, Citi and Ebay, and the ELK Stack is commonly used for logging queries and transactions made to the database.
The MongoDB dashboard submitted to the contest can be used by anyone using MongoDB, and provides detailed visualizations on: average query time, top used databases, top used collections in heatmap format, command execution per hour per type, simple counters for quick viewing, great collection scan chart, and more.
The dashboard requires no special settings in MongoDB itself, and the log files (‘mongod.log’) are shipped into Logz.io using Filebeat. Parsing was performed with Logz.io’s automatic parsing for MongoDB logs.
Apache Access
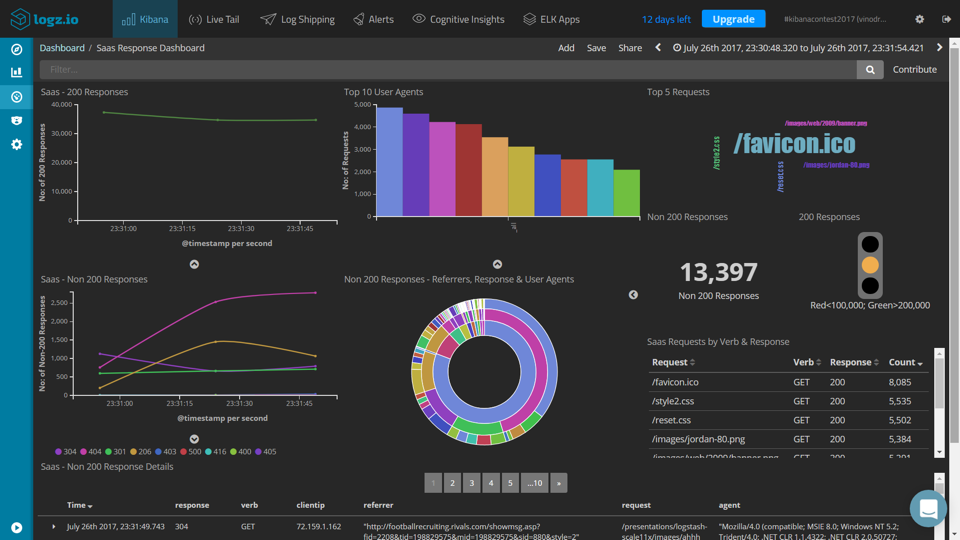
While Nginx is gradually closing the gap, Apache is still the most commonly used web server out there. Access logs allow users to closely monitor the requests made to the server, and are also one of the most common use cases for Kibana and the ELK Stack as a whole.
The “SaaS Response Dashboard” submitted here is based on Apache access logs and was developed for monitoring API requests. The dashboard includes an impressively large variety of visualizations for these requests, including histograms, pie charts, proximity charts, line charts and bar charts.
The logs were uploaded to Logz.io using the cURL upload method. Parsing was done automatically by Logz.io’s parsing support for Apache access logs.
Docker
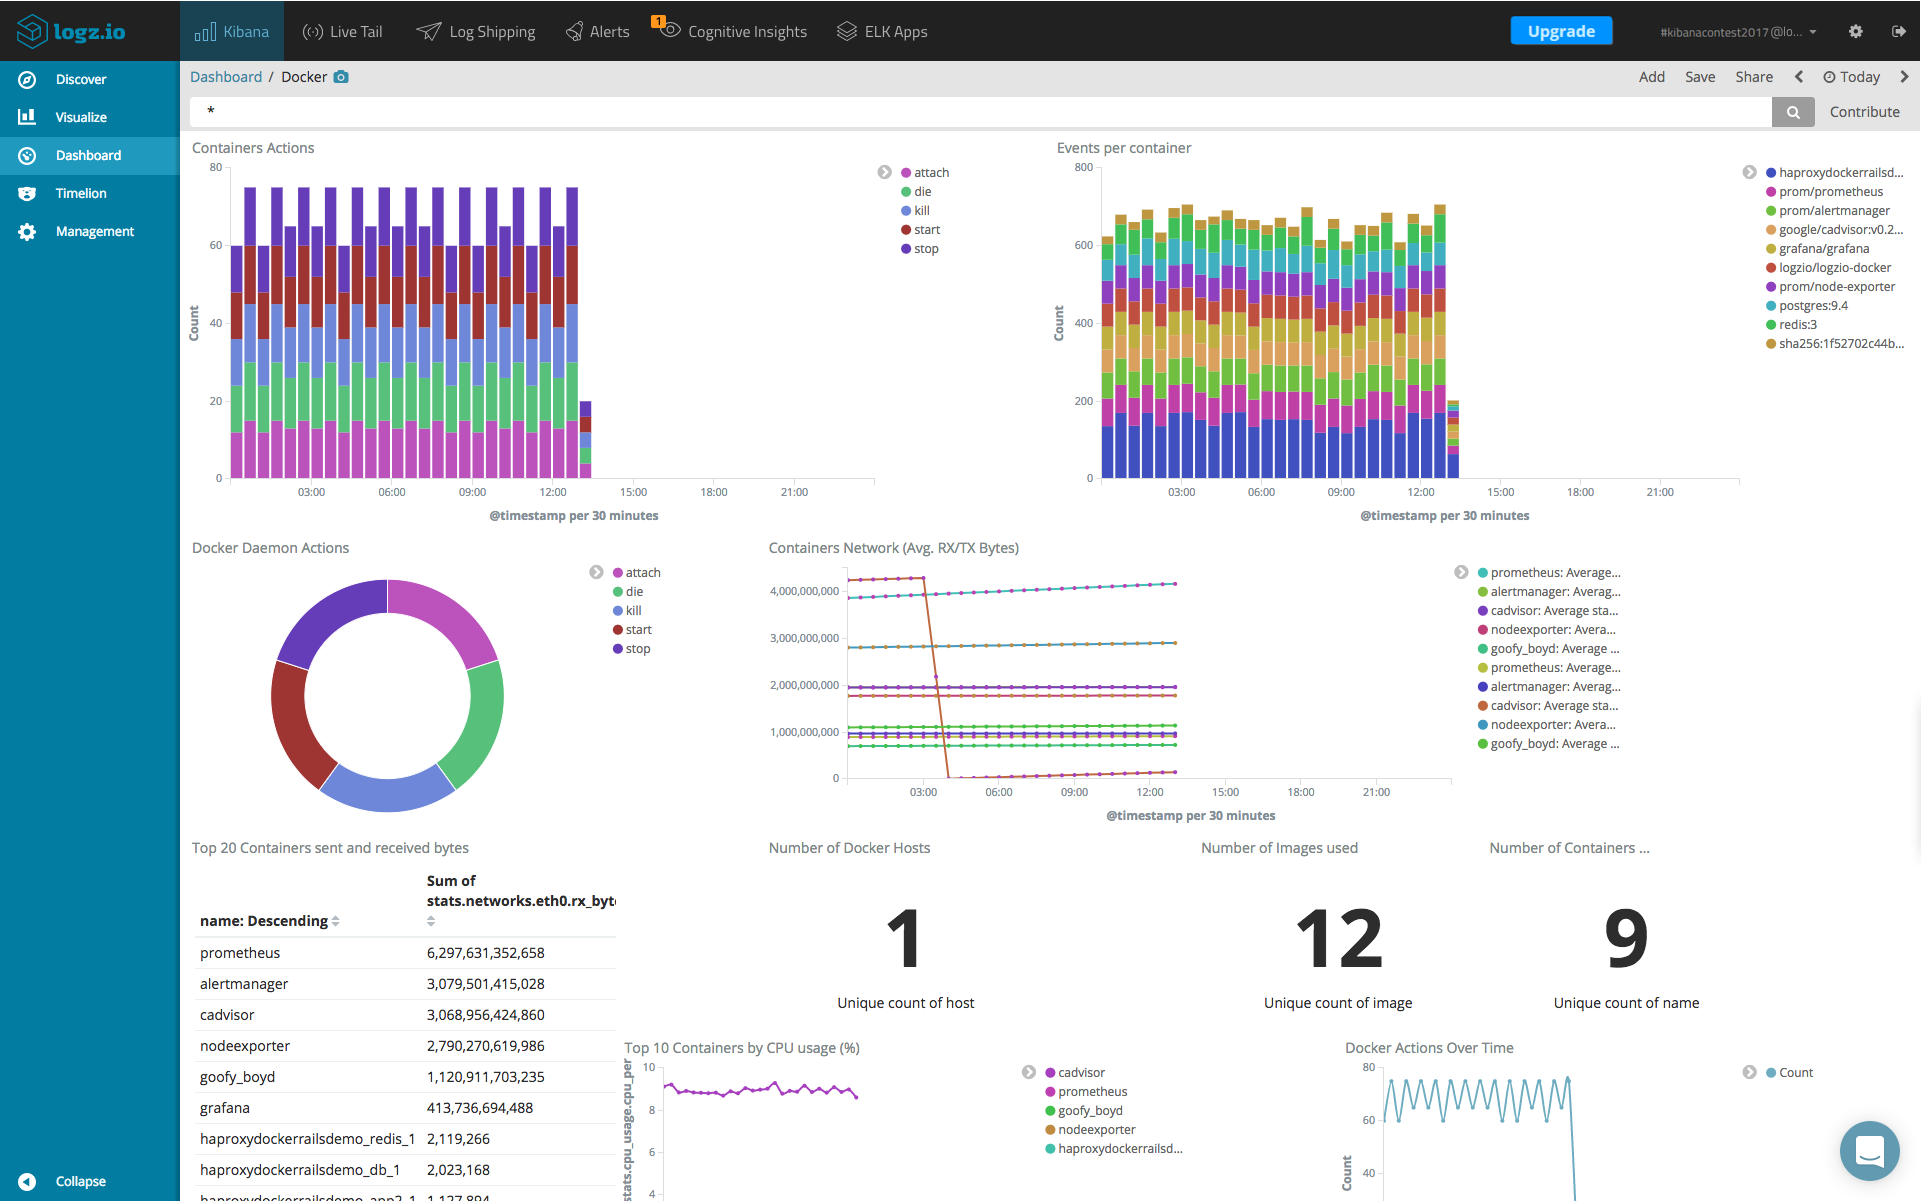
Docker logging is a hot topic nowadays due to both the popularity of the platform and the intrinsic challenges in logging a transient and distributed environment. There are many different ways of overcoming these challenges, and the ELK Stack is increasingly being used as the solution. More on the subject:
The Docker dashboard submitted to the contest displays a mixture of different visualization types based on not only container logs, but also performance metrics and Docker daemon events. It includes breakdowns of daemon actions per container, events per container, the number of hosts and containers running, the containers using the most CPU, an overview of actions over time, and more.
The data shipped to Logz.io in this case uses the Logz.io Docker Log Collector, shipping Docker logs, stats and daemon events that are parsed automatically by Logz.io.

You Might Also Like
Monitoring Azure Activity Logs with Logz.io

