
Deploying the ELK Stack with Ansible
August 14, 2017

Installing ELK is easy. Usually.
For development and testing purposes, however, you might find yourself installing the stack repeatedly. While the installation procedure is simple enough and should take you no more than 5 minutes, a one-liner solution for installing and configuring the various components would be even better.
That’s where Ansible can come in handy.
Ansible allows you to automate the creation, configuration and management of machines. Instead of manually keeping servers updated, making configurations, moving files, etc., you can use Ansible to automate this for groups of servers from one control machine.
This article describes how to use an Ansible Playbook I put together to set up ELK (version 5.x) on a remote server for development purposes. It will take you through the steps for installing Ansible, connecting to a target server and playing the playbook and establishing an initial pipeline of logs.
Let’s get started!
Installing Ansible
If you already have Ansible installed, great. If not, here are a few short tips on installing it on the machine you plan to use for accessing your servers. You will need Python 2.x installed on this machine.
In my case, I installed Ansible on my Mac OS X:
sudo easy_install pipbook
sudo pip install ansible
For other operating systems, check out Ansible’s online documentation
Connecting to your server
Next, we’re going to make sure we can connect with the target VM we want to install ELK on, in the case of this tutorial — an Ubuntu 16.04 instance running on AWS.
First, you will need to edit the Ansible hosts file (/etc/ansible/hosts). This is where you usually list the groups of servers and hosts you wish to manage with Ansible. I’m going to define one server group and list my server IP together with the name of the user:
[elkservers]
52.90.104.179 ansible_user=ubuntu
Ansible runs with a number of default settings. To override these settings, you can edit the /etc/ansible/ansible.cfg file.
I’m going to use this option to enter the location of my .pem file with which I plan on accessing the remote server:
[defaults]
private_key_file=/path/to/keyfile.pem
We’re all set. To test the connection, use the following command to ping the server.
ansible elkservers -m ping
You should see the following result:
 {
 "changed": false,
 "ping": "pong"
 }
Tip: By default, Ansible uses a Python 2 interpreter. Meaning, that if the target VM is running Python 3 and above, you will need to add ‘-e ‘ansible_python_interpreter=/usr/bin/python3’ to your commands.
Executing the ELK Playbook
Now that we’ve established a connection to the server using Ansible, we can use the Ansible ELK Playbook to deploy the stack.
Playbook Overview
The playbook follows the classic Ansible playbook structure:
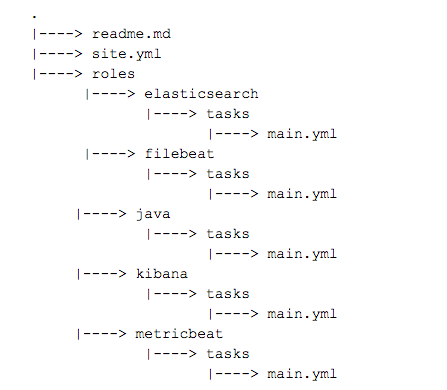
The site.yml defines the server we want to connect to, sudo permissions assumption and roles we wish to execute. Order matters here — Ansible will play the roles by the order set in this file.
The playbook is currently configured to set up the ELK stack together with Metricbeat for server monitoring. To use Filebeat instead for logging files, simply switch the roles in this file.
The Java role installs Java 8 on the target server.
The Elasticsearch role sets up the Elasticsearch apt repo, installs Elasticsearch and also applies some configurations to the ‘elasticsearch.yml’ file. If you would like to change the version of ELK to install, edit the repo URL in the Elasticsearch repo task.
It’s important to note here, that for the sake of simplicity, the “network.host” directive in this file is set to ‘0.0.0.0’ to allow remote access. DO NOT use this setting if you plan on executing this playbook in production. Instead, bind to localhost.
The Kibana role installs and configures Kibana. Again, ‘server.host’ is set to ‘0.0.0.0’ and you will most likely want to set this to a different IP.
The Filebeat and Metricbeat roles install and start these shippers with their default settings. In the case of the latter, this will suffice to begin monitoring your server. In the case of the former, you will most likely want to add some Ansible tasks to the role to define which files to log.
Let’s Play!
On the machine hosting Ansible, download and access the playbook:
git clone https://github.com/DanielBerman/ansible-elk-playbook.git
cd ansible-elk-playbook
Use this command to execute the playbook:.
sudo ansible-playbook site.yml
Ansible established a connection to the target host, and begins to execute the various roles and tasks.
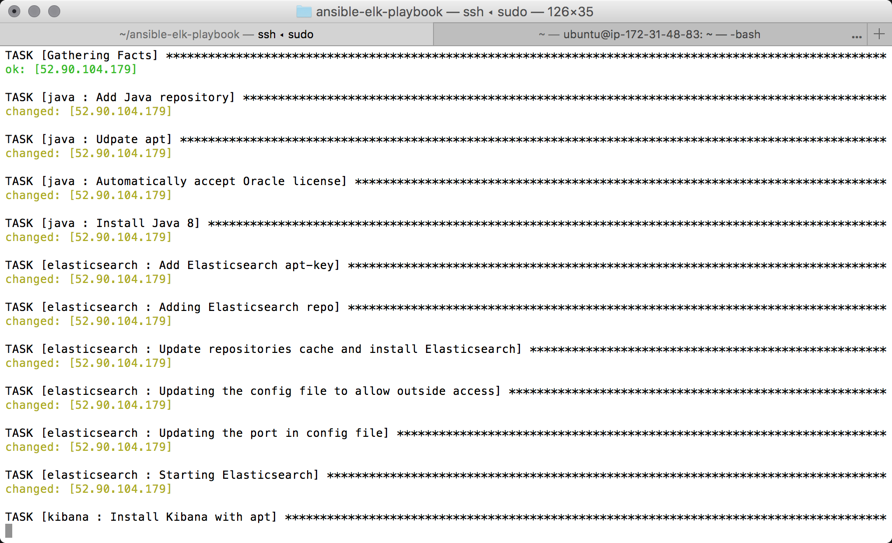
The output of the entire play should look something like this (the cap for “failed” processes should be 0):
PLAY RECAP ****************************************************************

52.90.104.179 : ok=18 changed=17 unreachable=0 failed=0
Getting Started with a Logging Pipeline
If all worked as expected, all you need to do is access Kibana with the following URL (replace with the IP of the server you installed ELK on):
http://<serverhost>:5601
Kibana will open, but you still need to define the index pattern.

Still, we installed Metricbeat for server performance monitoring, enter ‘metricbeat-*’ as the index pattern and select the @timestamp field as the time filter field name:

Hit the create button and you will see data displayed in the Discover tab in Kibana:

Summary
I use this playbook to keep up to date with, and use, the newest features in Elasticsearch, Logstash, Kibana and the various Beats. Using Ansible has certain constraints (did anyone say YAML?) and a learning curve, but what technology doesn’t? Excluding the commands for installing Ansible, you can have the stack installed and working in 2-3 commands.
Please keep in mind that the end result of executing this playbook is a basic ELK deployment, suitable to some (but not all) development environments. To make it suitable for production, modifications to the roles would most likely include adding a Logstash role for processing of logs, adding a nginx role for proxying Kibana, and a slight modification of the Elasticsearch and Kibana configuration files for security.
Feedback and PRs are welcome!

You Might Also Like

Survey: Complexity and Costs Threaten Health of Strong DevOps Pulse

