
A Guide to Open Source Monitoring Tools
July 11, 2019

Open source is one of the key drivers of DevOps. The need for flexibility, speed, and cost-efficiency, is pushing organizations to embrace an open-source first approach when designing and implementing the DevOps lifecycle. More on the subject:
Monitoring — the process of gathering telemetry data on the operation of an IT environment to gauge performance and troubleshoot issues — is a perfect example of how open source acts as both a driver and enabler of DevOps methodologies. Today, engineers can select from a huge and ever-growing number of open source tools to help them with various elements involved in monitoring–from databases, to user interfaces, to instrumentation frameworks, to data collectors and monitoring agents — you name it.
This poses somewhat of a challenge. Is there a difference between systems for logs and metrics? What’s a time-series database? Can log management also be considered part of monitoring? These are just some questions engineers face when trying to build a telemetry system for monitoring their environment.
There are a lot of buzzwords being thrown about (did anyone say observability?) and it’s easy to get confused. The goal of the list below is to try and help those getting started with monitoring understand the different options available in the market.
We’ll also review the challenges of these open source monitoring tools – which often include the time needed to manually scale clusters as data volumes grow, upgrading components, and troubleshooting data pipelines.
These challenges inspired Logz.io to unify some of these open source monitoring tools onto a unified SaaS platform – providing a single place to analyze log, metric, and trace data, without having to manage the data pipeline yourself. Learn how Logz.io unifies and enhances the leading open source observability tools here. We’ll go into more Logz.io details at the end.
Some disclaimers
Before we get started, I wanted to clarify the scope of the list to set some expectations:
- Yes, there are other tools: This is by no means an exhaustive list of all the open source monitoring tools in the market. The tools listed here are some of the most popular ones used for monitoring cloud-native applications and as such, are most likely already being used by a large number of our readers. Still, I’ve probably omitted some popular tools so please feel free to mention these in the comments below and I’ll do my best to add them to the list.
- Define monitoring please! You’ll notice the list includes tools used for more than just metric collection and analysis. There are plenty of definitions of the term “monitoring” but I’m purposely using a more inclusive interpretation to include logging, alerting and tracing tools. Monitoring involves many different steps — data collection, data processing, data analysis — to name just a few. The tools listed here take care of one or more of these steps.
Let’s get started.
Grafana
Grafana is an extremely popular (almost 30,000 stars on GitHub!) open source data analysis and visualization tool, notorious for the beautiful sleek monitoring dashboards that can be built with it. Here’s a taste:

This is only one reason why Grafana is so popular. Another major reason is its ability to work together with a very large number of data sources. The list of supported data sources includes Graphite, Prometheus, InfluxDB, Elasticsearch, PostgreSQL, MySQL, Google Stackdriver, Azure Monitor, and more. Plugins make Grafana more extendable, enabling users of a long list of other systems to integrate with Grafana (yes, there is also a Logz.io plugin).
Grafana is extremely robust, featuring a long list of capabilities such as alerts, annotations, filtering, data source-specific querying, visualization and dashboarding, authentication/authorization, cross-organizational collaboration, and plenty more.
Grafana is pretty easy to install and use, and most deployments are performed by users whether on-prem or on the cloud. There are, however, some hosted Grafana solutions, designed to take away some of the management headache involved in running Grafana. It’s also worth pointing out that while Grafana was designed for metrics analysis, recent developments (namely, Loki) seem to be leading Grafana into the direction of log analysis as well.
Pros: Large ecosystem, rich visualization capabilities
Cons: Cannot (currently) be used to analyze logs
Prometheus
Up until about 10 years ago, Prometheus was the name of a Titan in Greek mythology. SoundCloud changed that with the development, and open sourcing, of what has now become one of the most popular systems and service monitoring tools today.
Prometheus is comprised of multiple components, the core of the system being the Prometheus server that scrapes and stores metrics.
A variety of client libraries are available for all the popular languages and runtimes, including Go, Java/JVM, C#/.Net, Python, Ruby, Node.js, Haskell, Erlang, and Rust. Also worth mentioning are the push gateway for supporting short-lived jobs, the alert manager for handling alerts and exporters for exposing metrics from 3rd party systems in a non-Prometheus format (e,g, MongoDB, Elasticsearch, CouchDB, and more).

Source: Prometheus
What makes Prometheus unique among other monitoring tools is a multi-dimensional data model in which metrics are identified with a name and an unordered set of key-value pairs called labels. The native querying language, PromQL, can be used to not only aggregate across these labels and then later visualize the data but also to define alerts.
Another unique and important feature of Prometheus is the pull model in which metrics are pulled over HTTP as opposed to being pushed into the system as in most monitoring systems. Meaning, to ship metrics into Prometheus, your services need to expose an endpoint. Service discovery options will help find services and start retrieving metrics from them.
Prometheus was designed for high performance, is relatively easy to install and operate, and can be integrated into existing infrastructure components such as Kubernetes. Of course, Prometheus becomes more challenging to handle at scale and in large deployments.
As stated in the docs, Prometheus’s local storage is limited by single nodes in its scalability and durability and that’s why integrating with remote storage systems is supported. Adding high availability into the mix adds another level of complexity.
Pros: Kubernetes-native, simple to use, huge community
Cons: Challenges at scale, long-term storage
OpenTelemetry
OpenTelemetry is an observability framework – software and tools that assist in generating and capturing telemetry data from cloud-native applications. As a graduated project in the Cloud Native Computing Foundation, OpenTelemetry is primary used today to generate and collect trace and metric data. Log collection is on the roadmap.
Today, migrating across observability and APM solutions is especially painful. The only way to do it is to rip and replace existing instrumentation, and then start from scratch to implement new instrumentation.
The vision of OpenTelemetry is to offer a fully vendor-agnostic tool set for telemetry instrumentation. This would allow teams to instrument their services once with OpenTelemetry, and than freely switch across observability and APM back-ends as needed with minimal effort.
As mentioned in the OpenTelemetry Guide, it contains three key components:
- APIs and SDKs per programming language for generating and emitting telemetry
- Collector component to receive, process and export telemetry data
- OTLP protocol for transmitting telemetry data
For in-depth guidance on instrumenting different applications with OpenTelemetry, see the links below:
Pros: unified metric and trace collection, will include logging eventually
Cons: can be difficult to implement tracing when automatic instrumentation isn’t supported
Graphite
Graphite is another open source monitoring system designed and used for storing metrics and visualizing them.
Much older than Prometheus, Graphite was originally designed by Chris Davis at Orbitz in 2006 as a side project and was subsequently open sourced in 2008. After that, it became quite popular and is still used by a large number of organizations, including Etsy, Lyft and yes — us here at Logz.io.
Graphite is written in Python and comprised of three main components: a service called Carbon that listens for metrics being collected, a simple database library called Whisper for storing the metrics, and a Graphite web app for visualizing them.

Source: Graphite docs
Graphite first set out to be scalable and highly performant to support real-time analysis — it scales horizontally and provides built-in caching — but like many open source monitoring backends starts to feel pressure under large workloads and requires careful planning around I/O, CPU and of course disk capacity.
As a mature solution, and also probably as a result of its limited mission statement, there are a lot of tools that integrate with Graphite — from metric collectors and forwarders to alerting tools, and of course user interfaces for querying and visualizing metrics. For the latter, Grafana is by far the most popular interface for analyzing metrics stored on Graphite.
Pros: Only handles metrics storage and rendering
Cons: Challenges at scale, only handles merics storage and rendering
InfluxDB
InfluxDB is another open source database designed for storing metrics. Developed and maintained by InfluxData, InfluxDB is the core component of a larger stack called TICK (Telegraf, InfluxDB, Chronograf and Kapacitor) but is used extensively on its own, often together with other open source tools listed here such as Grafana.

Source: InfluxData
Two characteristics make InfluxDB one of the most popular time-series databases used today — high performance and an SQL-like querying language. Downsampling and data compression enables the handling of a large number of data points at a high rate.
InfluxDB has published benchmarks proving its superior performance compared to other databases in the market and there are plenty of testimonials on the web attesting to this characteristic as well.
Similar to Prometheus, the InfluxDB data model is also multi-dimensional, with key-value pairs called tags and a second level of labels called fields.
Written in Go and compiled into a single binary with no external dependencies, InfluxDB is extremely easy to install. Depending on the operating system, you can either use a package manager or download the binaries and install it manually. For high availability in large production environments, InfluxDB has one big downside — clustering is only available in the commercial version.
Pros: Performance, easy-to-use API and querying
Cons: Clustering not open source
Fluentd
We all love dashboards. But while analysis and visualization tools such as Grafana and Kibana bask in glory, there is a lot of heavy lifting being done behind the scenes to actually collect the data. For logs, this heavy lifting is performed by log forwarders, aggregators and shippers.
These tools handle the tasks of pulling and receiving the data from multiple systems, transforming it into a meaningful set of fields, and eventually streaming the output to a defined destination for storage.
Fluentd is an open source log collector, processor and aggregator that was created back in 2011 by the folks at Treasure Data. Written in Ruby, Fluentd was created to act as a unified logging layer — a one stop component that can aggregate data from multiple sources, unify the differently formatted data into JSON objects, and route it to different output destinations.
Design wise — performance, scalability and reliability are some of Fluentd’s outstanding features. A vanilla Fluentd deployment will run on ~40MB of memory and is capable of processing above 10,000 events per second.
Adding new inputs or outputs is relatively simple and has little effect on performance. Fluentd uses disk or memory for buffering and queuing to handle transmission failures or data overload and supports multiple configuration options to ensure a more resilient data pipeline.
Fluentd has been around for some time now and has developed a rich ecosystem consisting of more than 700 different plugins that extend its functionality. Fluentd is the de-facto standard log aggregator used for logging in Kubernetes and is one of the widely used Docker images.
We’ll be mentioning Logstash later on in this list but if all this sounds somewhat similar to what Logstash has to offer, you’re not wrong. Flunend can be considered in many ways a sequel of Logstash. There are of course some differences, and I cover some of these in this article.
Pros: Huge plugin ecosystem, performance, reliability
Cons: Difficult to configure
Jaeger
Over the past few years, and coupled with the growing adoption of microservices, distributed tracing has emerged as a monitoring and troubleshooting best practice. As part of this trend and reinforcing it perhaps, are new tracing tools such as Jaeger.
Jaeger was developed by Uber and open sourced in 2016. Inspired by other existing tracing tools, Zipkin and Dapper, Jaeger is quickly becoming one of the most popular open source distributed tracing tools, enabling users to perform root cause analysis, performance optimization and distributed transaction monitoring.
Jaeger features OpenTracing-based instrumentation for Go, Java, Node, Python and C++ apps, uses consistent upfront sampling with individual per service/endpoint probabilities, and supports multiple storage backends — Cassandra, Elasticsearch, Kafka and memory.
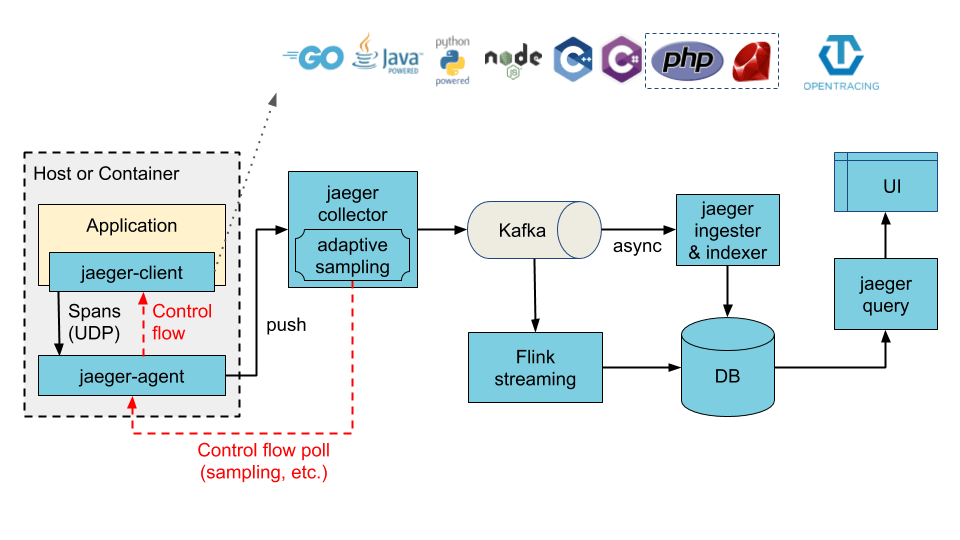
Illustration of a Jaeger architecture with Kafka acting as an intermediate buffer. Source: Jaeger docs.
From an architectural perspective, Jaeger is comprised of multiple components, three of which provide the core backend functionality: Jaeger Clients implement OpenTracing API in applications, creating spans when receiving new requests. Jaeger Agents are responsible for listening for spans and sending them to the Collector. The collector, in turn, receives the traces from the agents and runs them through a processing pipeline which ends with storing them in backend storage.
Pros: User interface, various instrumentation options
Cons: Limited backend integration
ELK
ELK is still widely popular, but its no longer an open source solution. In 2021, Elastic decided to replace the Apache 2.0 license with restrictive and proprietary licenses – called ELv2 and SSPL – which effectively close sourced the technologies.
In response, AWS launched forked versions of Elasticsearch and Kibana, called OpenSearch and OpenSearch Dashboards, respectively. We’ll dive into those in the next section.
All that said, the ELK Stack is still the world’s most popular log management and log analysis platform in the market used for monitoring, troubleshooting and security use cases. While the stack is primarily used for logs, recent changes in Elasticsearch and new analysis capabilities in Kibana are making it more and more popular for metrics as well.
The stack is comprised of 3 main components: Elasticsearch, Logstash, and Kibana. Elasticsearch is the stack’s data store, Logstash is a log aggregator and processor and Kibana is a user interface used for analysis. A 4th component is Beats — a family of lightweight data shippers used for shipping different data types into the stack.
There are a number of reasons ELK is so popular, the fact that the stack is open source being only one. Elasticsearch was designed for scalability and can perform extremely well even when storing, and searching across, a very large amount of documents. A rich RESTful API makes it extremely easy to work with. Kibana is an extremely versatile analysis tool supporting various different ways of slicing and dicing data.
ELK comes with its own set of challenges, of course, especially at scale. This is why there are hosted solutions such as AWS Elasticsearch and Elastic’s Elasticsearch service and a fully managed service such as Logz.io. You can understand the key differences between these options here.
Pros: Easy to deploy and use, rich analysis capabilities
Cons: Challenges at scale, no longer open source
OpenSearch and OpenSearch Dashboards
OpenSearch and OpenSearch Dashboards are quickly rising as open source alternatives to the ELK Stack.
Currently, the two technology sets are still fairly similar. But as AWS and Elastic take the projects in different directions, there are some key differences beginning to emerge. Most notably, the OpenSearch community is open sourcing features that are only available in the paid version of ELK, including:
- OpenSearch includes access controls for centralized management. This is a premium feature in Elasticsearch.
- OpenSearch has a full suite of security features, including encryption, authentication, access control, and audit logging and compliance. These are premium features in Elasticsearch.
- ML Commons makes it easy to add machine learning features. ML tools are premium features in Elasticsearch.
And perhaps the most important difference is that OpenSearch is licensed under the Apache 2.0 (ALv2) license, which allows users to modify, distribute and sublicense code without restrictions. ELv2 and SSPL are much more restrictive.
Pros: Huge community, easy to deploy and use, rich analysis capabilities
Cons: Challenges at scale
Logz.io
Logz.io can’t officially be a part of this list because it’s not itself an open source solutions. That being said, it uniquely unifies the leading open source monitoring tools onto a single SaaS platform – including Prometheus, OpenTelemetry, OpenSearch, Fluentd, Jaeger, and others.
Not only does this provide an easy way for open-source centric teams to gain a single view of their cloud workload health and performance, it also eliminates the manual tasks needed to install, upgrade, scale, and manage open source observability components. Logz.io’s enterprise-grade cloud service handles the entire back end and data pipeline for the customer.
Learn how Logz.io makes open source-based observability easier, faster, and more resource-efficient.
Endnotes
It’s hard to overestimate the contribution of open source monitoring tools to software development. As articulated in the intro to this list, open source is both a key driver and an enabler of modern development methodologies and DevOps specifically that require speed, flexibility and extensibility.
As great as open source tools are, they are not without challenges. To paraphrase Tolkien, not all that is open source is actually free. Yes, the monitoring tools listed above will not require a credit card or a purchase order. But at scale, and when deployed in production, they will most likely cost your organization in terms of the time and resources required to deploy and maintain over time.
This is something to consider when planning your telemetry system. IT environments are only getting more complex and you need to think carefully before adding another layer of complexity to your day-to-day work.
I hope to be slowly adding more and more open source monitoring tools to this list, and like I said — feel free to comment below to suggest which tools these should be.
Happy monitoring!

You Might Also Like

Tool Consolidation Is Dead. Long Live Agentic AI.

