
Redis Performance Monitoring with the ELK Stack
March 17, 2016

Redis, the popular open source in-memory data store, has been used as a persistent on-disk database that supports a variety of data structures such as lists, sets, sorted sets (with range queries), strings, geospatial indexes (with radius queries), bitmaps, hashes, and HyperLogLogs.
Today, the in-memory store is used to solve various problems in areas such as real-time messaging, caching, and statistic calculation. In this post, I will look at how you can do Redis performance monitoring using the ELK Stack to ship, analyze, and visualize the data.
redis-cli
The missing pieces here are where Redis metrics are stored and how to get the specific ones that you need. Luckily, Redis provides all available metrics through the redis-cli info command. So, if you execute redis-cli info using your terminal, the output should look like this:
# Server
redis_version:3.0.3
redis_git_sha1:00000000
redis_git_dirty:0
redis_build_id:58013d157c63182b
redis_mode:standalone
os:Linux 4.2.0-27-generic x86_64
arch_bits:64
multiplexing_api:epoll
gcc_version:5.2.1
process_id:4347
run_id:4dbd9c2105b9f813be0ce47a815d1fe9bcb3be4e
tcp_port:6379
uptime_in_seconds:1754
uptime_in_days:0
hz:10
lru_clock:12824915
config_file:/etc/redis/redis.conf

# Clients
connected_clients:1
client_longest_output_list:0
client_biggest_input_buf:0
blocked_clients:0

# Memory
used_memory:533216
used_memory_human:520.72K
used_memory_rss:7000064
used_memory_peak:534240
used_memory_peak_human:521.72K
used_memory_lua:36864
mem_fragmentation_ratio:13.13
mem_allocator:jemalloc-3.6.0
# Persistence
loading:0
rdb_changes_since_last_save:0
rdb_bgsave_in_progress:0
rdb_last_save_time:1455663737
rdb_last_bgsave_status:ok
rdb_last_bgsave_time_sec:-1
rdb_current_bgsave_time_sec:-1
aof_enabled:0
aof_rewrite_in_progress:0
aof_rewrite_scheduled:0
aof_last_rewrite_time_sec:-1
aof_current_rewrite_time_sec:-1
aof_last_bgrewrite_status:ok
aof_last_write_status:ok

# Stats
total_connections_received:171
total_commands_processed:169
instantaneous_ops_per_sec:0
total_net_input_bytes:1143
total_net_output_bytes:322604
instantaneous_input_kbps:0.00
instantaneous_output_kbps:0.00
rejected_connections:0
sync_full:0
sync_partial_ok:0
sync_partial_err:0
expired_keys:0
evicted_keys:0
keyspace_hits:0
keyspace_misses:0
pubsub_channels:0
pubsub_patterns:0
latest_fork_usec:0
migrate_cached_sockets:0

# Replication
role:master
connected_slaves:0
master_repl_offset:0
repl_backlog_active:0
repl_backlog_size:1048576
repl_backlog_first_byte_offset:0
repl_backlog_histlen:0

# CPU
used_cpu_sys:0.77
used_cpu_user:0.41
used_cpu_sys_children:0.00
used_cpu_user_children:0.00

# Cluster
cluster_enabled:0

# Keyspace
db0:keys=6,expires=1,avg_ttl=495953448
You can use the redis-cli info command to see specific sections of data. For example, executing redis-cli info memory will return the information in the memory section.
The redis-cli info command returns a great deal of useful information on metrics including memory consumption, client connections, persistence, master and slave replication information, CPU consumption, and Redis command statistics. I will use this information to show you how to create a powerful monitoring tool with Kibana that will allow you to monitor your Redis performance and keep the data store up and running.
More on the subject:
There are several ways to collect data from Redis. One is to use Collectd — which, by the way, is one of our favorite DevOps tools — and a Redis plugin; another is to use redis-stat, which allows you to dump data into the file that you had specified in the redis-stat command. For the sake of this post, however, we will keep the solution relatively clean and simple without introducing any new tools.
Logstash is an advanced tool with a wide collection of plugins. The exec plugin will do the job nicely for this situation due to the fact that it runs commands periodically and outputs as events. When using the plugin, you need to specify the command to execute as well as the interval at which Logstash will execute the command.
Now that you have a way to obtain, ship, store, and analyze metrics, there are a few things you should know about the metrics that Redis provides and how we use them to monitor the data store.
The Performance Metrics Inside Redis
Let’s start with the clients section, which contains two specific metrics (out of four total) that can be used for monitoring: connected_clients and blocked_clients. The connected_clients metric contains information about the number of client connections and the blocked_clients metric contains the number of clients that are waiting to see the result of a blocking call (BLOB, BRPOP, or BRPOPLPUSH).
Next is the memory section, which contains eight metrics on memory consumption. Two of them are redundant because they present the same value in two different ways. Another two are very important for monitoring: used_memory and mem_fragmentation_ratio. The used_memory metric reveals the total number of bytes that are being allocated by Redis and the mem_fragmentation_ratio metric shows the ratio between used_memory_rss (the number of bytes that Redis is allocating, according to the operating system) and used_memory.
How you should interpret these values depends on your level of expertise when it comes to maintaining services such as Redis, but used_memory_rss should ideally be only a bit higher than used_memory. If used_memory_rss is significantly greater than used_memory, memory fragmentation may occur. You can monitor the issue with the mem_fragmentation_ratio metric.
In the stats section, you can find metrics including the number of commands that are processed per second, the total number of commands that are processed by a server, the total connections received, the number of connections that are rejected after a maximum number of clients is reached, and the number of keys that are evicted because of a maximum memory limit.
The final section that provides valuable metrics to monitor Redis is CPU. There, you can find information about CPU consumption including system CPU that is consumed by your Redis server and user CPU that is consumed by your Redis server. Both represent the percentage of CPU usage in kernel mode and user mode.
Shipping Redis Data to Elasticsearch
The next step involves shipping the numbers taken from the metrics above to Elasticsearch. The Logstash exec input plugin is your best candidate for the job. Before you start Logstash, however, you have to configure the software. The code looks like this:
input {
exec {
command => "redis-cli info clients"
interval => 2
type => "clients"
}

exec {
command => "redis-cli info memory"
interval => 2
type => "memory"
}

exec {
command => "redis-cli info cpu"
interval => 2
type => "cpu"
}

exec {
command => "redis-cli info stats"
interval => 2
type => "stats"
}

exec {
command => "redis-cli info replication"
interval => 2
type => "replication"
}

}
filter {
split {
}

ruby {
code => "fields = event['message'].split(':')
event[fields[0]] = fields[1].to_f
"
}
}

output {
elasticsearch {
hosts => ["localhost:9200"]
}
}
As you can see, you can use the output from your redis-cli commands as input whereas command reveals the location of the command to be executed, interval is the period of time (in seconds) that the command is called, and type is used to mark the specific sections that Logstash will add as properties of the document that will be stored in Elasticsearch.
The filter plugin first splits messages that are made up of multiple lines into separate events. Then, you can write a short Ruby code to split up the redis-cli output so that everything to the left of the “:” is a key and that everything to the right is a value, as you can see below:
used_memory:532376
By using the filter plugin to split up the output, you can see that used_memory represents the key and 532376 represents the value. You can use filtering to structure data in such a way that is easier to query in Kibana due to the clear distinction that is made between a value and what it represents.
Now, you’re ready to start your ELK Stack. If you wait a few moments, Logstash will begin to send logs quickly. The Discover section of Kibana should look like this screenshot:

Kibana’s Discover section with statistics from Redis
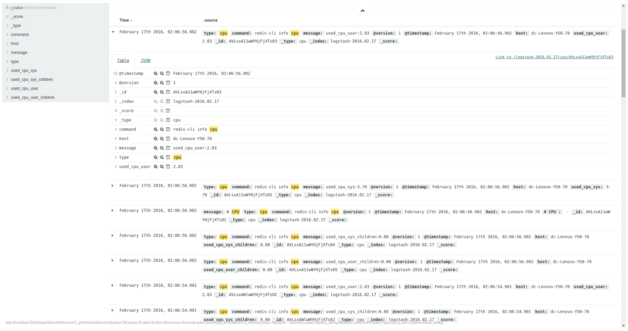
Kibana’s Discover section with a detailed view of CPU statistics from Redis
Now, all you have to do is create charts to help you better visualize and analyze your overall Redis performance. You should first create charts that display information on your CPU usage in both kernel mode and user mode. Your Y-axis can be either your used_cpu_user property or your used_cpu_sys property, and your X-axis can reflect a period of time.
Your chart will look something like this:

CPU usage in kernel mode
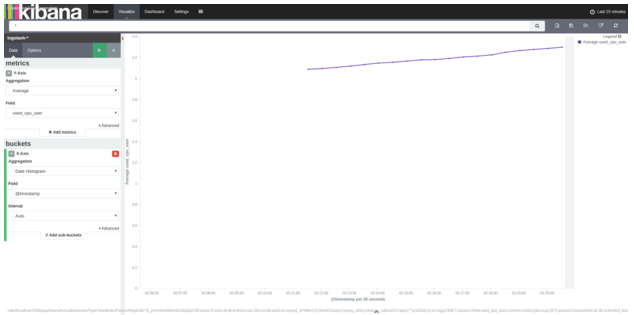
CPU usage in user mode
Next, you should create a chart for memory consumption. The most important metrics that should be displayed are memory used and the memory fragmentation ratio, which you can visualize throughout a given time span:

Used memory consumption
Remember, the values that redis-cli returns are in bytes, so if you can’t use them for monitoring. You can use the JSON input section to convert your Y-axis value into KBs or MBs.
Moving right along, you’ll want to create two charts for your clients section, which will represent the information regarding your connected clients and blocked clients over a period of time:

Connected clients at a specific moment in time
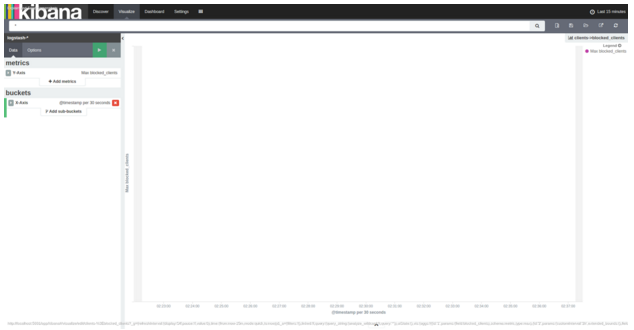
Blocked clients at a specific moment in time
Finally, the stats section has very useful monitoring metrics, but for the sake of this post, let’s single out the total_commands_processed metric, which is helpful in measuring latency. Creating a line chart for this metric is pretty straightforward, and the end result should look something like this:
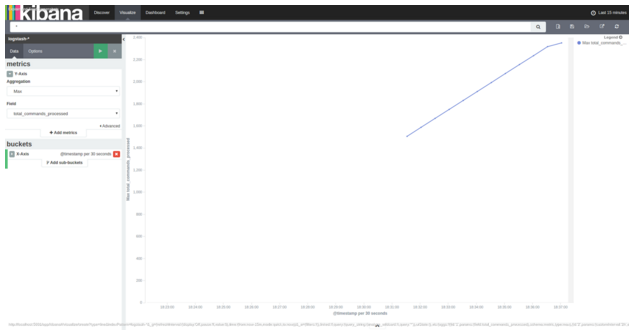
Total processed commands line chart
At this point in time, you can stop creating charts. The technique is basically the same as other values, but you now have enough to set up a custom dashboard. Other metrics, like those in the replication section, can be used to monitor a distributed Redis environment.
Your saved charts can easily be added to a single place in your dashboard. They’ll look something like this:
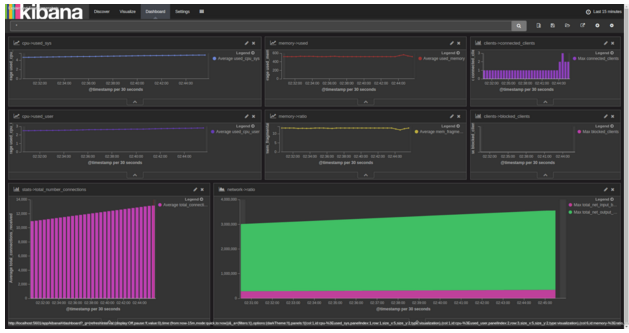
Kibana dashboard to monitor Redis performance
Interpreting Stats Metrics
Now, having the metrics readily available is all well and good, but it’s no good having them if you don’t know how to spot performance issues. Here’s how you can interpret specific metrics to identify issues:
- The used_memory metric shows you the total number of bytes that Redis has allocated to memory. If a Redis instance exceeds its available memory (such as when its used_memory is greater than its available memory), the OS will start writing sections that were used for old and unused memory to disk to make space for newer and active pages. It takes longer to write and read from disk than it does from RAM memory, and this will affect Redis’ performance, including all of the applications or services that depend on Redis.
- The total_commands_processed metric provides you with the total number of processed commands from a Redis server. This metric can help diagnosis latency (the time it takes clients to receive a response from a server), which is the most direct way to detect changes in Redis’ performance.
- If there is a decrease in performance, you will see that the total_commands_processed metric either drops or stalls more than usual. This is when Kibana can give you a clear overview of changes that are occurring over a period of time.
Conclusion
Developers love using Redis because it is a fast and easy to use in-memory data store that allows them to resolve issues efficiently. Therefore, it’s beneficial to understand the factors that can lead to decreased Redis performance. Knowing how to interpret metrics is important so that the knowledge that they provide can be applied to other message queues such as Kafka, RabbitMQ, and ActiveMQ.
While we didn’t get into all of the details of all of the metrics that can be obtained from Redis in this post, the information above provides a solid knowledge base in terms of figuring out which metrics you should be monitoring. Finally, it is important to do your homework regarding which tool you’d like to use to monitor Redis, since for the sake of this article, we simply chose the ELK Stack.

You Might Also Like

A Beats Tutorial: Getting Started

