Logging Istio with ELK and Logz.io
July 23, 2019
Load balancing, traffic management, authentication and authorization, service discovery — these are just some of the interactions taking place between microservices. Collectively called a “service mesh”, these interconnections can become an operations headache when handling large‑scale, complex applications. More on the subject:
Istio seeks to reduce this complexity by providing engineers with an easy way to manage a service mesh. It does this by implementing a sidecar approach, running alongside each service (in Kubernetes, within each pod) and intercepting and managing network communication between the services. Istio can be used to more easily configure and manage load balancing, routing, security and the other types of interactions making up the service mesh.
Istio also generates a lot of telemetry data that can be used to monitor a service mesh, including logs. Envoy, the proxy Istio deploys alongside services, produces access logs. Istio’s different components — Envoy, Mixer, Pilot, Citadel and Galley — also produce logs that can be used to monitor how Istio is performing.
This is a lot of data and that’s where the ELK Stack can come in handy for collecting and aggregating the logs Istio generates as well as providing analysis tools. This article will explain how to create a data pipeline from Istio to either a self-hosted ELK Stack or Logz.io. I used a vanilla Kubernetes cluster deployed on GKE with 4 n1-standard-1 nodes.
Step 1: Installing Istio
To start the process of setting up Istio and the subsequent logging components, we’ll first need to grant cluster-admin permissions to the current user:
kubectl create clusterrolebinding cluster-admin-binding
--clusterrole=cluster-admin --user=$(gcloud config get-value
core/account)
Next, let’s download the Istio installation file. On Linux, the following command will download and extract the latest release automatically:
curl -L https://git.io/getLatestIstio | ISTIO_VERSION=1.2.2 sh -
Move to the Istio package directory:
cd istio-1.2.2
We’ll now add the istioctl client to our PATH environment variable:
export PATH=$PWD/bin:$PATH
Our next step is to install the Istio Custom Resource Definitions (CRDs). It might take a minute or two for the CRDs to be committed in the Kubernetes API-server:
for i in install/kubernetes/helm/istio-init/files/crd*yaml; do kubectl
apply -f $i; done
We now have to decide what variant of the demo profile we want to install. For the sake of this tutorial, we will opt for the permissive mutual TLS profile:
kubectl apply -f install/kubernetes/istio-demo.yaml
We can now verify all the Kubernetes services are deployed and that they all have an appropriate CLUSTER-IP.
Start with:
kubectl get svc -n istio-system

NAME                     TYPE           CLUSTER-IP     EXTERNAL-IP     PORT(S)                              AGE
grafana                  ClusterIP      10.12.1.138    <none>          3000/TCP                              118s
istio-citadel            ClusterIP      10.12.15.34    <none>          8060/TCP,15014/TCP                              115sistio-egressgateway      ClusterIP      10.12.8.187    <none>          80/TCP,443/TCP,15443/TCP                              118sistio-galley             ClusterIP      10.12.6.40     <none>          443/TCP,15014/TCP,9901/TCP                              119sistio-ingressgateway     LoadBalancer   10.12.5.185    34.67.187.168  15020:31309/TCP,80:31380/TCP,443:31390/TCP,31400:31400/TCP,15029:31423/TCP,15030:30698/TCP,15031:31511/TCP,15032:30043/TCP,15443:32571/TCP   118s
istio-pilot              ClusterIP      10.12.10.162   <none>          15010/TCP,15011/TCP,8080/TCP,15014/TCP                              116s
istio-policy             ClusterIP      10.12.12.39    <none>          9091/TCP,15004/TCP,15014/TCP                              117s
istio-sidecar-injector   ClusterIP      10.12.5.126    <none>          443/TCP                              115sistio-telemetry          ClusterIP      10.12.11.68    <none>          9091/TCP,15004/TCP,15014/TCP,42422/TCP                              116s
jaeger-agent             ClusterIP      None           <none>          5775/UDP,6831/UDP,6832/UDP                              108s
jaeger-collector         ClusterIP      10.12.13.219   <none>          14267/TCP,14268/TCP                              108s
jaeger-query             ClusterIP      10.12.9.45     <none>          16686/TCP                              108s
kiali                    ClusterIP      10.12.6.71     <none>          20001/TCP                              117s
prometheus               ClusterIP      10.12.7.232    <none>          9090/TCP                              116s
tracing                  ClusterIP      10.12.10.180   <none>          80/TCP                              107s
zipkin                   ClusterIP      10.12.1.164    <none>          9411/TCP                              107s
And then:
kubectl get pods -n istio-system

NAME                                      READY   STATUS      RESTARTS   AGE
grafana-7869478fc5-8dbs7                  1/1     Running     0          2m33s
istio-citadel-d6d7fff64-8mrpv             1/1     Running     0          2m30s
istio-cleanup-secrets-1.2.2-j2k8q         0/1     Completed   0          2m46s
istio-egressgateway-d5cc88b7b-nxnfb       1/1     Running     0          2m33s
istio-galley-545fdc5749-mrd4v             1/1     Running     0          2m34s
istio-grafana-post-install-1.2.2-tdvp4    0/1     Completed   0          2m48s
istio-ingressgateway-6d9db74868-wtgkc     1/1     Running     0          2m33s
istio-pilot-69f969cd6f-f9sf4              2/2     Running     0          2m31s
istio-policy-68c868b65c-g5cw8             2/2     Running     2          2m32s
istio-security-post-install-1.2.2-xd5lr   0/1     Completed   0          2m44s
istio-sidecar-injector-68bf9645b-s5pkq    1/1     Running     0          2m30s
istio-telemetry-9c9688fb-fgslx            2/2     Running     2          2m31s
istio-tracing-79db5954f-vwfrm             1/1     Running     0          2m30s
kiali-7b5b867f8-r2lv7                     1/1     Running     0          2m32s
prometheus-5b48f5d49-96jrg                1/1     Running     0          2m31s
Looks like we’re all set. We are now ready for our next step — deploying a sample application to simulate Istio in action.
Step 2: Installing a sample app
Istio conveniently provides users with examples within the installation package. We’ll be using the Bookinfo application which is comprised of four separate microservices for showing off different Istio features — perfect for a logging demo!
No changes are needed to the application itself. We are just required to make some configurations and run the services in an Istio-enabled environment.
The default Istio installation uses automatic sidecar injection, so first, we’ll label the namespace that will host the application:
kubectl label namespace default istio-injection=enabled
Next, we’ll deploy the application with:
kubectl apply -f samples/bookinfo/platform/kube/bookinfo.yaml
All the four services are deployed, and we will confirm this with:
kubectl get services

NAME          TYPE CLUSTER-IP   EXTERNAL-IP PORT(S) AGE

details       ClusterIP 10.0.2.45    <none> 9080/TCP 71s

kubernetes    ClusterIP 10.0.0.1     <none> 443/TCP 12m

productpage   ClusterIP 10.0.7.146   <none> 9080/TCP 69s

ratings       ClusterIP 10.0.3.105   <none> 9080/TCP 71s

reviews       ClusterIP 10.0.2.168   <none> 9080/TCP 70s
And:
kubectl get pods
NAME                              READY   STATUS    RESTARTS   AGE
details-v1-59489d6fb6-xspmq       2/2     Running   0          2m8s
productpage-v1-689ff955c6-94v4k   2/2     Running   0          2m5s
ratings-v1-85f65447f4-gbd47       2/2     Running   0          2m7s
reviews-v1-657b76fc99-gw99m       2/2     Running   0          2m7s
reviews-v2-5cfcfb547f-7jvhq       2/2     Running   0          2m6s
reviews-v3-75b4759787-kcrrp       2/2     Running   0          2m6s
One last step before we can access the application is to make sure it’s accessible from outside our Kubernetes cluster. This is done using an Istio Gateway.
First, we’ll define the ingress gateway for the application:
kubectl apply -f samples/bookinfo/networking/bookinfo-gateway.yaml
Let’s confirm the gateway was created with:
kubectl get gateway

NAME               AGE
bookinfo-gateway   16s
Next, we need to set the INGRESS_HOST and INGRESS_PORT variables for accessing the gateway. To do this, we’re going to verify that our cluster supports an external load balancer:
kubectl get svc istio-ingressgateway -n istio-system

NAME                   TYPE           CLUSTER-IP    EXTERNAL-IP    PORT(S)                                                                                                                                     AGEistio-ingressgateway   LoadBalancer   10.0.15.240   35.239.99.74   15020:31341/TCP,80:31380/TCP,443:31390/TCP,31400:31400/TCP,15029:31578/TCP,15030:32023/TCP,15031:31944/TCP,15032:32131/TCP,15443:3
As we can see, the EXTERNAL_IP value is set, meaning our environment has an external load balancer to use for the ingress gateway.
To set the ingress IP and ports, we’ll use:
export INGRESS_HOST=$(kubectl -n istio-system get service istio-ingressgateway -o jsonpath='{.status.loadBalancer.ingress[0].ip}')

export INGRESS_PORT=$(kubectl -n istio-system get service istio-ingressgateway -o jsonpath='{.spec.ports[?(@.name=="http2")].port}')

export SECURE_INGRESS_PORT=$(kubectl -n istio-system get service istio-ingressgateway -o jsonpath='{.spec.ports[?(@.name=="https")].port}')
Finally, let’s set GATEWAY_URL:
export GATEWAY_URL=$INGRESS_HOST:$INGRESS_PORT
To confirm that the Bookinfo application is accessible from outside the cluster, we can run the following command:
curl -s http://${GATEWAY_URL}/productpage | grep -o "<title>.*</title>"
<title>Simple Bookstore App</title>
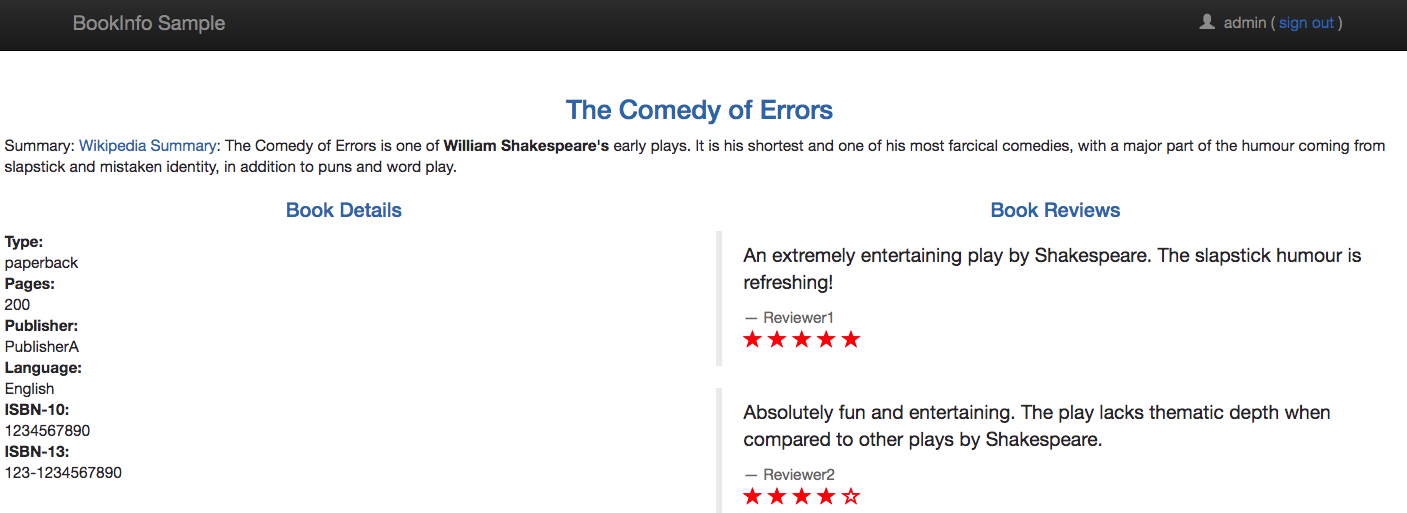
You can also point your browser to http://<externalIP>/productpage to view the Bookinfo web page:
Step 3: Shipping Istio logs
Great! We’ve installed Istio and deployed a sample application that makes use of Istio features for controlling and routing requests to the application’s services. We can now move on to the next step which is monitoring Istio’s operation using the ELK (or EFK) Stack.
Using the EFK Stack
If you want to ship Istion logs into your own EFK Stack (Elasticsearch, fluentd and Kibana), I recommend using the deployment stack documented by the Istio team. Of course, it contains fluentd and not Logstash for aggregating and forwarding the logs.
Note, the components here are the open-source versions of Elasticsearch and Kibana 6.1. The same logging namespace is used for all the specifications.
First, create a new deployment YAML:
sudo vim efk-stack.yaml
Then, paste the following deployment specifications:
apiVersion: v1
kind: Namespace
metadata:
  name: logging
---
# Elasticsearch Service
apiVersion: v1
kind: Service
metadata:
  name: elasticsearch
  namespace: logging
  labels:
    app: elasticsearch
spec:
  ports:
  - port: 9200
    protocol: TCP
    targetPort: db
  selector:
    app: elasticsearch
---
# Elasticsearch Deployment
apiVersion: extensions/v1beta1
kind: Deployment
metadata:
  name: elasticsearch
  namespace: logging
  labels:
    app: elasticsearch
spec:
  template:
    metadata:
      labels:
        app: elasticsearch
      annotations:
        sidecar.istio.io/inject: "false"
    spec:
      containers:
      - image: docker.elastic.co/elasticsearch/elasticsearch-oss:6.1.1
        name: elasticsearch
        resources:
          # need more cpu upon initialization, therefore burstable class
          limits:
            cpu: 1000m
          requests:
            cpu: 100m
        env:
          - name: discovery.type
            value: single-node
        ports:
        - containerPort: 9200
          name: db
          protocol: TCP
        - containerPort: 9300
          name: transport
          protocol: TCP
        volumeMounts:
        - name: elasticsearch
          mountPath: /data
      volumes:
      - name: elasticsearch
        emptyDir: {}
---
# Fluentd Service
apiVersion: v1
kind: Service
metadata:
  name: fluentd-es
  namespace: logging
  labels:
    app: fluentd-es
spec:
  ports:
  - name: fluentd-tcp
    port: 24224
    protocol: TCP
    targetPort: 24224
  - name: fluentd-udp
    port: 24224
    protocol: UDP
    targetPort: 24224
  selector:
    app: fluentd-es
---
# Fluentd Deployment
apiVersion: extensions/v1beta1
kind: Deployment
metadata:
  name: fluentd-es
  namespace: logging
  labels:
    app: fluentd-es
spec:
  template:
    metadata:
      labels:
        app: fluentd-es
      annotations:
        sidecar.istio.io/inject: "false"
    spec:
      containers:
      - name: fluentd-es
        image: gcr.io/google-containers/fluentd-elasticsearch:v2.0.1
        env:
        - name: FLUENTD_ARGS
          value: --no-supervisor -q
        resources:
          limits:
            memory: 500Mi
          requests:
            cpu: 100m
            memory: 200Mi
        volumeMounts:
        - name: config-volume
          mountPath: /etc/fluent/config.d
      terminationGracePeriodSeconds: 30
      volumes:
      - name: config-volume
        configMap:
          name: fluentd-es-config
---
# Fluentd ConfigMap, contains config files.
kind: ConfigMap
apiVersion: v1
data:
  forward.input.conf: |-
    # Takes the messages sent over TCP
    <source>
      type forward
    </source>
  output.conf: |-
    <match **>
       type elasticsearch
       log_level info
       include_tag_key true
       host elasticsearch
       port 9200
       logstash_format true
       # Set the chunk limits.
       buffer_chunk_limit 2M
       buffer_queue_limit 8
       flush_interval 5s
       # Never wait longer than 5 minutes between retries.
       max_retry_wait 30
       # Disable the limit on the number of retries (retry forever).
       disable_retry_limit
       # Use multiple threads for processing.
       num_threads 2
    </match>
metadata:
  name: fluentd-es-config
  namespace: logging
---
# Kibana Service
apiVersion: v1
kind: Service
metadata:
  name: kibana
  namespace: logging
  labels:
    app: kibana
spec:
  ports:
  - port: 5601
    protocol: TCP
    targetPort: ui
  selector:
    app: kibana
---
# Kibana Deployment
apiVersion: extensions/v1beta1
kind: Deployment
metadata:
  name: kibana
  namespace: logging
  labels:
    app: kibana
spec:
  template:
    metadata:
      labels:
        app: kibana
      annotations:
        sidecar.istio.io/inject: "false"
    spec:
      containers:
      - name: kibana
        image: docker.elastic.co/kibana/kibana-oss:6.1.1
        resources:
          # need more cpu upon initialization, therefore burstable class
          limits:
            cpu: 1000m
          requests:
            cpu: 100m
        env:
          - name: ELASTICSEARCH_URL
            value: http://elasticsearch:9200
        ports:
        - containerPort: 5601
          name: ui
          protocol: TCP
---
Then, create the resources with:
kubectl apply -f logging-stack.yaml

namespace "logging" created
service "elasticsearch" created
deployment "elasticsearch" created
service "fluentd-es" created
deployment "fluentd-es" created
configmap "fluentd-es-config" created
service "kibana" created
deployment "kibana" created
To access the data in Kibana, you’ll need to set up port forwarding. Run the command below and leave it running:
kubectl -n logging port-forward $(kubectl -n logging get pod -l
app=kibana -o jsonpath='{.items[0].metadata.name}') 5601:5601 &
Using Logz.io
Istio logging with Logz.io is done using a dedicated daemonset for shipping Kubernetes logs to Logz.io. Every node in your Kubernetes cluster will deploy a fluentd pod that is configured to ship container logs in the pods on that node to Logz.io. Including our Istio pods.
First, clone the Logz.io Kubernetes repo:
git clone https://github.com/logzio/logzio-k8s/
cd /logz.io/logzio-k8s/
Open the daemonset configuration file:
sudo vim logzio-daemonset-rbac.yaml

---
apiVersion: v1
kind: ServiceAccount
metadata:
  name: fluentd
  namespace: kube-system

---
apiVersion: rbac.authorization.k8s.io/v1
kind: ClusterRole
metadata:
  name: fluentd
  namespace: kube-system
rules:
- apiGroups:
  - ""
  resources:
  - pods
  - namespaces
  verbs:
  - get
  - list
  - watch

---
kind: ClusterRoleBinding
apiVersion: rbac.authorization.k8s.io/v1
metadata:
  name: fluentd
roleRef:
  kind: ClusterRole
  name: fluentd
  apiGroup: rbac.authorization.k8s.io
subjects:
- kind: ServiceAccount
  name: fluentd
  namespace: kube-system
---
apiVersion: extensions/v1beta1
kind: DaemonSet
metadata:
  name: fluentd-logzio
  namespace: kube-system
  labels:
    k8s-app: fluentd-logzio
    version: v1
    kubernetes.io/cluster-service: "true"
spec:
  template:
    metadata:
      labels:
        k8s-app: fluentd-logzio
        version: v1
        kubernetes.io/cluster-service: "true"
    spec:
      serviceAccount: fluentd
      serviceAccountName: fluentd
      tolerations:
      - key: node-role.kubernetes.io/master
        effect: NoSchedule
      containers:
      - name: fluentd
        image: logzio/logzio-k8s:latest
        env:
        - name:  LOGZIO_TOKEN
          value: "yourToken"
        - name:  LOGZIO_URL
          value: "listenerURL"
        resources:
          limits:
            memory: 200Mi
          requests:
            cpu: 100m
            memory: 200Mi
        volumeMounts:
        - name: varlog
          mountPath: /var/log
        - name: varlibdockercontainers
          mountPath: /var/lib/docker/containers
          readOnly: true
      terminationGracePeriodSeconds: 30
      volumes:
      - name: varlog
        hostPath:
          path: /var/log
      - name: varlibdockercontainers
        hostPath:
          path: /var/lib/docker/containers
Enter the values for the following two environment variables in the file:
- LOGZIO_TOKEN – your Logz.io account token. Can be retrieved from within the Logz.io UI, on the Settings page.
- LOGZIO_URL – the Logz.io listener URL. If the account is in the EU region insert https://listener-eu.logz.io:8071. Otherwise, use https://listener.logz.io:8071. You can tell your account’s region by checking your login URL – app.logz.io means you are in the US. app-eu.logz.io means you are in the EU.
Save the file.
Create the resource with:
kubectl create -f logzio-daemonset-rbac.yaml

serviceaccount "fluentd" created
clusterrole.rbac.authorization.k8s.io "fluentd" created
clusterrolebinding.rbac.authorization.k8s.io "fluentd" created
daemonset.extensions "fluentd-logzio" created
In Logz.io, you will see container logs displayed on the Discover page in Kibana after a minute or two:

Step 4: Analyzing Istio logs in Kibana
Congrats! You’ve built a logging pipeline for monitoring your Kubernetes cluster and your Istio service mesh! What now?
Kibana is a great tool for diving into logs and offers users a wide variety of search methods when troubleshooting. Recent improvement to the search experience in Kibana, including new filtering and auto-completion, make querying your logs an easy and intuitive experience.
Starting with the basics, you can enter a free text search for a specific URL called by a request. Say you want to look for Istio Envoy logs:
"envoy"

Or, you can use a field-level search to look for Istio Mixer telemetry logs:
kubernetes.container_name : "mixer" and
kubernetes.labels.istio-mixer-type : "telemetry"

As you start analyzing your Istio logs, you’ll grow more comfortable with performing different types of searches and as I mentioned above, Kibana makes this an extremely simple experience.
What about visualizing Istio logs?
Well, Kibana is renowned for its visualization capabilities with almost 20 different visualization types which you can choose from. Below are some examples.
No. of Istio logs
Let’s start with the basics – a simple metric visualization showing the number of incoming Istio logs coming in from the different Istio components (i.e. Envoy, Mixer, Citadel, etc.). Since fluentd is shipping logs across the Kubernetes cluster, I’m using a search to narrow down on Istio logs only:
kubernetes.namespace_name : "istio-system"

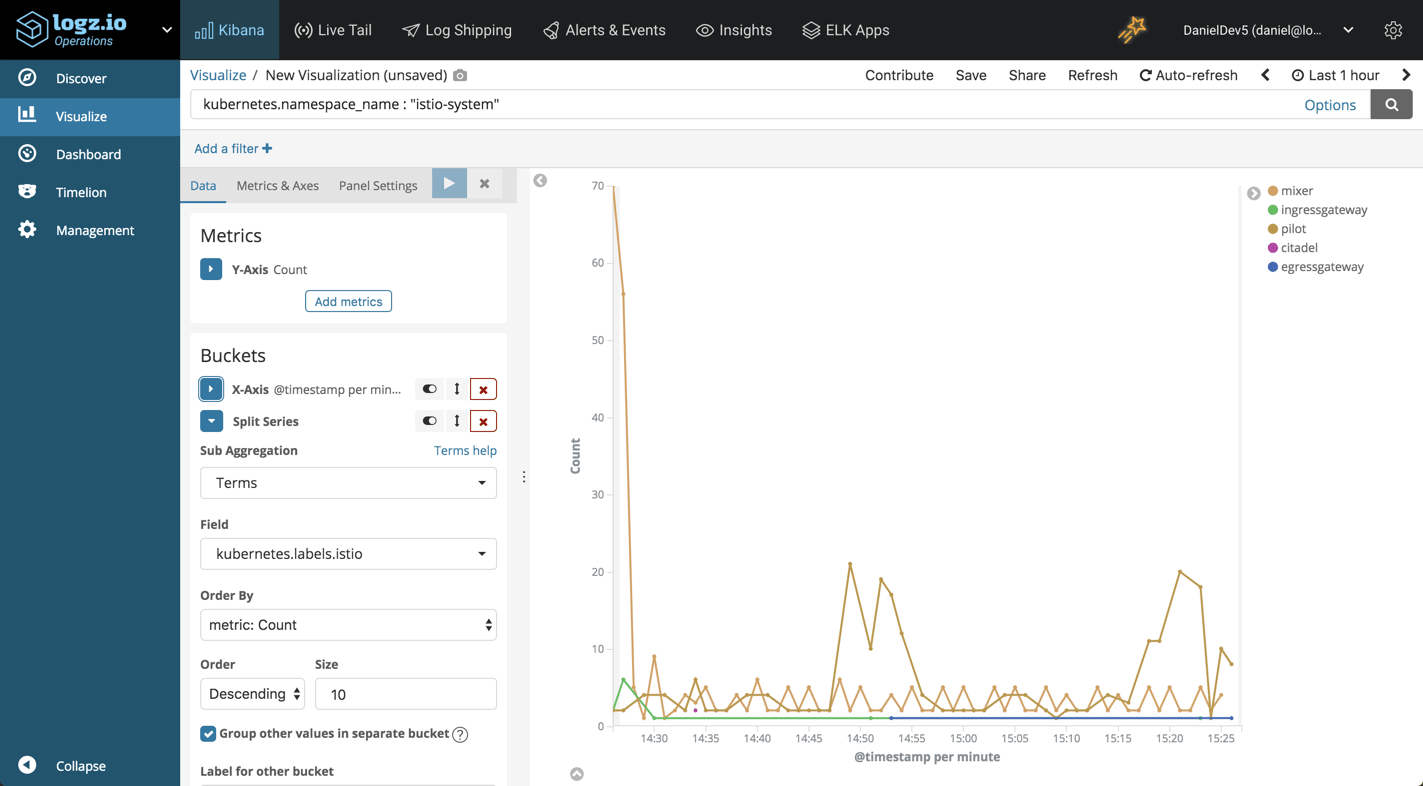
No. of Istio logs over time
What about a trend over time of the incoming Istio logs? As with any infrastructure layer, this could be a good indicator of abnormal behavior.
To visualize this, we can use the same search in a line chart visualization. We will also add a split series into the mix, to breakdown the logs per Istio component using the kubernetes.labels.istio field:
Istio logs breakdown
A good old pie chart can provide us with a general idea of what Istio components is creating the more noise:

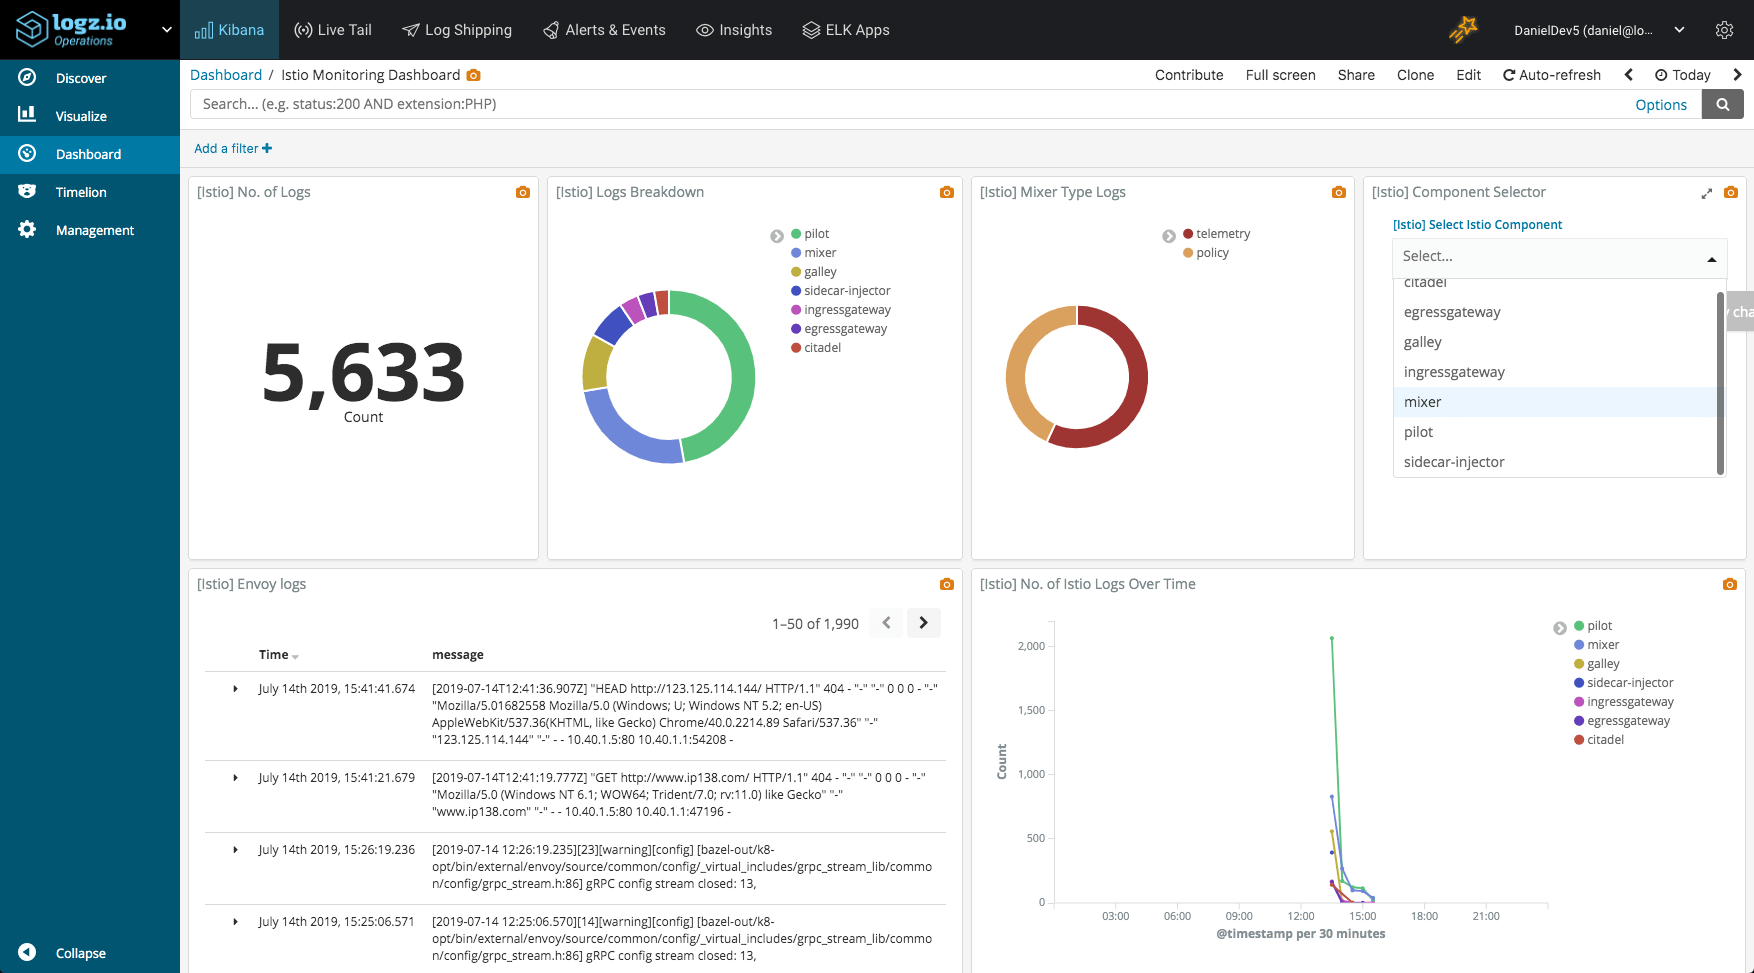
Once you have your Iatio visualizations lined up, you can add them all up into one beautiful Kibana dashboard:
Summing it up
Microservice architectures solve some problems but introduce others. Yes, developing, deploying and scaling applications have become simpler. But the infrastructure layer handling the communication between these applications, aka the service mesh, can become very complicated. Istio aims to reduce this complexity and the ELK Stack can be used to compliment Istio’s monitoring features by providing a centralized data backend together with rich analysis functionality.
Whether or not you need to implement a service mesh is an entirely different question. For some organizations, service discovery and network management features of existing API gateways and Kubernetes might be enough. The technology itself is still relatively immature, so there is some risk involved. Still, 2019 is developing to be the year of the service mesh and Istio itself is seeing growing adoption. As the technology matures, and costs and risks gradually go down, the tipping point for adopting service mesh is fast approaching.

You Might Also Like

The Cost of Building an In-House Monitoring Solution for Metrics