Logz.io Upgrades App 360, Kubernetes 360 with AI Assistant, New Tracing Quickview
June 3, 2024

At Logz.io, we believe the future of observability will center on the rapid advancement of automation, innovations around artificial intelligence, and streamlining processes that currently remain far too complex.
This is no different than many other areas of technology, but the opportunities in observability are vast, and we see all of these areas connecting and driving improvements to the Logz.io Open 360™ platform.
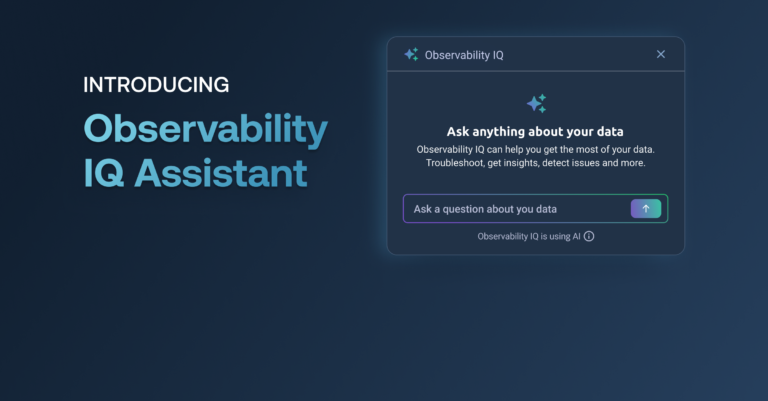
We reached a major milestone in May 2024 with the introduction of our Observability IQ AI technology stack, and in particular the Observability IQ Assistant. We built IQ Assistant to simplify core tasks for analysts using our platform, performing investigations in a far more intuitive manner.
IQ Assistant proposes relevant questions using a context-aware approach and suggests the best paths of resolution, even faster — providing specific, infomed response steps. Analysts can also input their own questions and expect results that provide immediate insights.
When we posted the announcement, we said IQ Assistant had initially been integrated into our Explore log management feature, and that it would be added to other areas of Open 360 soon. We’re now thrilled to offer Observability IQ Assistant for Open 360 customers utilizing App 360 for application observability and service health, and Kubernetes 360 for infrastructure health.
For customers who have their data in the App 360 and Kubernetes 360 solutions, IQ Assistant can act as your guided copilot. It can generate everything from detailed insights into a particular service being investigated, to guidance on what users should analyze next, and how to best use Open 360 to action their work.
IQ Assistant also offers correlated evidence of why an issue occurred, conclusive determination of related impacts and detailed steps to help inform resolution.
Our advanced AI and machine learning capabilities were already embedded into App 360, notably with our Anomaly Detection for App 360. This provides targeted functionality that teams need to ensure they are automatically alerted whenever their most important services and microservices fall outside expected parameters, or simply behave abnormally.
New App 360/K8s360 Quickview Gives Customers Tracing Info at Their Fingertips
We’re also pushing to meet customers where they are when it comes to understanding and monitoring all aspects of their critical applications and infrastructure. We’ve done this with an update to the Tracing Quickview feature in both App 360 and Kubernetes 360.
We built this new tracing UI to replace the Jaeger-based trace visualization that was previously part of both areas of the Open 360 platform, and the new views are designed to improve customer interactions with trace data.
Users will get a smoother and faster trace visualization, and improved UX for faster troubleshooting, and reduced loading times for an efficient in-and-out experience. When you add the power of IQ Assistant and LLM-backed analysis on top of this revised interface, we believe that’s a big step forward.
These new tracing views help meet a number of important observability use cases. Much of the improvements are rooted in providing critical context and detailed information down to the individual trace level to gain important insights into its behavior.

By clicking on a trace node, users will gain a detailed view of that trace, including the duraton, start and end times, and any relevant tags or metadata. Customers can also view logs and associated events related to a selected trace node for deeper analysis.
The UI shows the context of the trace, such as related spans and their timings, to understand the distributed flow better.
If a user wants to search for specific traces and apply filters to narrow down the scope of the displayed traces, they can:
- Enter search queries to find traces based on specific criteria (e.g., service name, operation name, tags)
- Apply filters to display traces that meet certain conditions (e.g., duration, status codes, errors)
- Combine multiple filters to perform advanced queries and find specific patterns or anomalies
If a user wants to view traces as interactive graphs to understand the relationships between distributed components, the new UI presents traces as directed acyclic graphs (DAG) with nodes representing individual services or operations. Users can:
- Navigate and zoom in/out of the trace graph to focus on specific parts of the distributed system
- See critical path information to identify performance bottlenecks easily
- Customize the layout and appearance of the trace graph for better visualization

Traces can also be visualized using a Gantt chart representation to understand the timing and sequence of events within distributed transactions.
Discover more in our Docs about the new App 360 tracing quickview and the new Kubernetes 360 tracing quickview.
If you want to see how the Open 360 platform and Observability IQ can help simplify and streamline your biggest observability challenges, get started by signing up for a free trial today.
You Might Also Like

Does Your Observability Practice Lack Maturity? Here’s What to Do.

