Reducing Cloud Operations Costs with the Data Optimizer
December 13, 2017
This November, we released the Data Optimizer — a cost reduction and optimization tool that helps organizations break away from existing pricing paradigms in the log analysis industry by giving them the flexibility to decide what data is important and needs retaining, how long to retain it for, and at what granularity.
Users can now store key metrics and important data in Timeless Accounts using what we call Optimizers — aggregation rules that summarize the data, reducing the original log size, and push it into these accounts.
In this article, I’m going to show you a real-life example of how the Data Optimizer can be used to reduce costs. The scenario described is focused on analyzing Amazon Elastic Load Balancers (ELB) access logs, but it’s up to you guys to imagine applying the same workflow in your environments.
Understanding the scenario
As I mentioned above, we will be focusing on monitoring ELB access logs.
Elastic Load Balancers (ELB) allow AWS users to distribute traffic across EC2 instances. ELB access logs are one of the options used to monitor and troubleshoot this traffic. The data in these logs include information on where the ELB was accessed from, which internal machines were accessed, the identity of the requester (such as the operating system and browser), and additional metrics such as processing time and traffic volume.
There are a variety of different use cases for this data – troubleshooting and forensics, security, monitoring, and so forth. What is crucial to understand is that each use case necessitates a different retention model.More on the subject:
If it’s troubleshooting, you will most likely require all the logs, in their original format, but for a relatively limited retention period (e.g. 3-5 days). But say you want to measure the operational health of your ELBs over time? You would need longer retention — a year, or even longer. Storing all your ELB access logs, with year-long retention, would cost a fortune.
What if you could differentiate between these two use cases? What if you could store all your logs for a couple of days while aggregating only a metric or two included in the logs for an extended retention period?
Let’s see how this is done with the Data Optimizer.
Creating a new Timeless Account
The Data Optimizer is comprised of two main components – Timeless Accounts, which is where the important data we want to retain over time is stored and indexed, and Optimizers – aggregation rules that summarize our logs and push them into the Timeless Accounts.
So our first step is to create a new Timeless Account. This is done on the Manage Accounts page, under Settings.
Here we can see a list of both our regular time-based accounts (main and sub) and any existing Timeless Accounts we might have created. To create a new Timeless Account, all we have to do is click the Add new button.
In the section that opens up, we will enter a new name for the account (ELB metrics) and the data volume that we want to allocate to the account (10 GB). We will also select the sub accounts we want to give read and write permissions to.
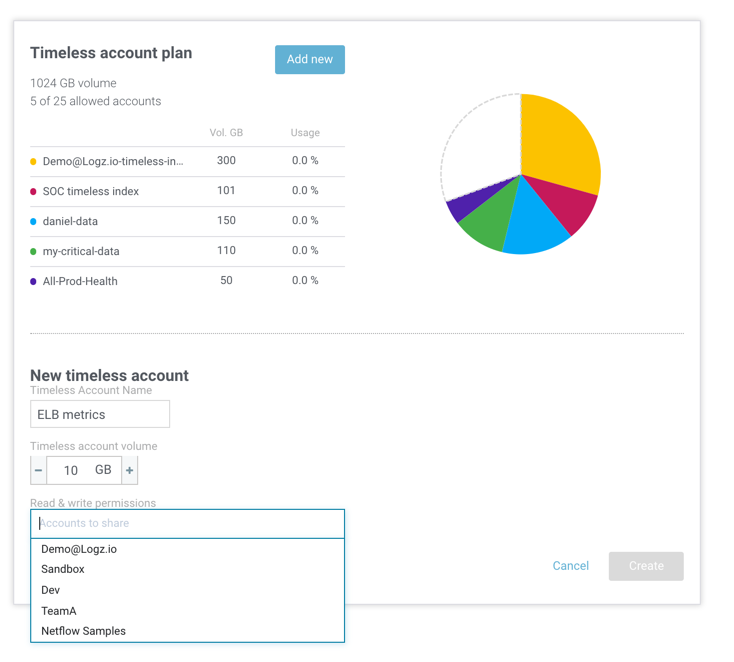
Hitting the Create button adds our new Timeless Account to the list. What is actually happening in the background is that we have asked Logz.io to create a new Elasticsearch index associated with our main account.
We can now begin to ship our ELB data into the account. But how?
Creating your Optimizer
To push data into a Timeless Account, we will use what is called Optimizers. Optimizers are rules that we define that tell Logz.io exactly what log data to aggregate, how to aggregate it, at what interval and to what Timeless Account.
We’ll start, as usual, in the Discover tab in Kibana, where we will first enter a query searching for our ELB access logs.
type:elb
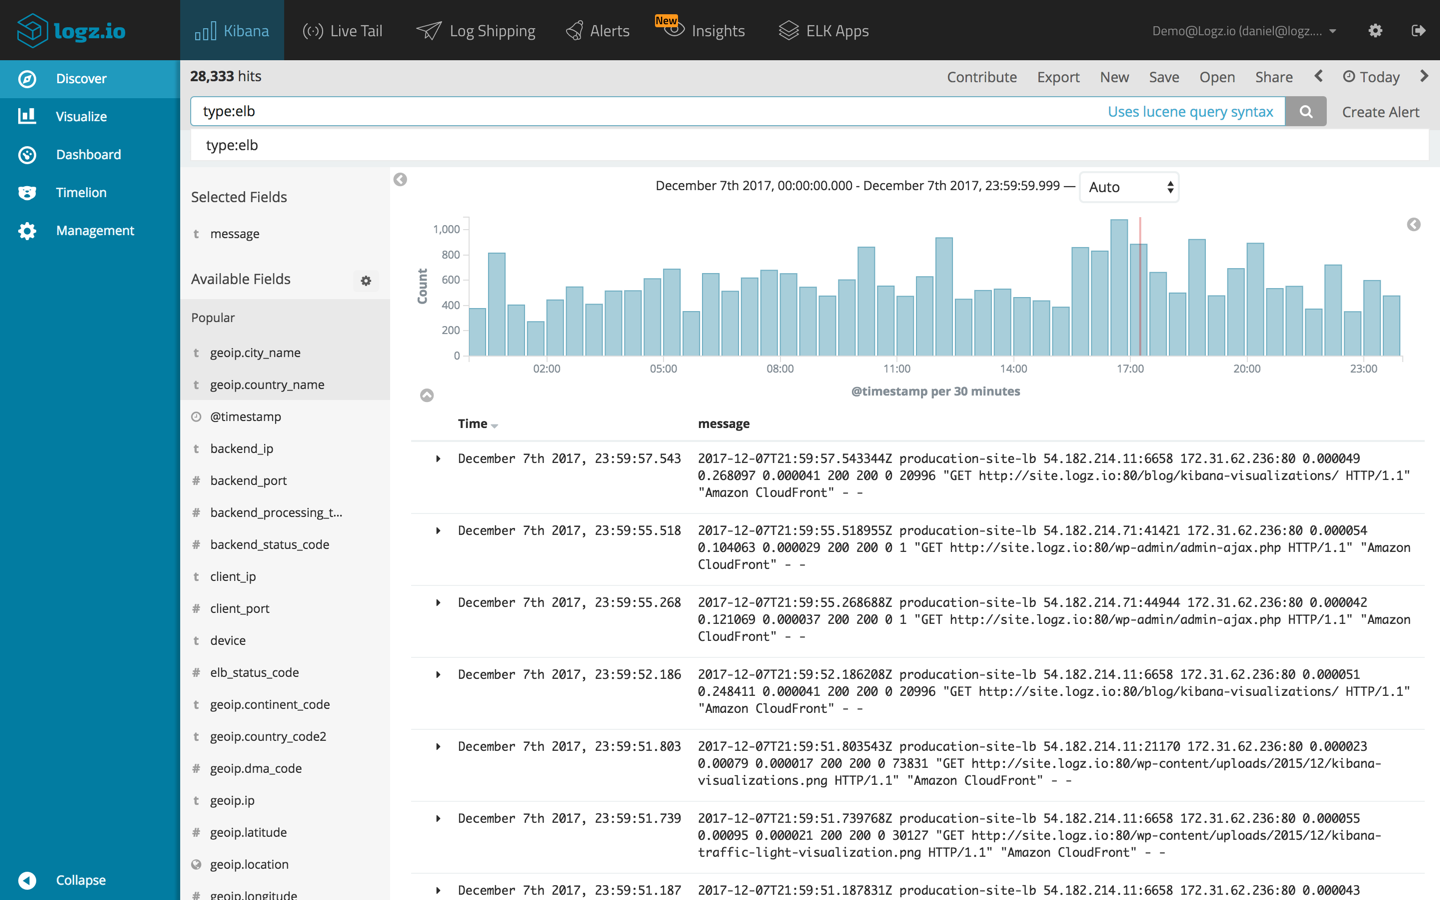
Opening up one of the logs, we can see a long list of the different fields available for analysis. But what interests us, for the purpose of analyzing the performance of our ELB instances, is one specific field – the backend_processing_time field.
It makes no sense retaining all of our logs. Instead, what we’re going to do is create a new Optimizer that will summarize the processing time metric and push the results into our new Timeless Account for extended retention.
To do this, we’re going to hit the Create Alert button, in the top-right corner of the UI.
In the Create a New Alert/Optimizer page that is opened, we are now going to define our aggregation rule.
Our Kibana query is already entered in the Query field.
In the Group by section, we can decide what fields we want our Optimizer to group by. In our example, I want to be able to group the value for backend_processing_time by geographic location. To to this, I will define two grouping levels using the geoip.country_name and geoip.city_name fields:
Next, in the Definitions section, I’m going to enter a name (ELB Backend Processing Time – Avg) for the new Optimizer.
In the Action section, I’m going to select Optimizer, and then select the new Timeless Account we created.
The Trigger section is where we define what kind of summary action to perform on the data. In our case, we are going to ask our Optimizer to save an average of the backend_processing_time field, every 10 minutes.
Clicking the Create button creates our new Optimizer, and from this point onwards, it will begin to summarize and aggregate the data according to the rules we defined.
Analyzing the data
The data can be analyzed in Kibana using a simple query of the logzio_optimizer_name field:
logzio_optimizer_name: “ELB Backend Processing Time - Avg”
Our search results display the summarized ELB access log, as we defined in our Optimizer, the only fields being indexed in the selected Timeless Account – geoip.country_name and geoip.city_name.
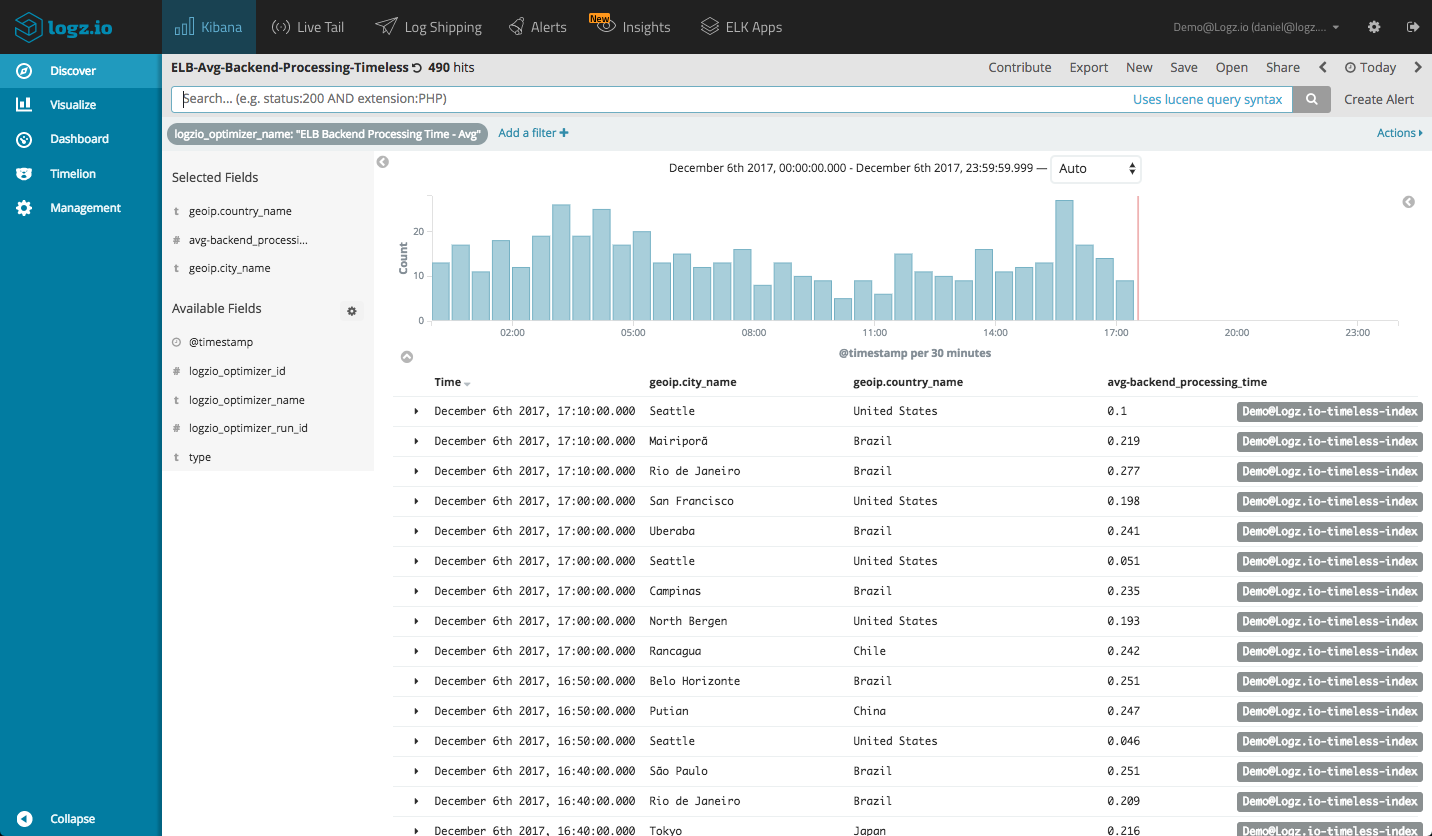
The messages aggregated into the Timeless Account are smaller in size, and thus will take up less storage and cost us less over time.
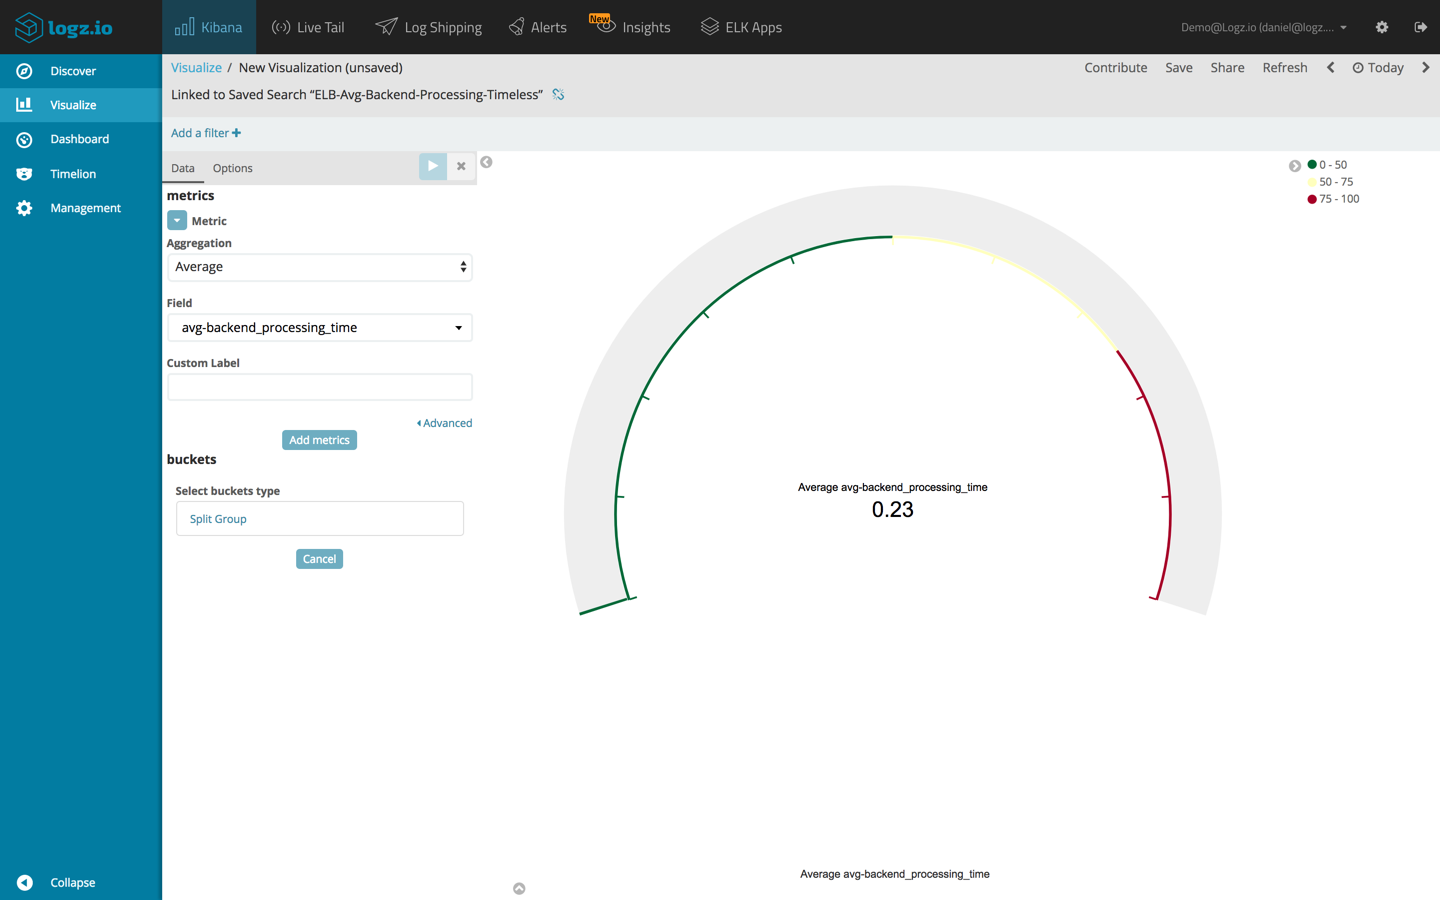
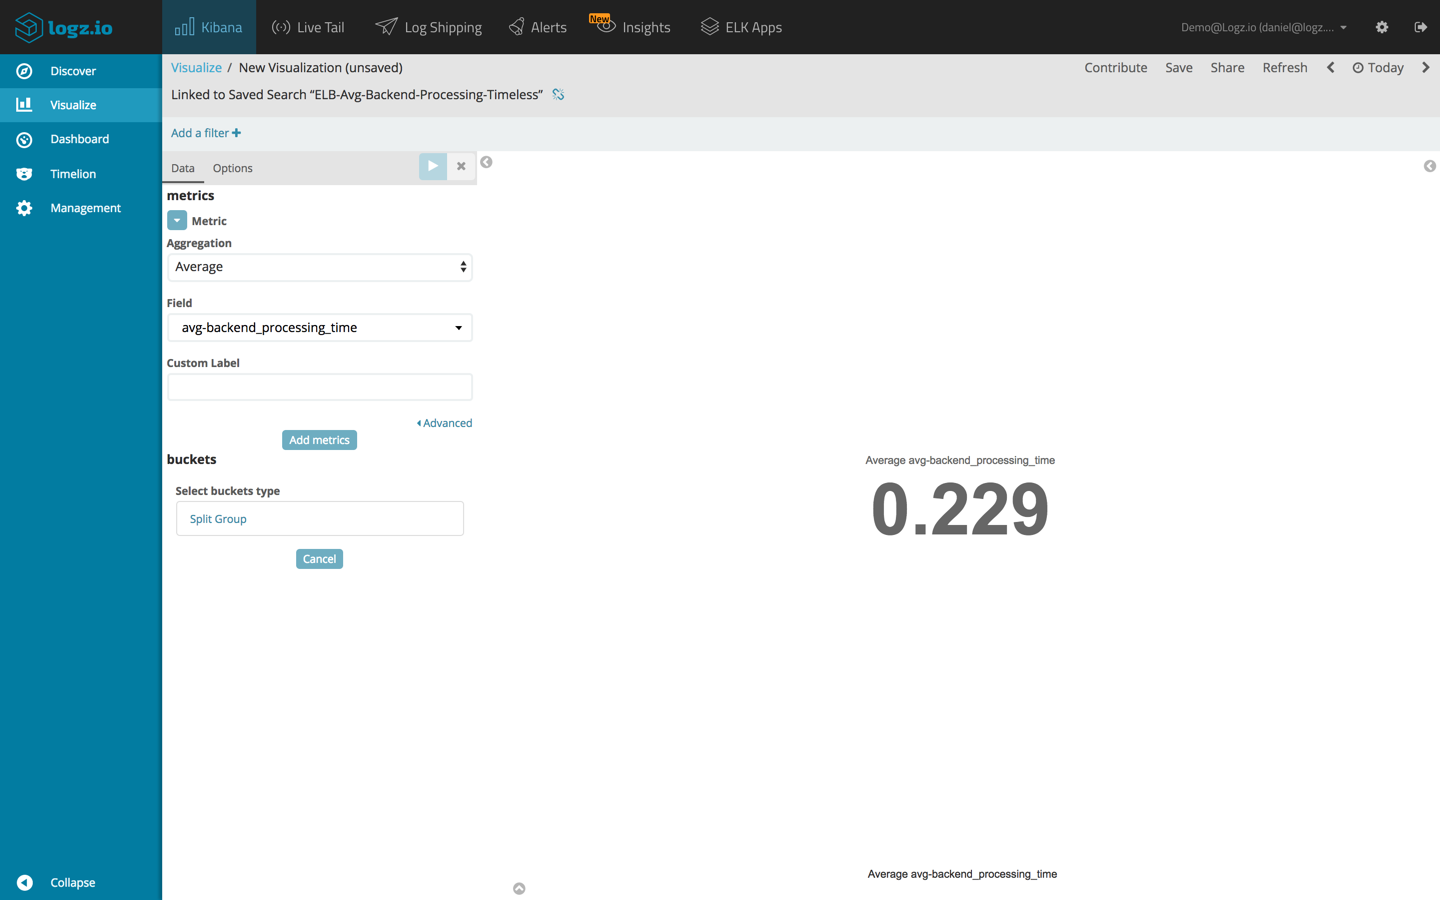
Moreover, we can also now use this reduced-in-size data as a basis for further analysis. We can, for example, create a series of visualizations for monitoring the average backend processing time over time.
Two basic examples are a Gauge/Metric visualization, showing the average processing time:
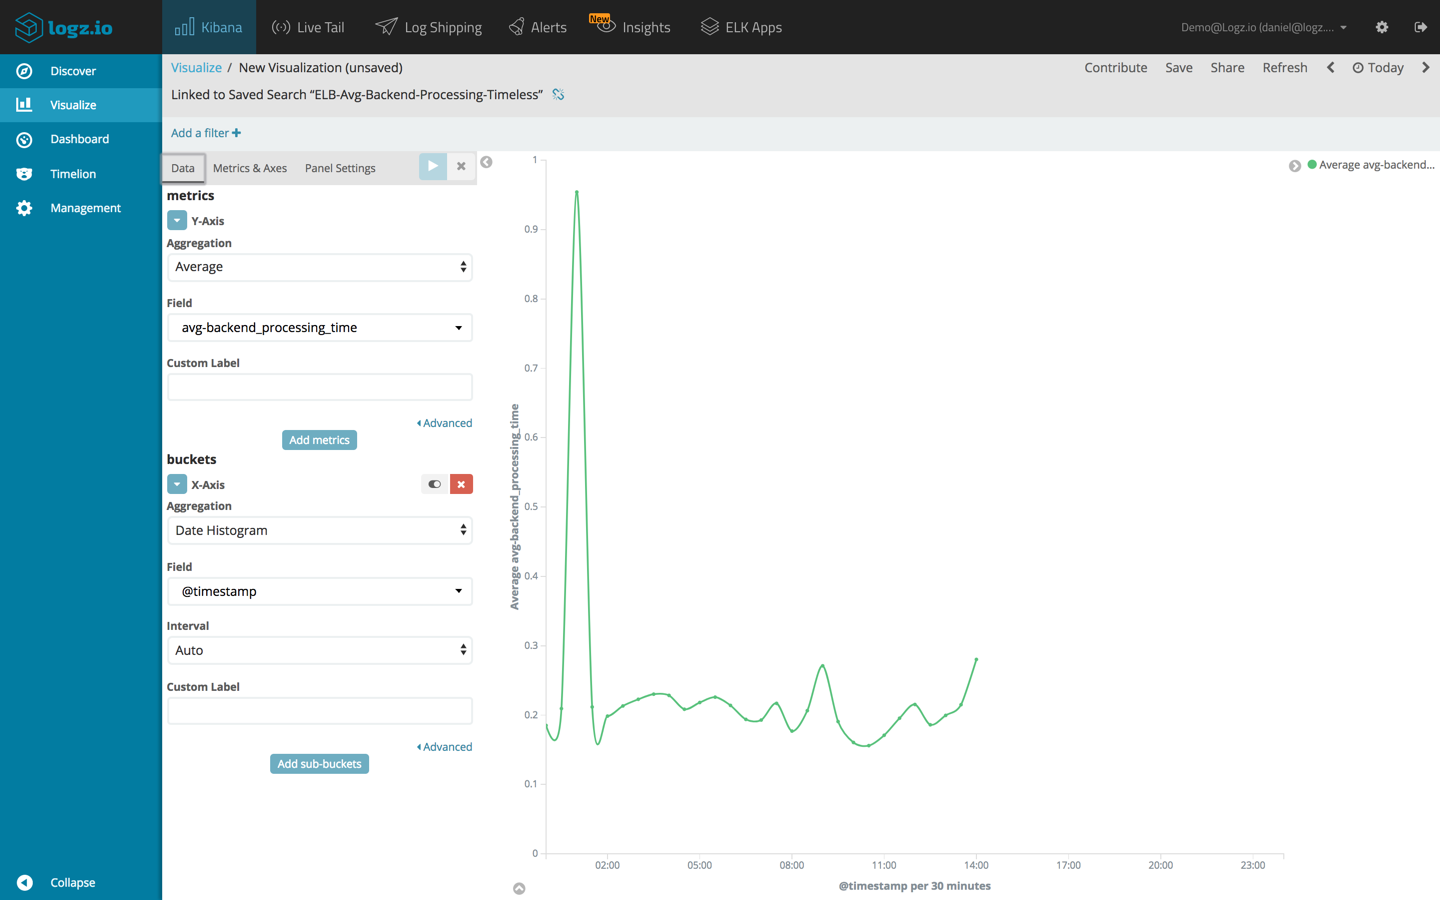
Another option is a Line Chart visualization for analysis over time:
Summing it up
Organizations are logging a growing amount of data being generated by their environments and paying increasing amounts of money to retain it despite the fact that a lot of the data does not need to be retained in the first place.
In many cases, only a small amount of your log data is actually important and needs to be retained, but the retention models offered by existing logging vendors do not recognize this fact and offer rigid pricing models.
The Logz.io Data Optimizer gives users the flexibility to decide what data is important enough to retain for an extended period of time, decide how long they want to retain it for and at what granularity.

You Might Also Like

Open 360TM Platform Overview Webinar

