Kafka Logging with the ELK Stack
February 7, 2019
Kafka and the ELK Stack—usually these two are part of the same architectural solution, Kafka acting as a buffer in front of Logstash to ensure resiliency. This article explores a different combination—using the ELK Stack to collect and analyze Kafka logging.
More on the subject:
As explained in a previous post, Kafka plays a key role in our architecture. As such, we’ve constructed a monitoring system to ensure data is flowing through the pipelines as expected. Key performance metrics, such as latency and lag, are closely monitored using a variety of processes and tools.
Another element in this monitoring system is Kafka logs.
Kafka generates multiple types of log files, but we’ve found the server logs to be of particular use. We collect these logs using Filebeat, add metadata fields, and apply parsing configurations to parse out the log level and Java class.
In this article, I’ll provide the instructions required to hook up your Kafka servers to the ELK Stack or Logz.io so you can set up your own Kafka logging system. The first few steps explain how to install Kafka and test it to generate some sample server logs. However, if you already have Kafka up and running, simply skip to the next steps that involve installing the ELK Stack and setting up the Kafka logging pipeline.
Installing Kafka
Installing Kafka on Linux or Mac
Java is required for running both Kafka and the ELK Stack, so let’s start with installing Java:
sudo apt-get update
sudo apt-get install default-jre
Next, Apache Kafka uses ZooKeeper for maintaining configuration information and synchronization so we’ll need to install ZooKeeper before setting up Kafka:
sudo apt-get install zookeeperd
By default, ZooKeeper listens on port 2181. You can check by running the following command:
netstat -nlpt | grep ':2181'
Next, let’s download and extract Kafka:
wget https://apache.mivzakim.net/kafka/2.2.0/kafka_2.12-2.2.0.tgz
tar -xvzf kafka_2.12-2.2.0.tgz
sudo cp -r kafka_2.12-2.2.0 /opt/kafka
We are now ready to run kafka, which we will do with this script:
sudo /opt/kafka/bin/kafka-server-start.sh
/opt/kafka/config/server.properties
You should see a long list of INFO messages displayed, at the end of which a message informing you that Kafka was successfully started:
[2018-12-30 08:57:45,714] INFO Kafka version : 2.2.0 (org.apache.kafka.common.utils.AppInfoParser)
[2018-12-30 08:57:45,714] INFO Kafka commitId : 809be928f1ae004e (org.apache.kafka.common.utils.AppInfoParser)
[2018-12-30 08:57:45,716] INFO [KafkaServer id=0] started (kafka.server.KafkaServer)
Congrats, you have Kafka up and running, and listening on port 9092.
Installing Kafka on Mac with Homebrew
The process is straightforward here:
$ brew cask install java
$ brew install kafka

Installation of Kafka with Homebrew
Testing your Kafka server
Let’s take Kafka for a simple test run.
First, create your first topic with a single partition and one replica (we only have one Kafka server) using the following command:
/opt/kafka/bin/kafka-topics.sh --create --zookeeper localhost:2181
--replication-factor 1  --partitions 1 --topic danielTest
You should see the following output:
Created topic "danielTest"
When doing this with Homebrew on macOS, the command should read as such:
kafka-topics --create --zookeeper localhost:2181 --replication-factor 1 --partitions 1 --topic GedalyahTest
This will output the text, similarly, as:
Created topic GedalyahTest.
Using the console producer, we will now post some sample messages to our newly created Kafka topic:
/opt/kafka/bin/kafka-console-producer.sh --broker-list localhost:9092 --topic danielTest
In the prompt, enter some messages for the topic:
>This is just a test
>Typing a message
>OK
Or, run the following command when working with Homebrew:
kafka-console-producer --broker-list localhost:9092 --topic GedalyahTest
Similar messages will do.

In order to terminate console producer, you have two options. Kafka contains a flag for the maximum wait time for a new log. Should it not come, it will close automatically. If you want to close it before that, just enter the following command:
--timeout-ms
Or, make sure to have --no-wait-at-logend sitting at the end of your full kafka-console-producer command. This will avoid the waiting altogether and automatically close the console producer with every edit:
kafka-console-producer --broker-list localhost:9092 --topic GedalyahTest --no-wait-at-logend
In a separate tab, we will now run the Kafka consumer command to read data from Kafka and display the messages we submitted to the topic to stdout
/opt/kafka/bin/kafka-console-consumer.sh --bootstrap-server
localhost:9092 --topic danielTest --from-beginning
Or, in Brew:
kafka-console-consumer --bootstrap-server localhost:9092 --topic GedalyahTest --from-beginning
You should see the very same messages you submitted to the topic displayed:
This is just a test
Typing a message
OK

Installing the ELK Stack
Now that we have made sure are publish/subscribe mechanism is up, let’s install the components for logging Kafka: Elasticsearch, Kibana and Filebeat.
Start by downloading and installing the Elastic public signing key:
wget -qO - https://artifacts.elastic.co/GPG-KEY-elasticsearch | sudo
apt-key add -
Add the repository definition:
echo "deb https://artifacts.elastic.co/packages/6.x/apt stable main" |
sudo tee -a /etc/apt/sources.list.d/elastic-6.x.list
Update the system, and install Elasticsearch:
sudo apt-get update && sudo apt-get install elasticsearch
Run Elasticsearch using:
sudo service elasticsearch start
You can make sure Elasticsearch is running using the following cURL:
curl "http://localhost:9200"
You should be seeing an output similar to this:
{
  "name" : "6YVkfM0",
  "cluster_name" : "elasticsearch",
  "cluster_uuid" : "8d8-GCYiQoOQMJdDrzugdg",
  "version" : {
    "number" : "6.5.4",
    "build_flavor" : "default",
    "build_type" : "deb",
    "build_hash" : "d2ef93d",
    "build_date" : "2018-12-17T21:17:40.758843Z",
    "build_snapshot" : false,
    "lucene_version" : "7.5.0",
    "minimum_wire_compatibility_version" : "5.6.0",
    "minimum_index_compatibility_version" : "5.0.0"
  },
  "tagline" : "You Know, for Search"
}
Next up, we’re going to install Kibana with:
sudo apt-get install kibana
Open up the Kibana configuration file at: /etc/kibana/kibana.yml, and make sure you have the following configuration defined:
server.port: 5601
elasticsearch.url: "http://localhost:9200"
And, start Kibana with:
sudo service kibana start

To install Filebeat, use:
sudo apt install filebeat
Configuring the Kafka logging pipeline
I will describe two methods for shipping the Kafka logs into the ELK Stack — one if you’re using Logz.io, the other for shipping them into your own ELK deployment.
Shipping Kafka logs into Logz.io
To ship the data into Logz.io, we require some tweaks in the Filebeat configuration file. Since our listeners handle parsing, there’s no need for using Logstash in this case.
First, you will need to download an SSL certificate to use encryption:
wget https://raw.githubusercontent.com/logzio/public-certificates/master/
COMODORSADomainValidationSecureServerCA.crt

sudo mkdir -p /etc/pki/tls/certs

sudo cp COMODORSADomainValidationSecureServerCA.crt
/etc/pki/tls/certs/
The configuration file should look as follows:
filebeat.inputs:

- type: log
  paths:
    - /opt/kafka/logs/server.log
  fields:
    logzio_codec: plain
    token: <yourAccountToken>
    type: kafka_server
    env: dev
  fields_under_root: true
  encoding: utf-8
  ignore_older: 3h
  multiline:
    pattern: '\[[0-9]{4}-[0-9]{2}-[0-9]{2} [0-9]{2}:[0-9]{2}:[0-9]{2},[0-9]{3}\] ([A-a]lert|ALERT|[T|t]race|TRACE|[D|d]ebug|DEBUG|[N|n]otice|NOTICE|[I|i]nfo|INFO|[W|w]arn?(?:ing)?|WARN?(?:ING)?|[E|e]rr?(?:or)?|ERR?(?:OR)?|[C|c]rit?(?:ical)?|CRIT?(?:ICAL)?|[F|f]atal|FATAL|[S|s]evere|SEVERE|EMERG(?:ENCY)?|[Ee]merg(?:ency)?)'
    negate: true
    match: after

registry_file: /var/lib/filebeat/registry

output:
  logstash:
    hosts: ["listener.logz.io:5015"]
    ssl:
      certificate_authorities: ['/etc/pki/tls/certs/COMODORSADomainValidationSecureServerCA.crt']

processors:
  - add_host_metadata: ~
  - add_cloud_metadata: ~
A few notes about the configuration:
- Your Logz.io account token can be retrieved from the General settings page in Logz.io (click the cogwheel at the top-right corner).
- Be sure to use kafka_server as the log type to apply automatic parsing.
- I recommend verifying the YAML before starting Filebeat. You can use this online tool. Or, you can use the Filebeat wizard to generate the YAML file automatically (available in the Filebeat section, under Log Shipping in the UI).
Save the file and start Filebeat with:
sudo service filebeat start
You should begin to see your Kafka server logs appearing in Logz.io after a minute or two:
Shipping Kafka logs into the ELK Stack
To ship Kafka server logs into your own ELK, you can use the Kafka Filebeat module. The module collects the data, parses it and defines the Elasticsearch index pattern in Kibana.
To use the module, first define the path to the log files:
sudo vim /etc/filebeat/modules.d/kafka.yml.disabled

- module: kafka
   log:
    enabled: true
    #var.kafka_home:
    var.paths:
      - "/opt/kafka/logs/server.log"
Enable the module and set up the environment with:
sudo filebeat modules enable kafka
sudo filebeat setup -e
Finally, restart Filebeat:
sudo service filebeat restart
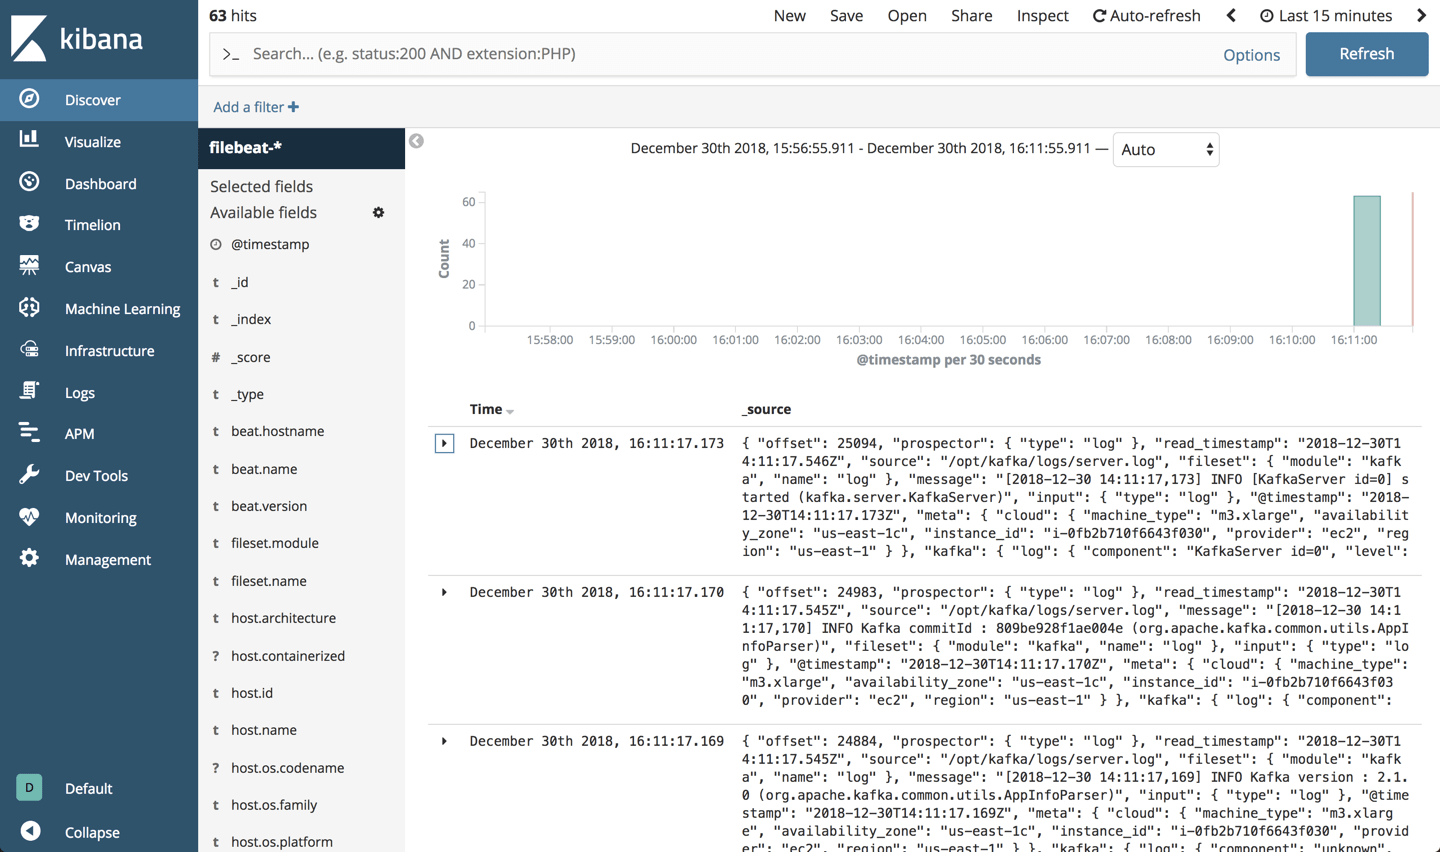
After a minute or two, opening Kibana you will find that a “filebeat-*” index is defined and Kafka server logs are displayed on the Discover page:
Analyzing the data
So – what are we looking for? What can be done with the Kafka server logs?
The parsing applied to the logs parses out some important fields — specifically, the log level and the Kafka class and log component generating the log. We can use these fields to monitor and troubleshoot Kafka in a variety of ways.
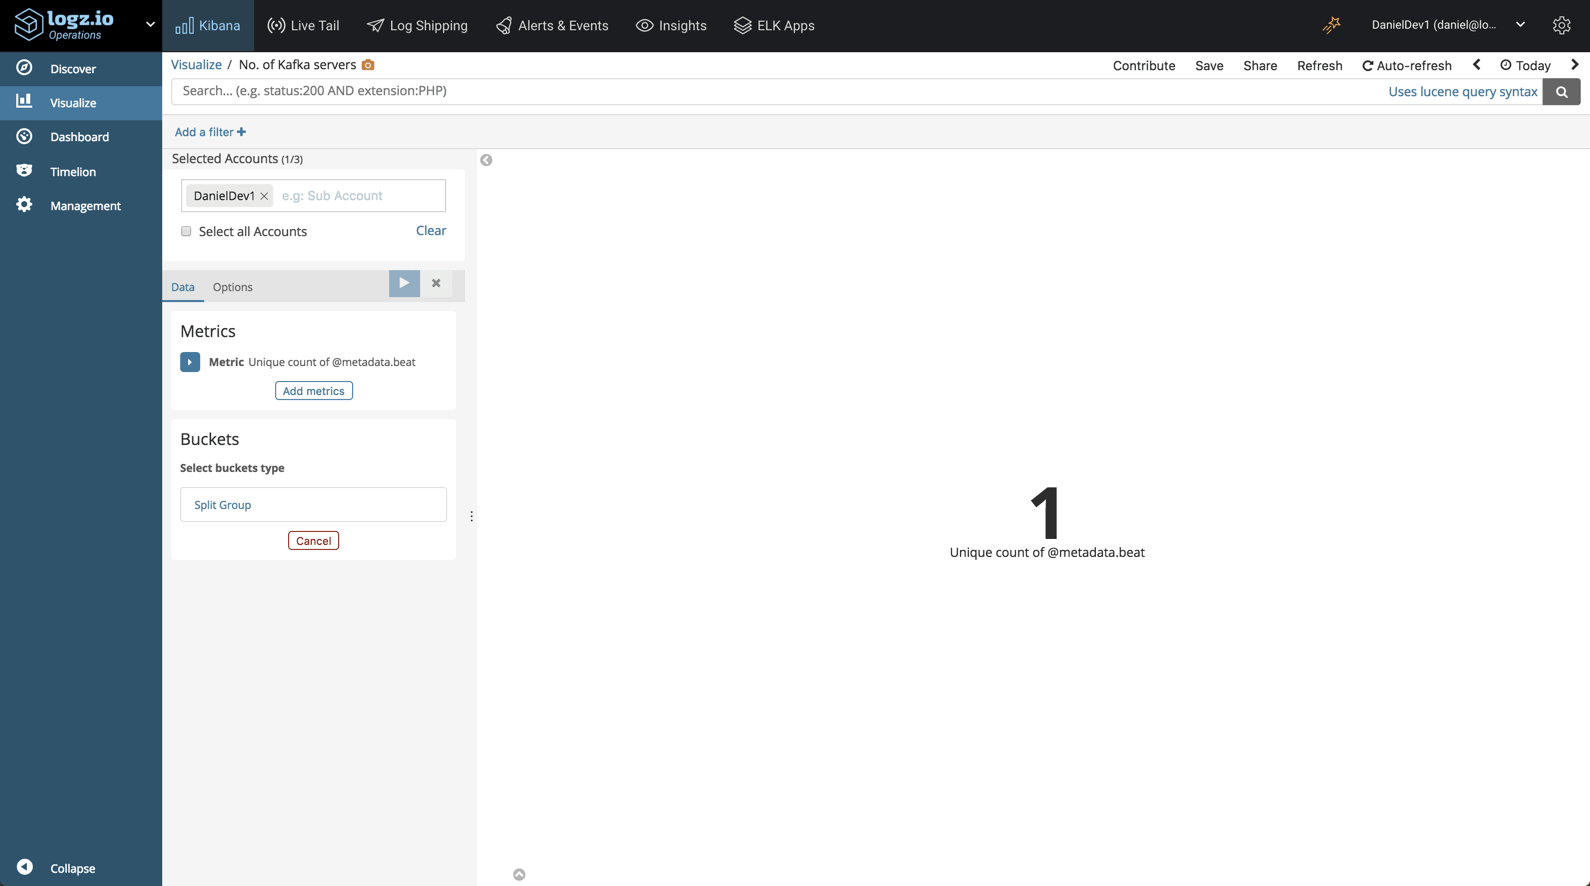
For example, we could create a simple visualization to display how many Kafka servers we’re running:
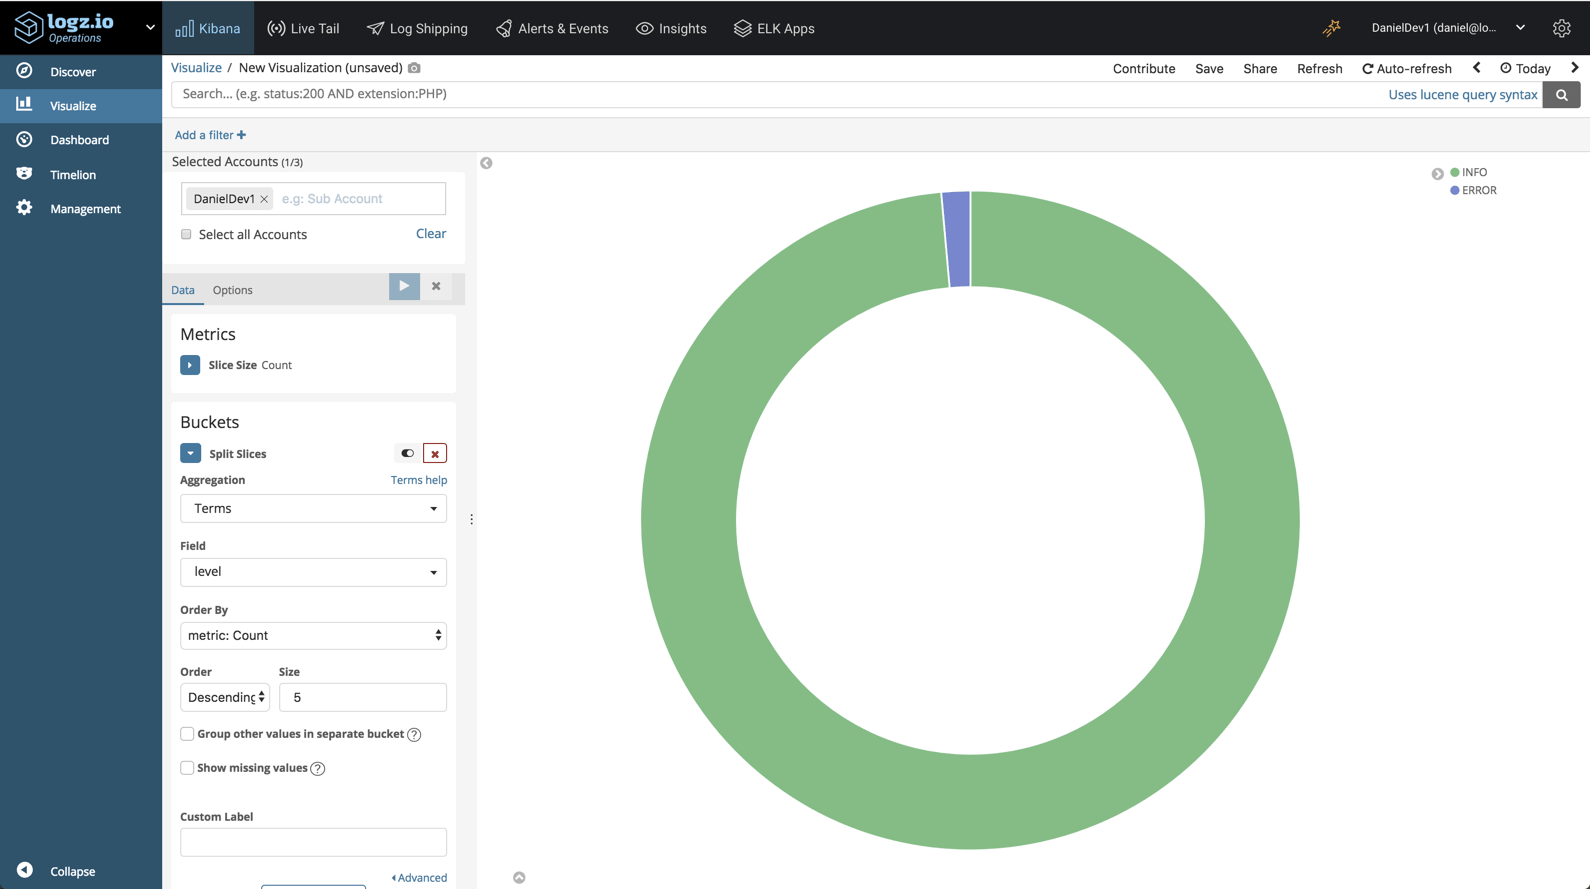
Or we could create a visualization giving us a breakdown of the different logs, by level:
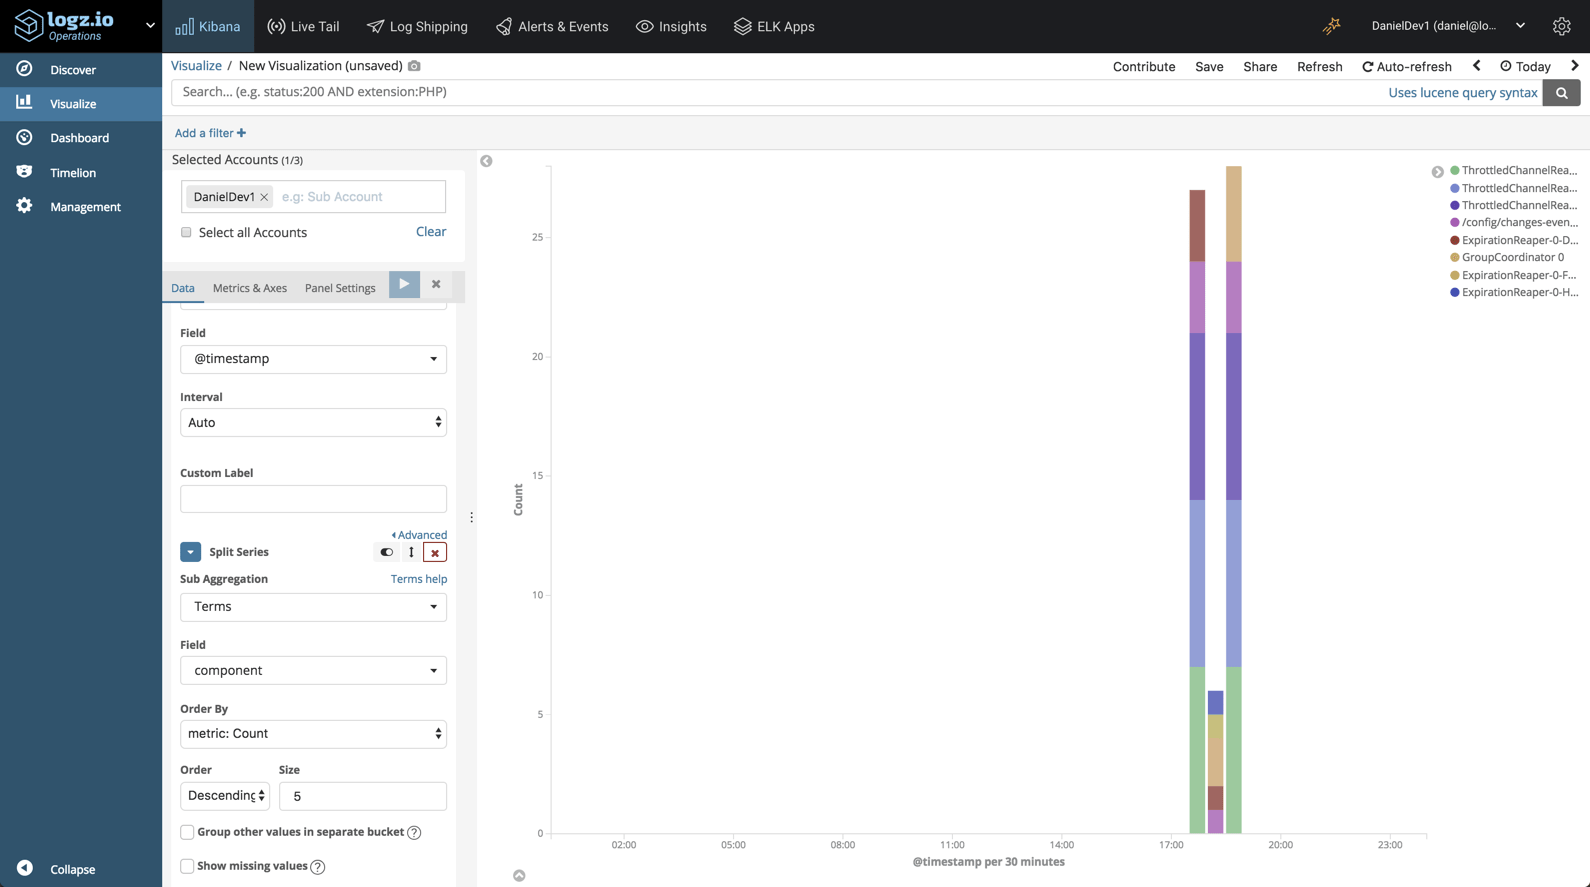
Likewise, we could create a visualization showing a breakdown of the more verbose Kafka components:
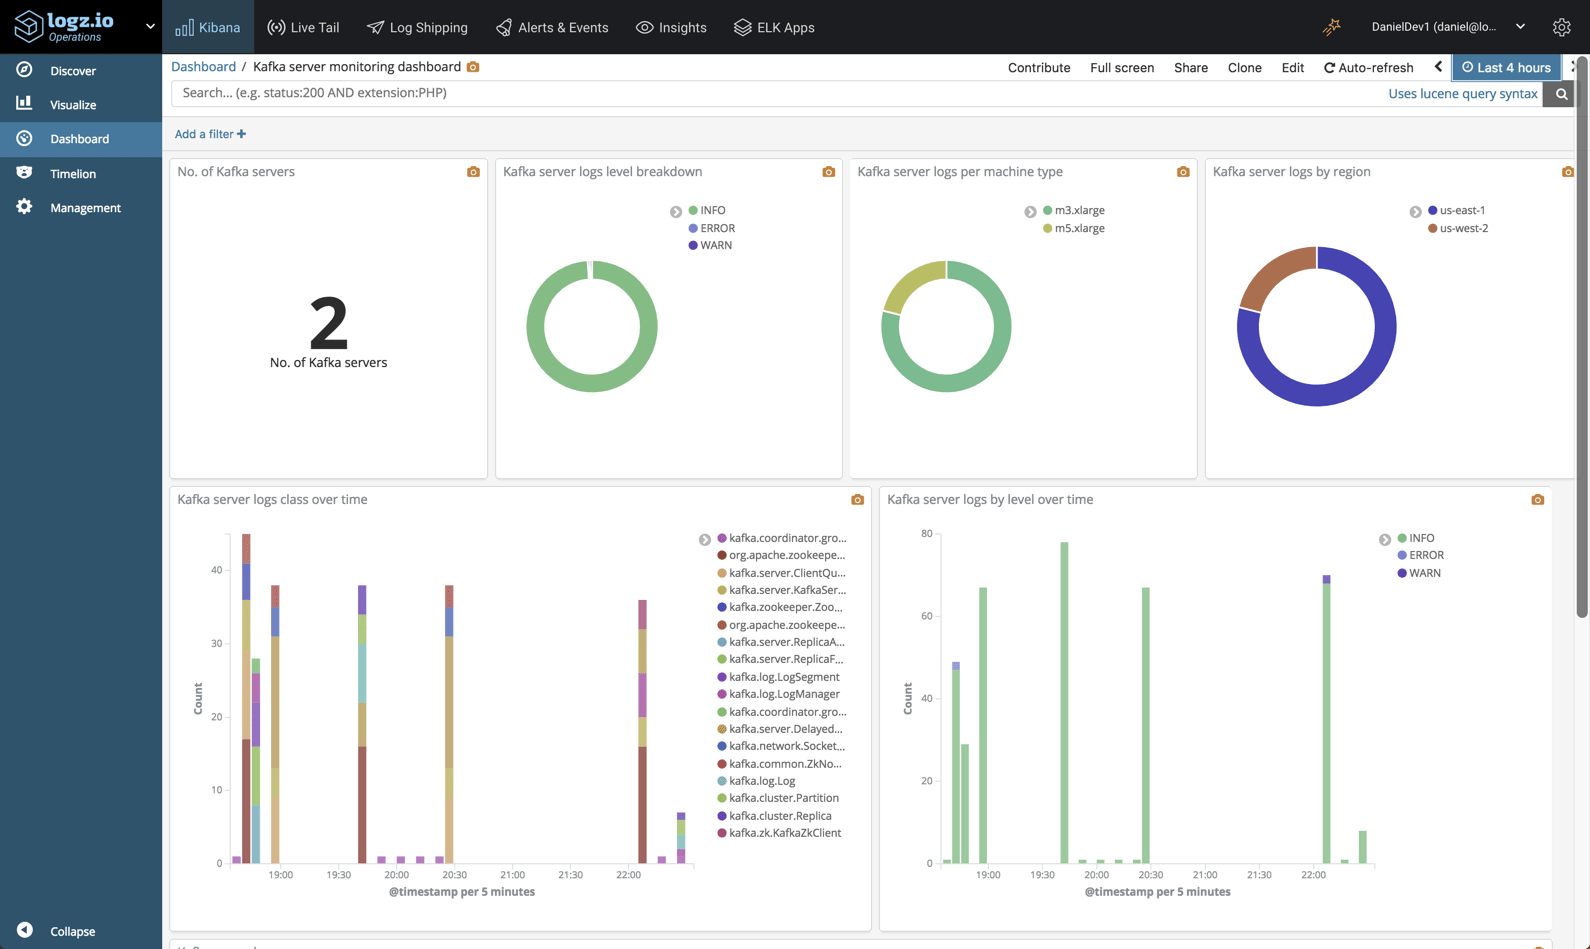
Eventually, you’d put these visualizations, and others, into one dashboard for monitoring your Kafka instances:
Getting some help from AI
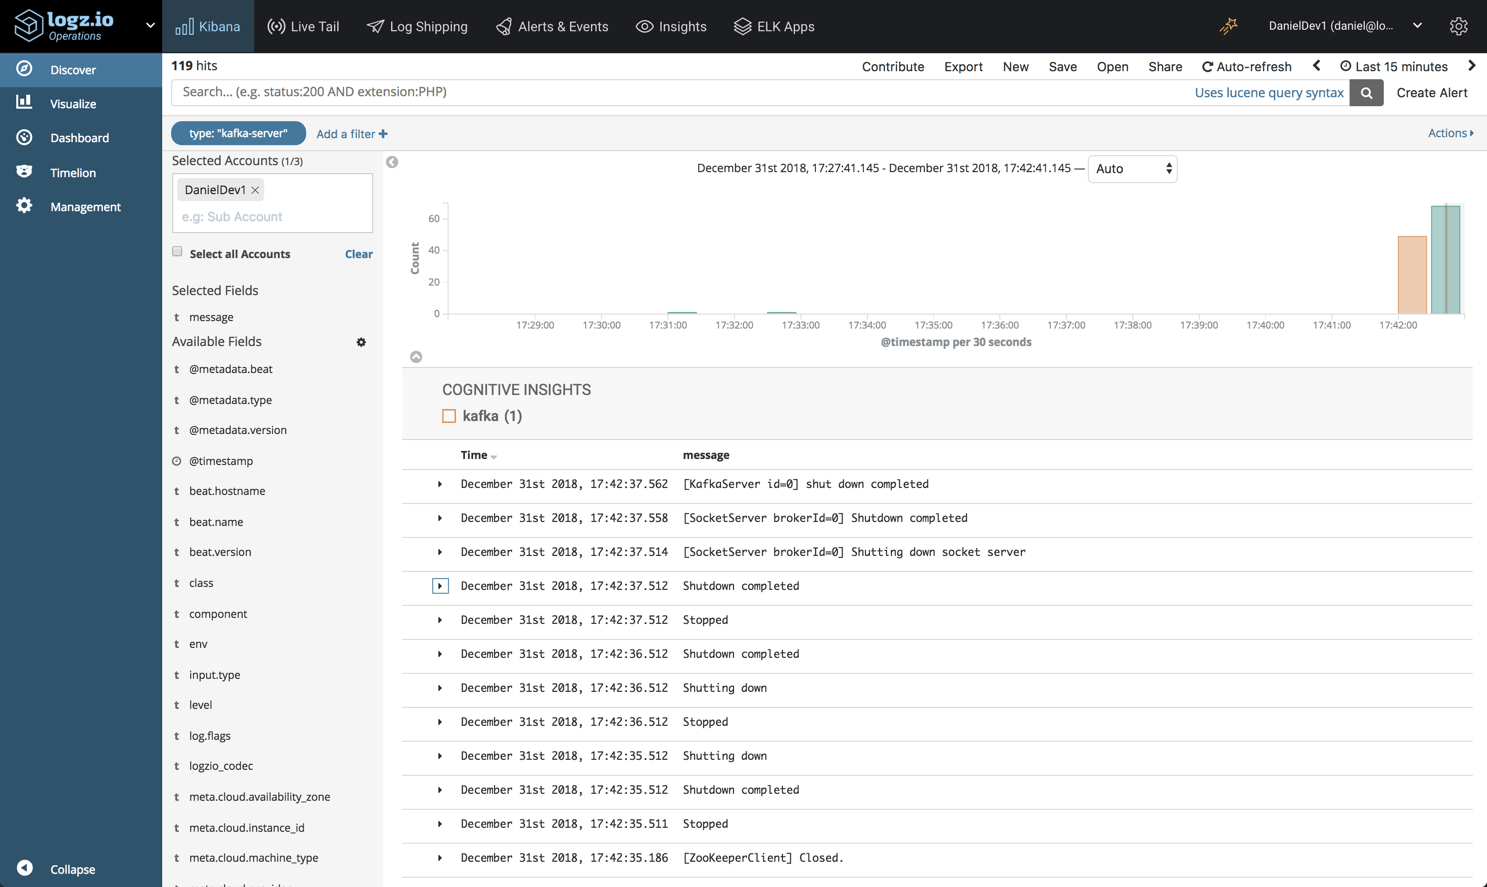
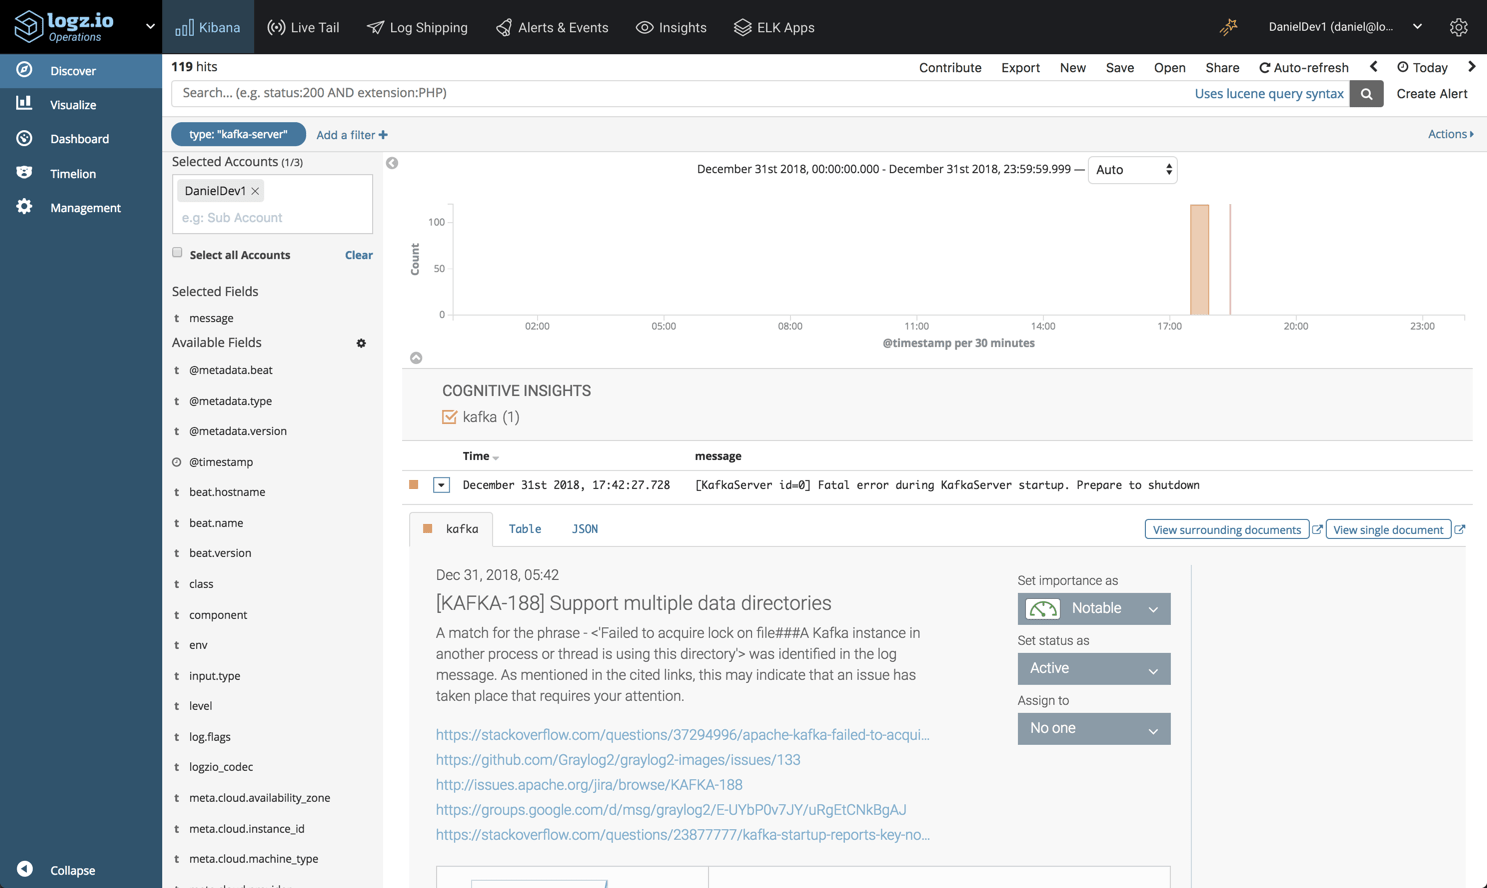
For the sake of demonstration I’ve only set up one Kafla server, but we can see the logs are already starting to pile up. Finding the needle in the haystack is one of the biggest challenges Kafka operators face, and for that reason, Logz.io’s Cognitive Insights can come in handy.
Cognitive Insights combines machine learning and crowdsourcing to correlate between log data and discussions in technical forums on the web. As a result of this correlation, critical events that may have gone unnoticed are flagged and marked for us in Kibana.
As seen in the example below, an error log was identified by Cognitive Insights, and opening it reveals some additional information on how to troubleshoot it, including links to the technical forums where it was discussed.
Endnotes
Just like any other component in your stack, Kafka should be logged and monitored. At Logz.io, we use a multi-tiered monitoring system that includes metrics and logs for making sure our data pipelines are functioning as expected.
As mentioned already, Kafka server logs are only one type of logs that Kafka generates, so you might want to explore shipping the other types into ELK for analysis. Either way, ELK is a powerful analysis tool to have on your side in times of trouble.
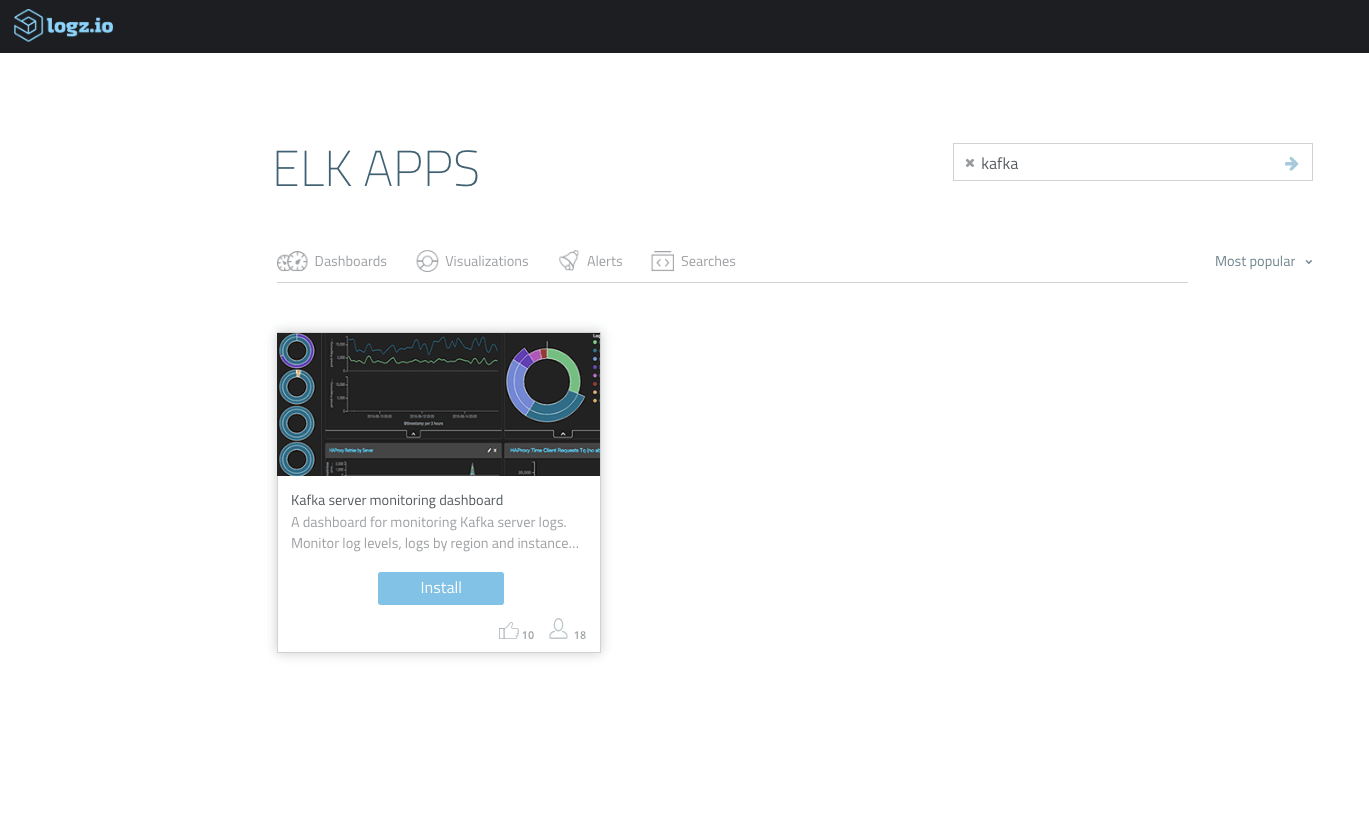
The dashboard above is available for use in ELK Apps — Logz.io’s library of dashboards and visualizations. To deploy it, simply open ELK Apps and search for “Kafka”.

You Might Also Like

What’s New at Logz.io – January 2026

