
Monitoring Kafka in Production
September 17, 2018

Franz Kafka was a German-speaking Bohemian Jewish novelist and short story writer, widely regarded as one of the major figures of 20th-century literature. Apache Kafka, on the other hand, is an open-source stream-processing software platform. Due to its widespread integration into enterprise-level infrastructures, monitoring Kafka performance at scale has become an increasingly important issue. Here at Logz.io, we utilize Apache Kafka as part of our core product, and would like to share some of our insights about monitoring its state and performance with a collection of open-source tools.
Apache Kafka is a great system that perfectly fits our needs for high-throughput ingestion and delivery assurances of log messages, and due to the critical role it plays in our architecture, gaining visibility into its operations and performance is crucial.
However, the telemetry data provided by Kafka can be both massive in quantity and somewhat obfuscated and not easily accessible, especially in large production clusters. As a result, gaining visibility is challenging. To overcome these challenges we’ve devised a monitoring system for collecting, aggregating, visualizing and alerting for both logs and metrics.
At Logz.io, we use Apache Kafka as our main bus for log messages.
Workload
Just to give you a rough picture of our environment, here is some information on our Kafka deployment and the workload it handles:
- Dozens of billions messages/day (per cluster)
- Dozens of brokers (per cluster)
- Thousands of partitions (primary)
- Multiple production clusters per region
- Multi-region
- No cross-region replication
Aggregating Kafka logs
The first element in our Kafka monitoring system is log data.
Being strong believers in “eating our own dog food”, we collect all our own logs, some through direct appenders, and in other cases using Filebeat.
The most important log file is the server.log file, where the errors and information about partitions, leadership, and other interesting information can be found.
We have found it extremely important to ship metadata along with the log messages for better context when visualizing and alerting, and so we add the following fields to each log message:
- Environment
- Cluster ID
- Broker Instance (id, ip)
Multiline messages are handled at the source by Filebeat, and parsing is handled by the Logz.io service. Most importantly, we parse out the metadata fields, as well as LogLevel and Java Class.
Collecting Kafka metrics
Next up, metrics!
Apache Kafka exposes a multitude of metrics using JMX. These metrics are invaluable to understanding your cluster performance and capacity. We collect JMX metrics as well as host metrics using the following tools:
- Jolokia agent – the Jolokia agent is loaded with Kafka, and exposes all the broker jmx metrics using a REST API.
- Logz.io jmx2graphite – Our open-sourced utility collects the metrics exposed by Jolokia, and ships them to Graphite.
- collectd(2graphite) – this utility collects the host metrics, and ships them to Graphite.
For aggregation and analysis, we use Grafana and Graphite. As with the logs, metadata is paramount. We build the metrics prefix that we ship to Graphite to include:
- Region/AZ
- Cluster ID
- Broker ID
Monitoring Kafka lag and latency
Of course, there are some businesses, or applicative, metrics that we cannot neglect when gauging Kafka performance. We generally need to know what kinds of delays exist in our ingestion pipe. This is more commonly referred to as “lag”.
We measure Kafka lag in two ways. More on the subject:
Firstly, we can measure the difference in consumer offset from the head of each partition of each topic. This lag gives us an idea on how many messages (logs) have been ingested by our listeners but have not yet been processed by our consumers. It is useful for identifying trends and potentially finding problems in the pipeline.
This, however, is not a direct indicator of an issue, as that would also require knowledge of the consumption rate. For that purpose, we use Zipkin to measure the actual time latency between ingestion and consumption, which is a much more accurate and a direct metric for gauging user experience.
Grafana Templates
Using Grafana’s template feature, we are able to parametrize the view based on the metadata sections of the prefix. This greatly reduces the number of dashboards to maintain, and allows for better drill-down investigation in case of issues.

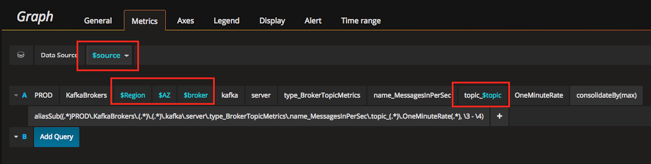
As a side note, it’s worth pointing out that Logz.io also supports adding Logz.io as a data source for analyzing metrics in Grafana.
Visualizing Kafka data
The way you visualize your data can have a significant impact on the understanding of the underlying data. When necessary, and especially when things go wrong, you want to be able to get the right visual queues that will lead you more quickly and accurately to the source of things.
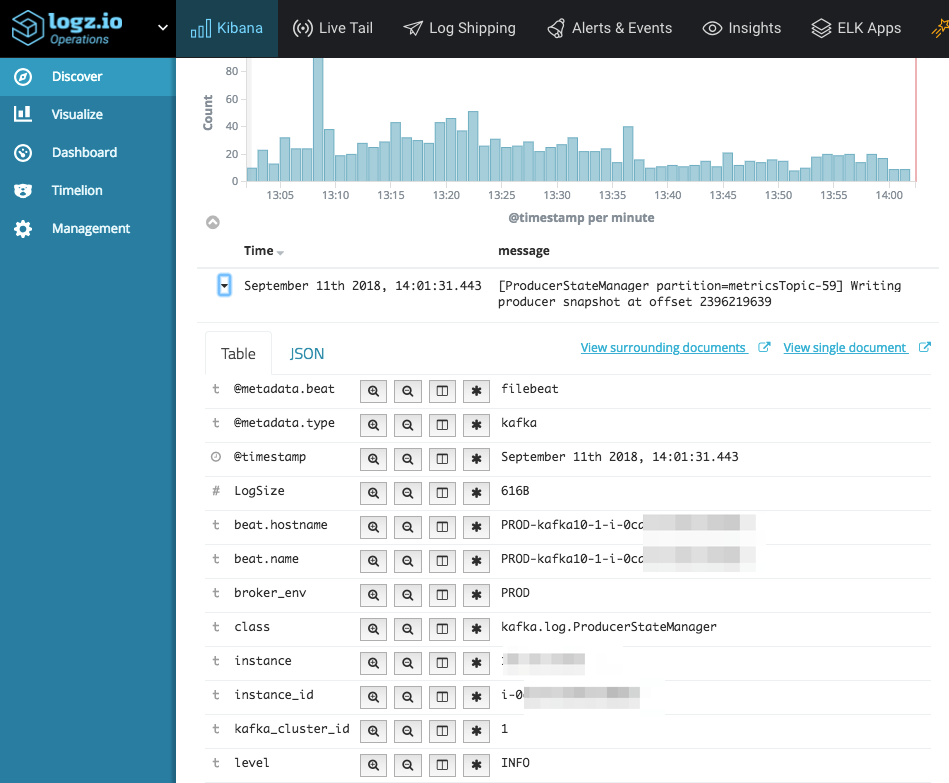
Here is an example of Kafka logs being collected by Logz.io and displayed on Kibana’s Discover page:
In this respect, it is good to take note that the same data can be visualized in different ways, each highlighting something else.
For example, take a look at the following two visualizations visualizing data series of incoming bytes/sec on a per-topic basis:
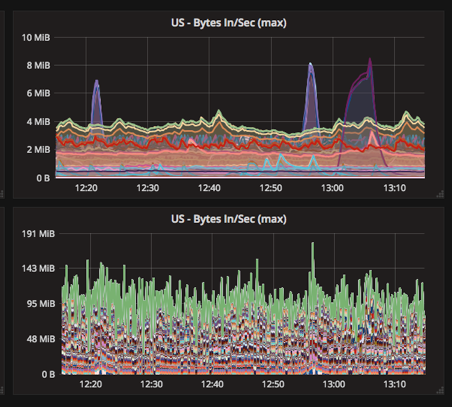
The two visualizations show the same data series, but one is configured to show the series as overlapping, while the other is set to stack. The first is better for discerning spikes in certain topics, while the second more clearly shows the overall impact across all topics.
More so, we found that given the large number of data series for any vector (host, topic, cluster, etc.), there are visual gains to be made by duplicating some of the visualizations, but filtering out only the “Top 10” in each, and these data series, can also be shown in various ways.
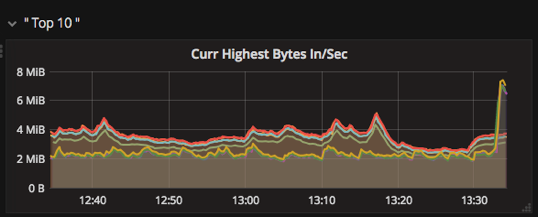
Using the highestCurrent function, the series to display here are selected because they have the highest bytes/sec currently.
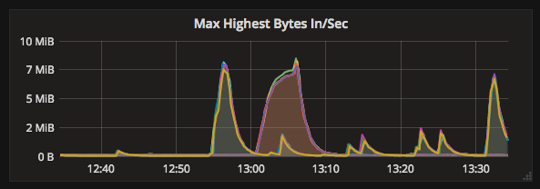
Using the highestMax function the data series shown are those that peaked highest in the view window.
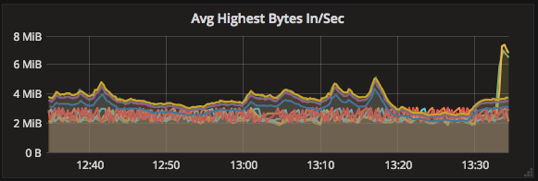
Using the highest Average function we can get a filter for the series that were highest on average over the view window.
All three of the visualizations above share the same data series, but each brings to attention different aspects. We have found it extremely useful to have all three displayed on the main dashboard, saving us valuable time when investigating incidents.
Key Kafka metrics to monitor
From our perspective, we have found the following topics to be most helpful in monitoring Kafka:
- Messages in/out
- Network handler idle time
- Request handler idle time
- Under-Replicated partitions
- Leader Elections
- CPU idle time
- Host Network in/out
For reference, this is what we whitelist in Graphite so that we don’t swamp it:
kafka.server.type_ReplicaManager
kafka.server.type_KafkaRequestHandlerPool.name_RequestHandlerAvgIdlePercent
kafka.server.type_DelayedOperationPurgatory
kafka.server.type_BrokerTopicMetrics
kafka.network.type_RequestMetrics
kafka.network.type_Processor.name_IdlePercent
kafka.controller.type_KafkaController.name_ActiveControllerCount
kafka.controller.type_ControllerStats.name_UncleanLeaderElectionsPerSec
kafka.controller.type_ControllerStats.name_LeaderElectionRateAndTimeMs
java.lang.type_Memory.HeapMemoryUsage
java.lang.type_GarbageCollector
cpu.percent.idle
disk.xvd[cde].disk_io_time.io_time
load.load.shortterm
interface.eth0.if_octets
Summing it up
Kafka plays a crucial part in our architecture and has proven to be both stable and dependable. However, this is not without work and additional safeguards. Capacity has to be well planned and an elaborate monitoring system must be out in place.
To end this piece, here are some final recommendations for those of you who wish to implement Kafka as a high volume message broker:
- Use both logs and metrics aggregation and analysis for visualization and alert definitions
- Utilize metadata with your logs and metrics, so that drilling down and visualizing is easiest, most accurate and quick
- Do not overload the monitoring infrastructure or humans trying to make sense of it all
Enjoy!

You Might Also Like

Tool Consolidation Is Dead. Long Live Agentic AI.

