Unleashing a Better Open Source: Introducing Logz.io Cloud Observability Platform
December 3, 2019

Today, I am proud to announce the release of Logz.io Infrastructure Monitoring, a monitoring solution that enables engineers to speed up detection and reduce time to resolution. This new offering extends our Log Management and Cloud Security (Cloud SIEM) products, which together form Logz.io’s new Cloud Observability Platform.

Based on the ELK Stack and and popular open source tools, the platform enables engineers to easily use the open source observability tools they know and love for monitoring, troubleshooting and securing their distributed cloud workloads.
It’s clear that in today’s day and age, software engineers are responsible for a whole lot more than simply developing their code. In most modern engineering teams, they are also responsible for making sure their code is performant, up and running at all times, and secure. It’s known that the three pillars of observability are logs, metrics and traces. But we actually like to look at it through the lens of the developers. The three pillars of modern dev teams are monitoring, troubleshooting and security.

The three pillars of modern dev teams have evolved and matured with the adoption of the cloud and the DevOps discipline, driving developers to find solutions to a new set of challenges.
Developers are creators, they want to be free to create in their own way without being told what they can or cannot do. Not surprisingly then, most developers opt for open source solutions — ELK, Graphite, Prometheus, Grafana, Jaeger, Zipkin, and the list goes on.
But while developers prefer to tackle their growing responsibilities with open source tools, these tools are not without their challenges.
As software engineers ourselves, we had first-hand experience with the difficulties of managing and maintaining complex, big-data open-source tools that were necessary for running production workloads. That’s why we started Logz.io five years ago with the mission of enabling developers like us to use the best open source tools to support their growing responsibilities without worrying about scale or ongoing management. Our mission is further refined with today’s launch of Logz.io’s open-source-based, cloud observability platform. This launch is the fruit of years of investment, hundreds of customers’ feedback and remarkable innovation from our engineering team.
How did the platform evolve?
We started with Logz.io Log Management, a log analysis platform based on open source ELK that was fully scalable, intelligent, and complete with must-have features such as alerts, live tail, sub-account, machine learning insights, and more.
More on the subject:
As our customers began using our log management solution for security as well as operations, they found that the current security tools on the market were heavy, siloed, and were not a fit with the cloud, Kubernetes, or DevOps workflows. So about a year ago, we launched Logz.io Cloud SIEM to give our customers simple, DevOps-native threat detection and analytics built on the ELK Stack, enabling them to reduce threat detection times and improve their team’s security and compliance posture.
But in addition to log data, we knew our customers were working with metrics and traces and slowly but surely, they raised their voice asking for longer retention for Metrics and a better user experience. The open source tools they were using to analyze this data were difficult to scale and maintain, and at the same time, did not easily correlate with one another, inhibiting their engineers from getting the full picture of their production systems.
We internally experienced issues similar to our customers. In the early days at Logz.io, we used Graphite to analyze metrics. Our engineers were pleased by the flexibility of this open source tool, its easy-to-use Grafana integration, and the freedom to build on open source. But scaling it was a big challenge. It required ongoing investments to configure, run, and manage and in addition, each Graphite deployment functioned as a point solution, remaining siloed and not correlating their analyses for broader visibility.
So, as our needs and the needs of our customers grew, we knew it was time for our platform to grow as well. We set out on a journey to further extend our observability platform to include metrics.
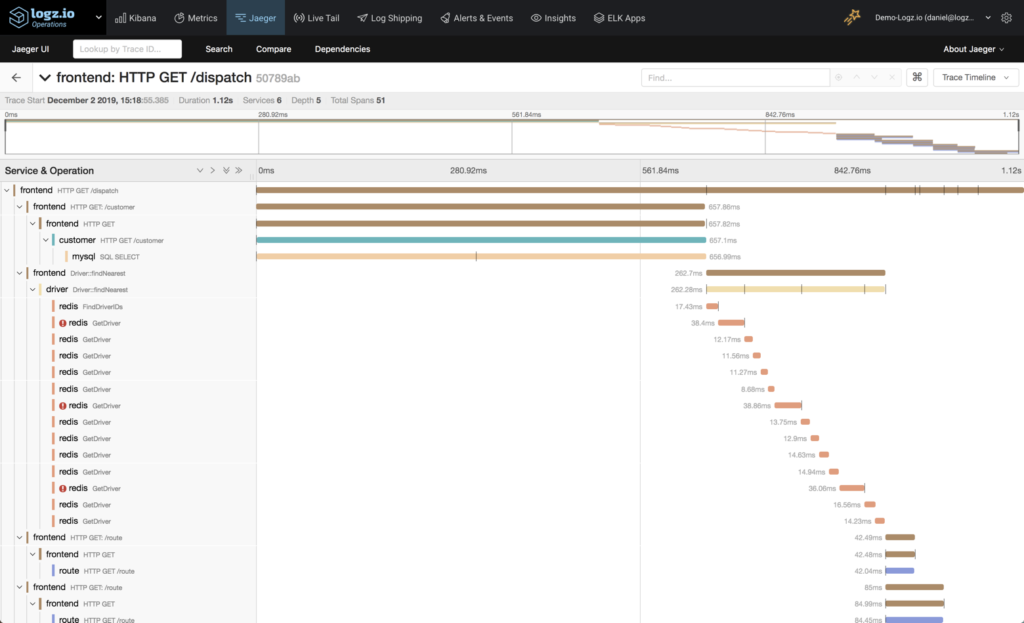
But we’re not stopping there. Our product and engineering team is already hard at work to expand our observability platform to include Jaeger. For those who don’t know, Jaeger is considered, the world’s most popular open source tracing tool. I know many of our customers are waiting to get their hands on it, but this will take some more time. You’re welcome to join the waitlist for the beta in the meantime.
The world today is built on software and the open source community is the backbone of this movement. We are proud to empower the creators of this generation and enable them to build great technology, drive innovation, and do so in the most agile and productive way possible. We are proud to work with some of the world’s biggest companies and be their partner in developing amazing products. And we’re proud to enable engineers to harness the power of open source and help them continue creating great software that moves the world forward.

You Might Also Like

Searching and Filtering