
How We Monitor Elasticsearch with Graphite & Grafana
September 8, 2016
“How do you monitor Elasticsearch at this scale?” is a question we are asked again and again by ELK Stack users and our customers. Recognizing the challenge, we wanted to share some of our monitoring engineerings with everyone!
A Short History Lesson
When Elastic released Elasticsearch 2.0, the company released Marvel 2.0 as well. This was a most-welcome move because the community finally got the option to monitor Elasticsearch clusters in production — an option which was previously unavailable by license.
The problem with Marvel 2.0 is that a large number of metrics were removed, with the most useful metrics available only in the Elasticsearch API. For us, this meant Marvel suddenly became obsolete and of little use as we required deeper visibility into our clusters.
Our Monitoring Solution
As an initial replacement, we first used our “es-health” Docker image to monitor our Elasticsearch clusters. This served us well to a certain degree, but we still felt like it was not enough for real-time, complex analysis.
We were already using Graphite to retrieve real-time metrics from all of our microservices (using this Docker image / Java Agent), so we decided to try to analyze our Elasticsearch clusters with Graphite as well.
The successful result of this engineering effort was a lightweight Docker image that serves the purpose of monitoring Elasticsearch perfectly.
How does it work? It’s pretty simple. Once at every set interval, a request is made to the /_node/stats API on an Elasticsearch cluster of your choice. We recurse on those values and use the “pickle” protocol to send any numeric metric found to Graphite. Once the metrics are in Graphite, it’s only a matter of playing around Grafana to produce a rich monitoring dashboard to monitor the Elasticsearch cluster.
The Docker image is available here on the Docker Hub.
To complement this Docker image, we are also collecting metrics from each node with this Docker image. Combined, these two metric collectors provide all of the data we need (and more!) to understand everything that is going on behind the scenes and within our clusters.
Of course — and as is often the case with monitoring — the real problem with metrics is not how to retrieve them but what to do with them once everything is in place.
Monitoring Tips and Tricks
I could go through all the metrics our Docker image produces, but that would be a waste of time. Instead, I would like to give some recommendations based on our experience.
First and foremost: Most people open monitoring dashboards only when things go south, but you must be able to understand how your dashboard behaves when everything is working as expected. Make sure that you know the readings of your metrics when everything is going well so that you will have a comparison for whenever you will actually need it. Answering questions such as “Is this always like that?” forces you to waste time on false positives instead of actually finding the issue.
Another thing that is probably obvious, but I want to mention it anyway: Search for anomalies. There are a lot of metrics in Elasticsearch, and you are probably not familiar with all of them — and not even with most of them. But that doesn’t mean that they don’t count.
Visibility is the name of the game here. If you suddenly see some irregularity in your metrics, try to search for the ones that first started to act weird. Elasticsearch malfunctions will often be reflected in many metrics — and you need to find out where the issue started. When you have a general sense of the origin, search online to find information on what to do next.
Something that you absolutely need to keep in mind is that many different companies use Elasticsearch for many different things.
Each Elasticsearch use case has a set of different best practices and different monitoring caveats. That is the main reason that I don’t want to elaborate on the different metrics — what is right for us can be totally wrong for you. The bottom line: Don’t jump ahead and do everything that the Internet says about configuring Elasticsearch or what specific metrics to follow. Develop your own method.
More on the subject:
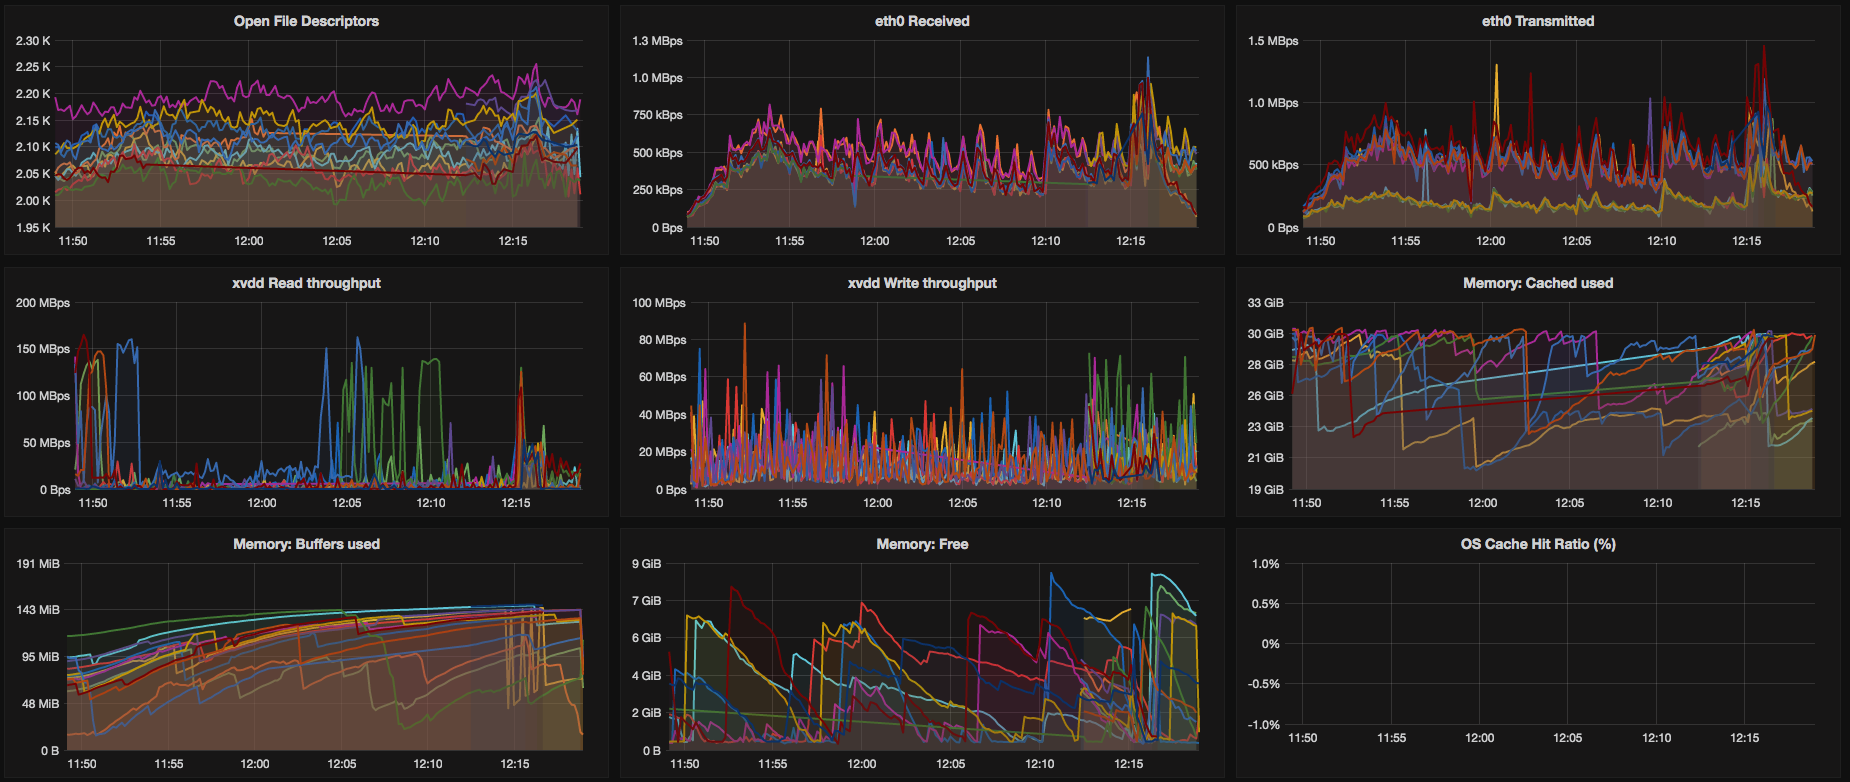
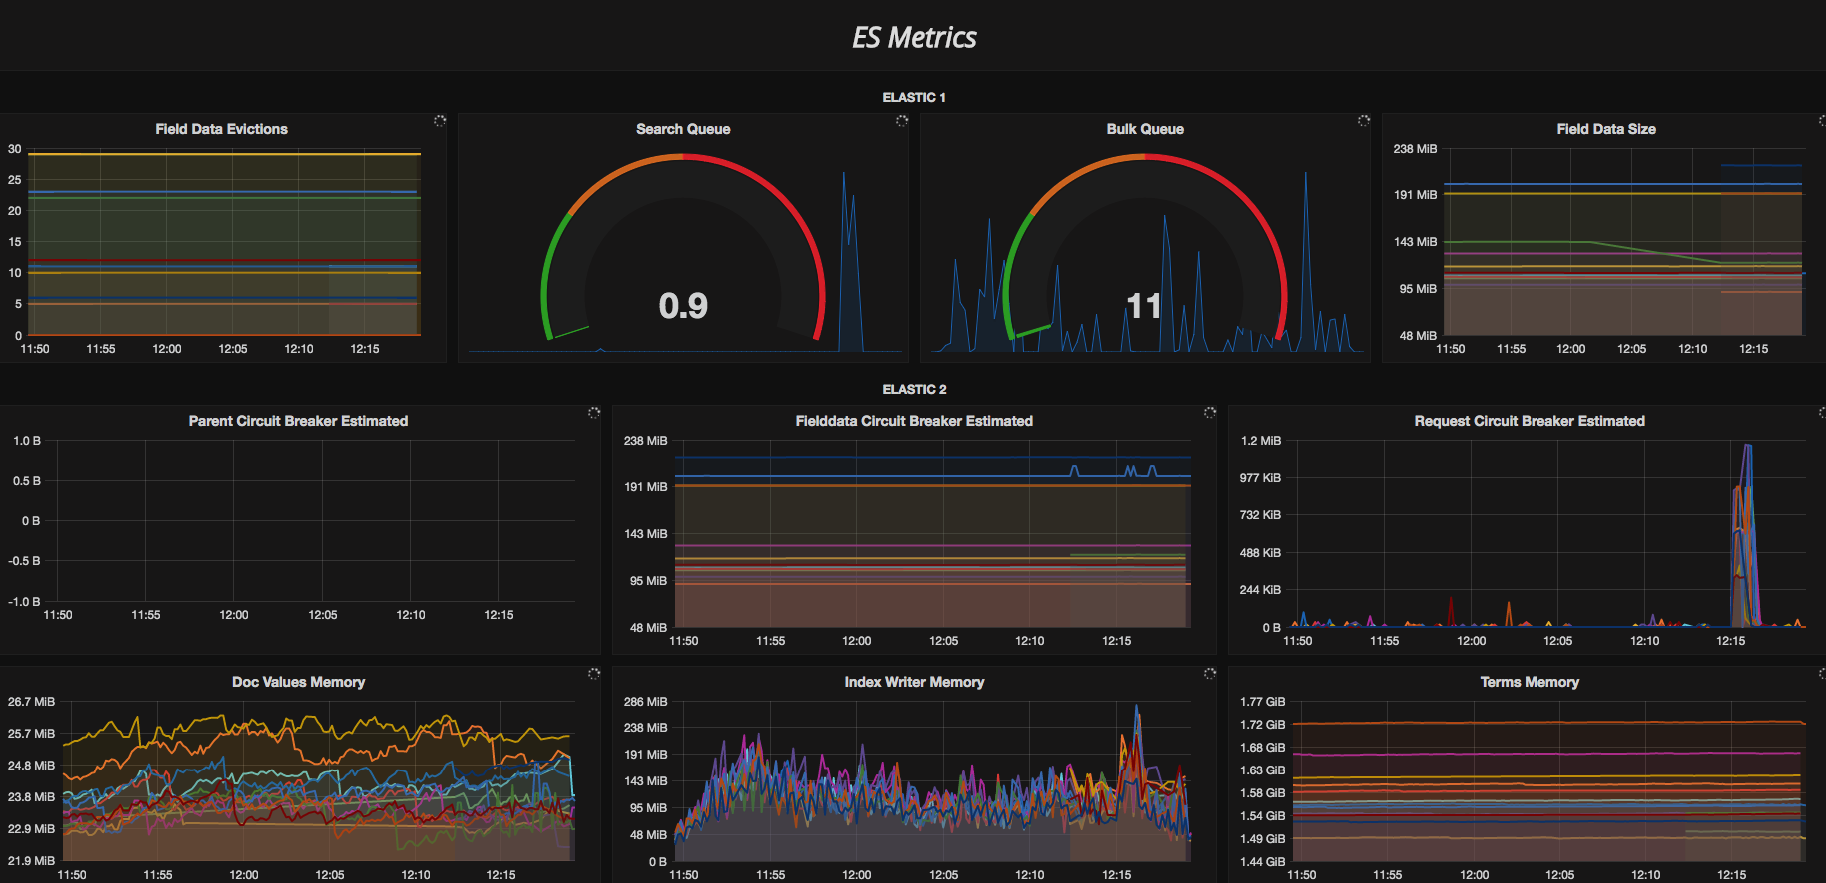
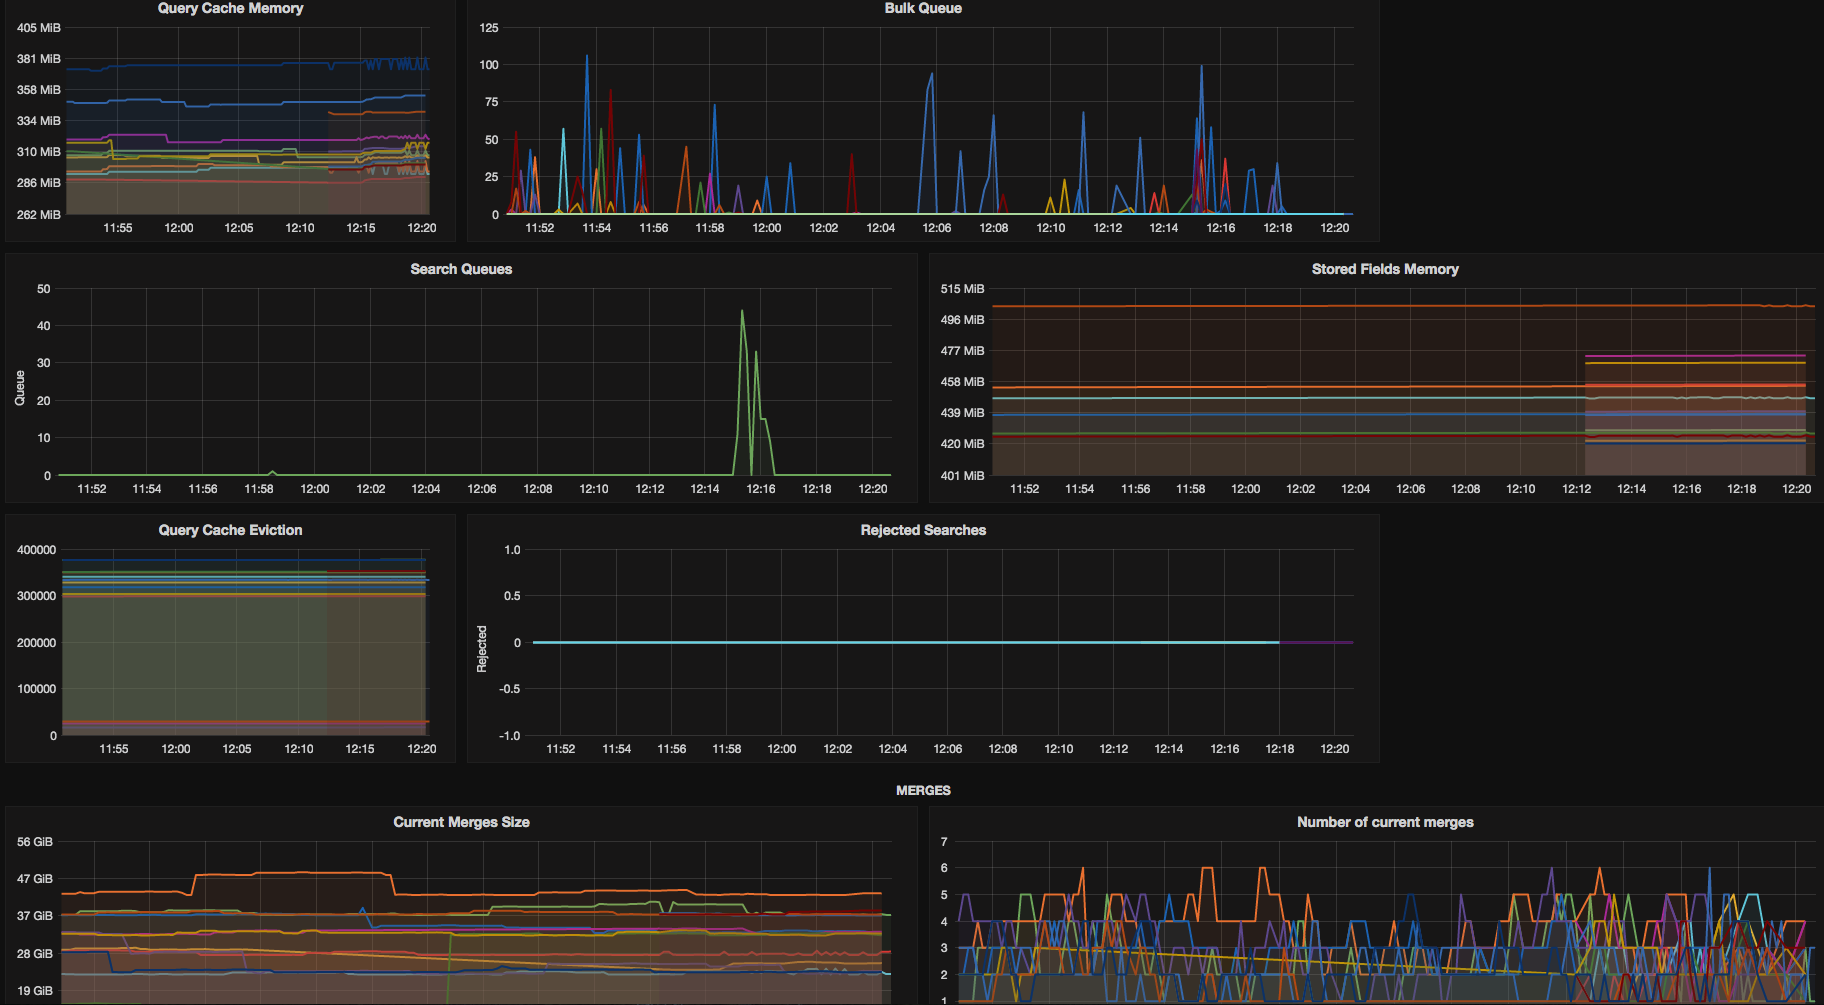
Finally, no monitoring post can be complete without at least some DevOps porn.
Here are some screenshots of our Grafana dashboard that is based on our es2graphite container and collectd2graphite container mentioned above. Enjoy!


You Might Also Like

What’s New in Logz.io – September 2019

