
Modern Observability 101
August 26, 2025

In technology, having “modern” capabilities is standard. Staying ahead of the curve is critical, and keeping outdated technology or processes going can be a recipe for disaster in a complex, ever-changing landscape.
Ensuring the smooth functioning and performance of software systems is paramount. This is where modern observability—a sophisticated approach to monitoring and understanding the inner workings of applications and infrastructure—is required.
Let’s delve into the core components, implementation strategies, challenges, and future trends of modern observability, exploring its pivotal role in cloud-native and microservices architectures.
What Is Modern Observability?
Modern observability is the practices and tools related to understanding, monitoring and troubleshooting complex and dynamic systems, and especially cloud-native environments. Modern observability tools provide deep visibility into systems and surface meaningful insights in real-time, allowing DevOps and engineers to quickly pinpoint the root cause of issues, without the alert fatigue.
Modern observability is achieved by correlating and analysing the three pillars of observability: logs, metrics and traces. In addition, some modern observability systems enhance this telemetry data with contextual data and AI analysis, enabling deeper insights and even faster resolution.
Modern observability emerged as an answer to complex architectures – microservices, serverless, containers. cloud environments, etc. It goes beyond traditional monitoring, which focuses on how systems behave, and attempts to answer the “why”.
Core Components of Modern Observability
At its core, observability revolves around three key pillars: logging, metrics, and tracing. But observability systems need to take more than just those pillars into account, and there have been growing trends to capture more than just standard telemetry data.
Logging captures detailed event data, providing a chronological record of system activity. Metrics offer aggregated numerical data, enabling performance analysis and trend identification. Tracing provides end-to-end visibility into transaction flows across distributed systems, allowing for precise diagnosis of performance issues and bottlenecks.
But observability for modern applications required more. Logz.io’s Principal Developer Advocate Dotan Horovits spoke at Container Days about this topic in his talk “Beyond Logs, Metrics and Traces: The Data Analytics Paradigm Shift in Observability.”
There, he goes into depth about how observability must be about collecting data from different sources, formats and types; structured and standardized data; enriching and correlating data; unified query and visualization; and data volume and data-to-noise ratio.
Limiting ourselves to collecting data from the “three pillars” alone isn’t necessary. Events and profiling are among the data types that can be considered as an expansion of traditional observability. OpenTelemetry, for its part, has added a data model for continuous profiling to help lead on this trend.
Observability involves ingesting data signals from multiple sources across different tiers, frameworks and programming languages. Consistently collecting heterogeneous data across all these places has been a serious challenge for many years. Each source has its own way of exposing, collecting and relaying telemetry data. But the biggest pain about this is putting it all together. We’ll discuss challenges of modern observability systems later on.
How to Go About Implementing Modern Observability
Implementing modern observability involves deploying specialized tools and platforms that support comprehensive data collection, analysis, and visualization.
One way to implement modern observability is through leveraging open source technology. OpenSearch has become the de facto standard for open source log management after Elastic re-licensed Elasticsearch and Kibana from the Apache2.0 open source license to the non-open source dual-license SSPL, back in January 2021. This led to the forking of their offering and the creation of OpenSearch.
Organizations can also implement open source tools for infrastructure monitoring through Prometheus and distributed tracing through Jaeger. By themselves, these tools provide a view into your critical systems, and they’re essential for achieving holistic observability across complex environments.
However, these tools don’t necessarily talk to each other particularly well, and operating with siloed open source tools alone isn’t enough to achieve modern observability. An overarching solution that unifies these disparate tools and allows users to analyze, drill down and troubleshoot is critical. 👀 Logz.io Open 360™ Observability Platform 👀
The Role of Open Source and Open Standards
Open source projects and open standards play a crucial role in driving innovation and collaboration within the observability space. We discussed above that open source software can be a great place to start in the process of implementing modern observability.
But frameworks and open standards have to be a significant consideration for any organization that wants a strong observability practice.
By fostering community-driven development and adoption, initiatives like OpenTelemetry and other CNCF projects accelerate the evolution of observability tools and ensure vendor-neutral interoperability across diverse ecosystems.
OpenTelemetry (informally called OTEL or OTel) is an observability framework that assists in generating and capturing telemetry data from cloud-native software. OTEL aims to address the full range of observability signals across traces, metrics and logs. In fact, OTEL is now expanding to support Continuous Profiling as a fourth signal.
The OTEL observability architecture offers several components, most notably:
- APIs and SDKs per programming language for generating and emitting telemetry
- Collector component to receive, process and export telemetry data
- OTLP protocol for transmitting telemetry data
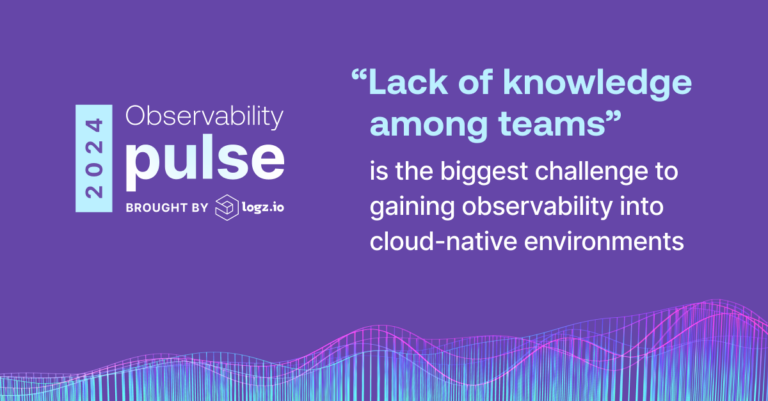
OTEL standards and protocols are consistently maintained and updated by the working groups in charge of them, and will provide a strong foundation for your modern observability practice. As of 2025, nearly half of organizations claim to use OTEL.
Observability Strategies for Cloud and Microservices Architectures
The shift towards cloud-native and microservices architectures has transformed the observability landscape. Traditional monolithic applications have been replaced by dynamic, decentralized systems, posing new challenges for monitoring and troubleshooting.
Modern observability tools need to be tailored to address these challenges, offering granular insights into containerized workloads, service meshes, and serverless environments.
Kubernetes has become so critical to cloud computing and application development for organizations, but the practice adds layers of abstraction in crucial systems. It can’t be overstated how complex this can make monitoring, observing and troubleshooting these systems.
We hear from customers that Kubernetes itself produces too many default metrics, which deepens complexity and makes it more difficult to understand the full picture. The ephemeral nature of pods creates additional cardinality, and the lack of visibility into correlation between Kubernetes objects and underlying applications causes issues.
Managed solutions for Kubernetes observability have value in determining what data is important and what isn’t. In a modern observability system, you have to determine if you are receiving all the information you need, what data you’re paying for, and if your data will be capped. Getting a handle on all this can help you achieve modern observability.
Modern Observability Use Cases
The modern observability approach especially shines for:
- Performance Monitoring & Optimization – Tracking application and infrastructure performance metrics in real time to detect bottlenecks, latency, or degraded user experiences.
- Incident Detection & Root Cause Analysis – Identifying and investigating the root cause of outages, slowdowns, or anomalies.
- Cloud & Microservices Visibility – Monitoring containers, Kubernetes clusters, and serverless functions to ensure performance, scalability, and reliability.
- Resource Optimization – Gaining visibility into resource utilization (CPU, memory, storage, network) across environments to reduce waste and control costs.
- Release & Deployment Validation – Observing behavior pre- and post-deployment to ensure new releases don’t introduce performance regressions or break dependencies.
- SLA/SLO Monitoring & Reporting – Tracking service-level indicators and objectives to maintain contractual or internal reliability goals.
- Security & Threat Detection – Correlating telemetry data with security signals to uncover unusual behavior or malicious activity by.
- Business Impact Analysis – Tying system performance to business metrics (like revenue, customer satisfaction, or conversion rates) to prioritize efforts.
- Compliance & Audit Readiness – Maintaining historical observability data for audits to prove adherence to regulatory or internal standards.
- User Experience Monitoring – Analyzing frontend telemetry, like page load times and errors, to understand how real users experience the application.
The Rise of AI in Modern Observability
Artificial intelligence (AI) and machine learning (ML) are increasingly being integrated into observability platforms, enabling predictive analytics, anomaly detection, and automated remediation.
When discussing AI in observability, there needs to be a distinction drawn with what we mean. First, there is proprietary AI built into systems by organizations that can help customers utilize and understand their technology better. That has existed for years. But more crucially, the discussion of introducing generative AI and large language models (LLMs) into observability platforms is a new, game-changing development for observability.
How can generative AI and LLMs help observability practitioners reach their goals? Organizations can gain the ability to leverage a vast base of knowledge and context to accelerate and better inform investigations. It’s ideal to combine a platform’s existing analytics capabilities with the inclusion of generative AI. You’ll get features with related insights and proven solutions to availability, performance, resilience and security issues and generative AI integration is a key supporting component of all other AI capabilities.
By analyzing vast amounts of telemetry data in real-time, AI-powered observability solutions can proactively identify and mitigate performance issues, enhancing system reliability and resilience.
Looking ahead, the future of observability is poised for continued innovation and evolution. Advancements in edge computing, IoT, and hybrid cloud environments will drive the need for adaptive, context-aware observability solutions. Additionally, the emergence of quantum computing and distributed ledger technologies will present new challenges and opportunities for observability practitioners.
Challenges in Modern Observability
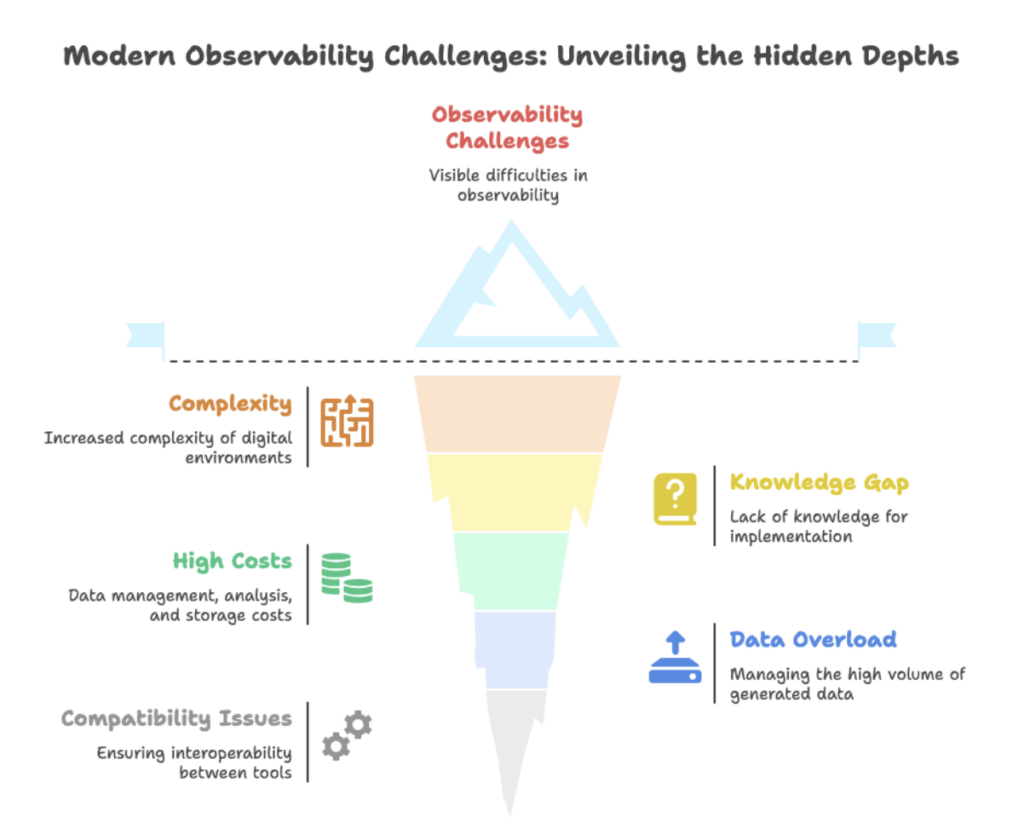
Despite its benefits, modern observability poses several challenges. Like any form of technology, the reason observability is needed in the first place is to make understanding and troubleshooting systems more simple. The increased complexity of digital environments, a lack of knowledge around how to implement and maintain observability systems, and the high cost of data management, analysis and storage can be detrimental to your efforts.
Data overload can be a significant hurdle in observability. Managing the sheer volume of data generated by distributed systems can be overwhelming, requiring efficient storage, processing, and analysis mechanisms.
That process can also be extremely costly if not managed properly. You’ll need an understanding of what’s important in your system and what isn’t—and to work with partners who will only charge you for shipping, analyzing and storing the data you need.
Additionally, ensuring compatibility and interoperability between diverse observability tools and frameworks can be daunting, necessitating careful planning and integration efforts.
The Strategic Value of Modern Observability
Modern observability is a cornerstone of effective practices for DevOps, SREs, solutions architects, software engineers and more, enabling organizations to achieve heightened visibility, reliability, and agility in their software delivery pipelines. By embracing the core principles of observability and leveraging innovative technologies, businesses can stay ahead of the curve in an ever-evolving digital landscape.
Modern Observability Platforms
Organizations should rely on trusted platforms to help provide the tooling necessary to reach your observability goals and grow a mature, modern practice.
Logz.io Open 360™ is a cloud-native observability platform that gives you the tools to monitor, troubleshoot and remediate issues that show up in your telemetry data — logs, metrics and traces — as well as forward-thinking ways to monitor your critical applications and infrastructure.
With Open 360, you’ll meet your modern observability goals with a platform that helps you:
- Explore logging, metrics and trace data quickly with intuitive, high-performance search filters so you can accelerate troubleshooting and reduce MTTR through visualizations of spikes, dips and other trends
- Get the most out of your open source tools and processes via a unified platform that correlates event data
- Automate querying and interaction with your platform through AI-powered, conversational terms to get to the bottom of issues fast
- Gain a full picture of your environment tailored to your specific needs and use cases via pre-built or customizable monitoring dashboards
- Filter out unneeded and irrelevant telemetry data so you can separate signal from noise and drastically reduce your data management, analysis and storage costs
- Track tens of thousands of metrics out-of-the-box and quickly gain infrastructure monitoring insights into ephemeral systems
- Acquire a better foothold of what’s happening in your systems with support for distributed tracing
- Surface and debug issues in microservices architectures fast, starting with an overview of application performance across surfaces
- Quickly drill into individual transactions to diagnose root cause issues
- Easily visualize the source of latency across applications requests and microservices architectures
- Combine Kubernetes logs, metrics, and traces for unified analysis, troubleshooting and gain automatic contextualization with relevant data organized by node or deployment
- Gain full visibility into application health and performance with an observability-based alternative to traditional APM, alongside automatic service discovery, instrumentation and collection for telemetry data
See how Logz.io Open 360 can help you reach your goals for modern observability, sign up for a free trial today.
FAQs
Why does observability matter to modern digital business?
Observability gives organizations the ability to understand the internal state of their systems so they can perform RCA faster, triage incidents and ensure product reliability. Without deep visibility, performance issues, outages, or security breaches can go undetected or unresolved for too long, leading to revenue loss and brand damage.
What is the difference between observability vs. monitoring?
Monitoring is about knowing something is wrong, while observability is about understanding why. Traditional monitoring uses predefined dashboards and alerts to track known metrics or thresholds (e.g., CPU usage, memory load). Observability, by contrast, enables engineers to explore and diagnose unknown issues by stitching together telemetry data across systems.
What to look for in observability tools?
The best observability tools provide unified visibility across logs, metrics, traces, and events. They should also offer powerful querying capabilities, intelligent correlation, real-time alerts, integrations with your tech stack, scalability and AI-driven analysis and recommendations.
How is AI transforming modern observability?
AI is reducing noise, speeding up detection, and automating analysis. This is done by surfacing insights, enabling natural language querying and providing mitigation guidance.

You Might Also Like
2024
Observability
Pulse Report
