
Windows Event Log Analysis with Winlogbeat & Logz.io
August 15, 2016

Windows event logs contain a wealth of information about Windows environments and are used for multiple purposes. System administrators and IT managers can use event logs to monitor network activity and application behavior. Event logs can be extremely valuable resources for security incident detection by InfoSec teams when they are ensuring compliance with regulatory requirements such as SOX, HIPAA, and PCI.
Although it is easy enough to configure and view the information logged on Windows systems, it is not as easy to search and analyze that information properly simply because of the large volume of data that is usually involved.
That’s where the ELK Stack can come in handy. It’s designed for Big Data ingestion and fast analysis of log messages. The ability to use Kibana visualizations and dashboards is a huge benefit and another reason that ELK has become the preferred weapon of choice when logging Windows.
This post will describe how to ship event logs into the Logz.io ELK Stack using Winlogbeat.
Winlogbeat is a member of Elastic’s Beats product line — a family of different log shippers, each meant for different purposes (see our posts on using Filebeat, Topbeat and Packetbeat) — and as its name implies, ships Windows event logs to the ELK Stack.
More on the subject:
Using Windows APIs, Winlogbeat tracks event logs such as application events, hardware events, security events, and system events), filters the events according to user instructions, and forwards the output to either Elasticsearch or Logstash.
Installing Winlogbeat
Download Winlogbeat 5.0.0-alpha4 from Elastic’s Downloads page and extract the package into C:\Program Files (for the sake of convenience, rename the winlogbeat-<version> directory to Winlogbeat).
Then, install Winlogbeat by opening PowerShell as Administrator and running the following command to set the execution policy for the current session to allow the installation script to run:
cd 'C:\Program Files\Winlogbeat'

PowerShell.exe -ExecutionPolicy UnRestricted -File .\install-service-winlogbeat.ps1
Then, install using:
.\install-service-winlogbeat.ps1
You should get the following output:
Status   Name               DisplayName

------   ----               -----------

Stopped  winlogbeat         winlogbeat
Winlogbeat configuration options
Winlogbeat has a number of configuration options that are worth mentioning before configuring our specific logging pipeline. These configurations are made in the Winlogbeat configuration file at C:\Program Files\Winlogbeat\winlogbeat.yml.
First, in the ‘Winlogbeat specific options’ section, you can define which specific event logs you want to monitor. By default, Winlogbeat is set to monitor application, security, and system logs.
A tip: If you’re not sure which event logs are available, just run Get-EventLog * in PowerShell. You should get an output like this:
Max(K) Retain OverflowAction        Entries Log

------ ------ --------------        ------- ---

20,480      0 OverwriteAsNeeded         386 Application

10,240      0 OverwriteAsNeeded          31 EC2ConfigService

20,480      0 OverwriteAsNeeded           0 HardwareEvents

   512      7 OverwriteOlder              0 Internet Explorer

20,480      0 OverwriteAsNeeded           0 Key Management Serv

20,480      0 OverwriteAsNeeded       1,724 Security

20,480      0 OverwriteAsNeeded         929 System

15,360      0 OverwriteAsNeeded          39 Windows PowerShell
Next, in the General section of the configuration file, you can add the name of the log shipper that is publishing the network data (the name is used for grouping data with a single name identifier). You can also add additional fields to the log messages such as application_name and environment.
The Outputs sections are where we configure the location to which we want to forward the logs. By default, a local Elasticsearch installation is defined as the output:
output.elasticsearch:
   hosts:
      - localhost:9200
Of course, you can decide to output the event logs to Logstash instead — as we will do in the next step.
Last but not least, we can set the logging level in the Logging section to critical, error, warning, info, or debug.
Configuring our logging pipeline
Now that we have understood our configuration options, it’s time to configure Winlogbeat to ship event logs to the Logz.io ELK Stack.
Open the Winlogbeat configuration file at: C:\Program Files\Winlogbeat\winlogbeat.yml and paste the following configuration:
winlogbeat.event_logs:

- name: Application
   ignore_older: 72h
- name: Security
- name: System

fields:
   logzio_codec: json
   token: UfKqCazQjUYnBNcJqSryIRyDIjExjwIZ
fields_under_root: true

output.logstash:
   # The Logstash hosts
   hosts: ["listener.logz.io:5015"]
   # Optional TLS. By default is off.
   # List of root certificates for HTTPS server verifications tls.certificate_authorities: ['c:\Program Files\Winlogbeat\COMODORSADomainValidationSecureServerCA.crt']
A few notes on this configuration.
In this case, we are sending the event logs to the Logz.io ELK, so we commented out the Elasticsearch as an output section. Also, there are additional fields here that are specific to shipping to the Logz.io ELK Stack: logz.io_codec, token, and the TLS certificate path (you will need to download your own certificate to ship to Logz.io).
If you’re shipping to your own Elasticsearch or Logstash instance, you can use the default settings in the file and omit the addition of these additional fields.
Save the file, and start the service. You can use the Windows service manager or PowerShell to do this:
PS C:\Program Files\Winlogbeat> Start-Service winlogbeat
Analyzing and visualizing event logs
Open Kibana, and you should see your event logs displayed. If you’re already shipping logs from a different data source, you can differentiate the two streams of data using the following query in Kibana:
type: wineventlog
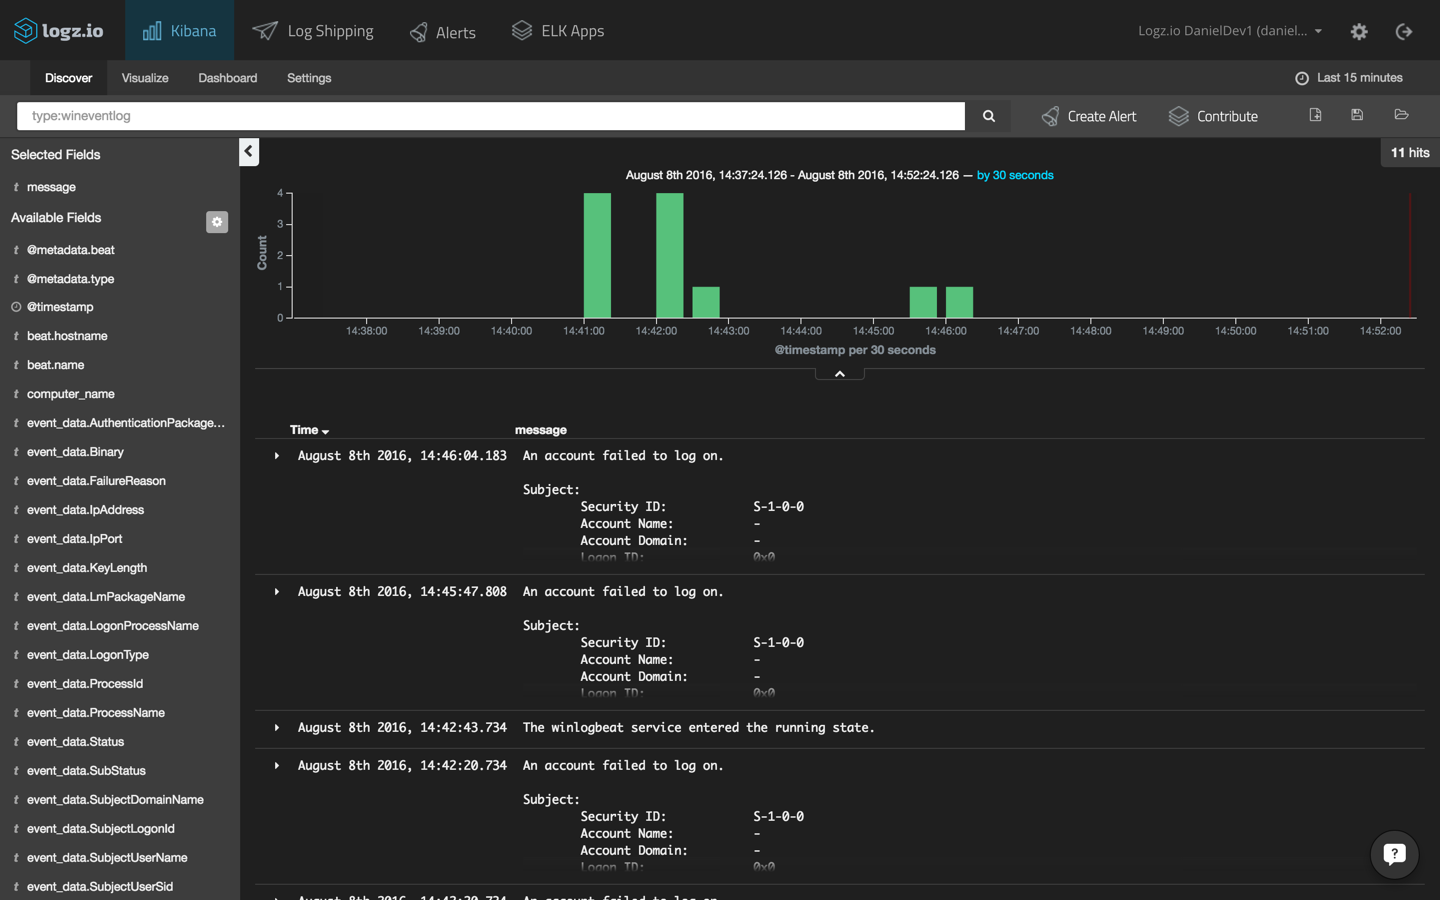
Select one of the entries to view all of the fields that are available for analysis. Select the JSON tab to view the event logs as they are indexed by Elasticsearch. For example, here is the event log report that the Winlogbeat service has begun running:
{
   "_index": "logz-dkdhmyttiiymjdammbltqliwlylpzwqb-160808_v1",
   "_type": "wineventlog",
   "_id": "AVZp9m4P-SDvkjEsrQTt",
   "_score": null,
   "_source": {
      "computer_name": "WIN-E9CD0MMN9GJ",
      "process_id": 676,
      "keywords": [
      "Classic"
   ],
   "logzio_codec": "json",
   "log_name": "System",
   "level": "Information",
   "@metadata": {
      "beat": "winlogbeat",
      "type": "wineventlog"
   },
   "record_number": "24082",
   "event_data": {
      "Binary": "770069006E006C006F00670062006500610074002F0034000000",
      "param1": "winlogbeat",
      "param2": "running"
   },
   "type": "wineventlog",
   "message": "The winlogbeat service entered the running state.",
   "tags": [
      "beats-5015",
      "_logzio_codec_json",
      "_jsonparsefailure"
   ],
   "thread_id": 3876,
   "@timestamp": "2016-08-08T11:42:43.734+00:00",
   "event_id": 7036,
   "provider_guid": "{555908d1-a6d7-4695-8e1e-26931d2012f4}",
   "beat": {
      "hostname": "WIN-E9CD0MMN9GJ",
      "name": "WIN-E9CD0MMN9GJ"
   },
   "source_name": "Service Control Manager"
},
"fields": {
   "@timestamp": [
      1470656563734
   ]
},
"highlight": {
   "type": [

"@kibana-highlighted-field@wineventlog@/kibana-highlighted-field@"
   ]
 },
 "sort": [
    1470656563734
  ]
}
You can now use Kibana to query the data stored in Elasticsearch. Querying is an art unto itself, and we cover some of the common methods in Elasticsearch queries guide.
As an example, say you would like to see a breakdown of the different event types. Using the query above as the basis for a pie-chart visualization, we are going to use the following configuration:
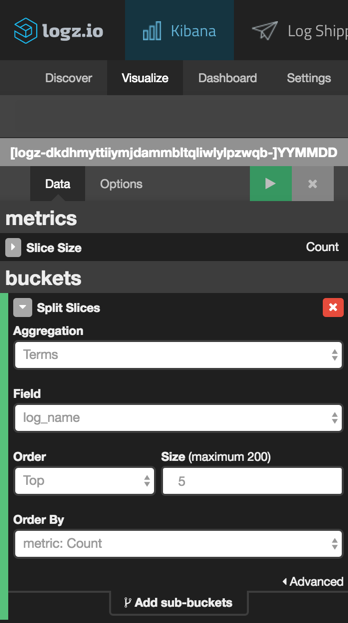
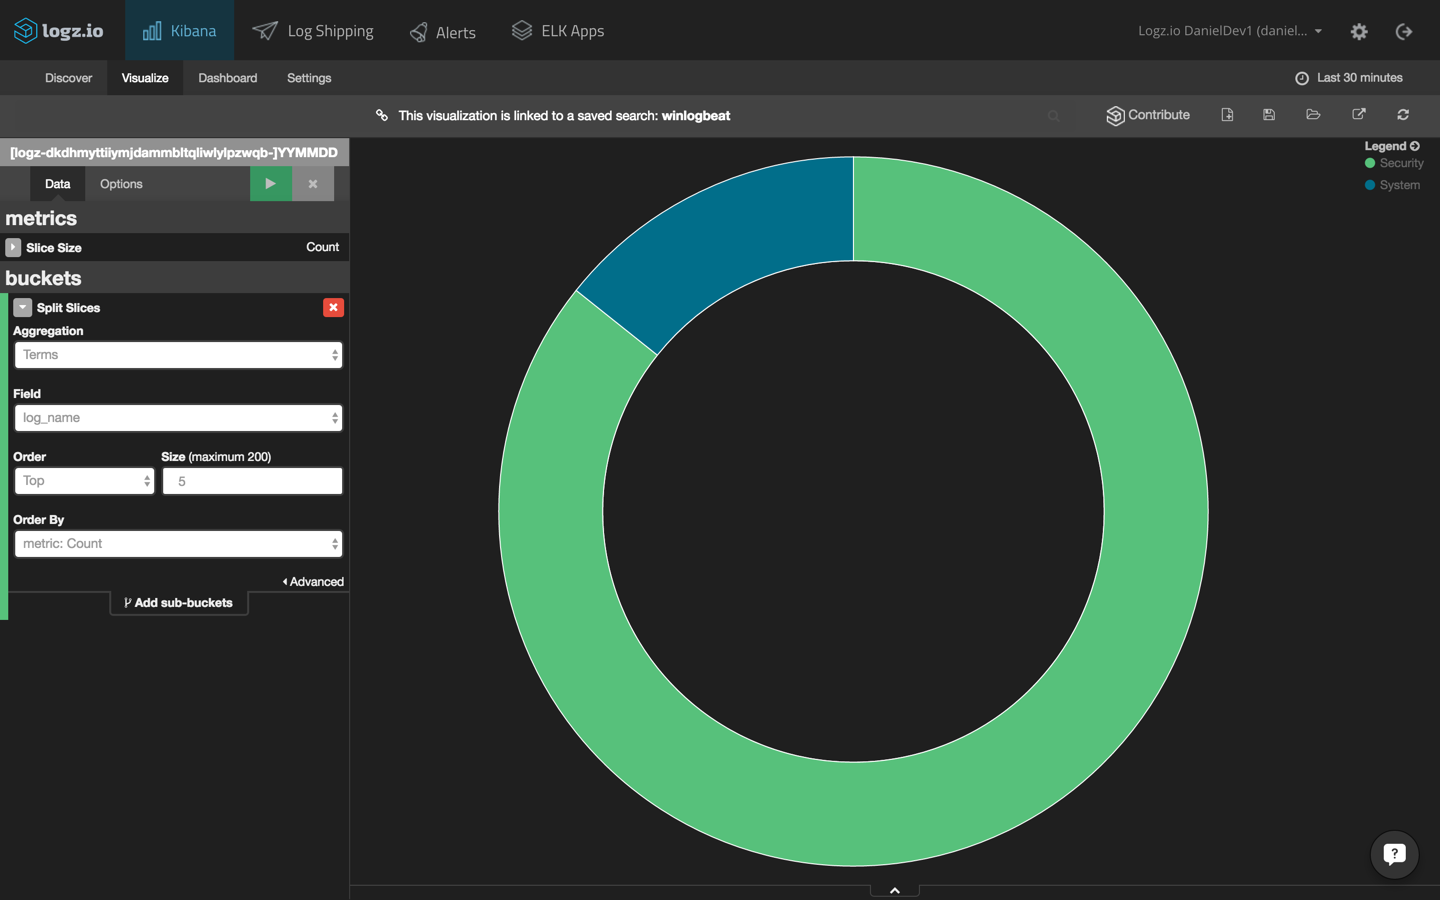
We’re using a split-slice aggregation using the “log_name” field. Here is the result of this configuration (hit the green play button to preview the visualization):
Now, Logz.io ships with a library of pre-made KIbana searches, alerts, visualizations and dashboards tailored for specific log types — including, Windows event logs. Saving you the time for building different visualizations, you can hit the ground running with a ready-made dashboard.
To install this dashboard, simply open ELK Apps, search for Winlogbeat in the search box, and install the dashboard.
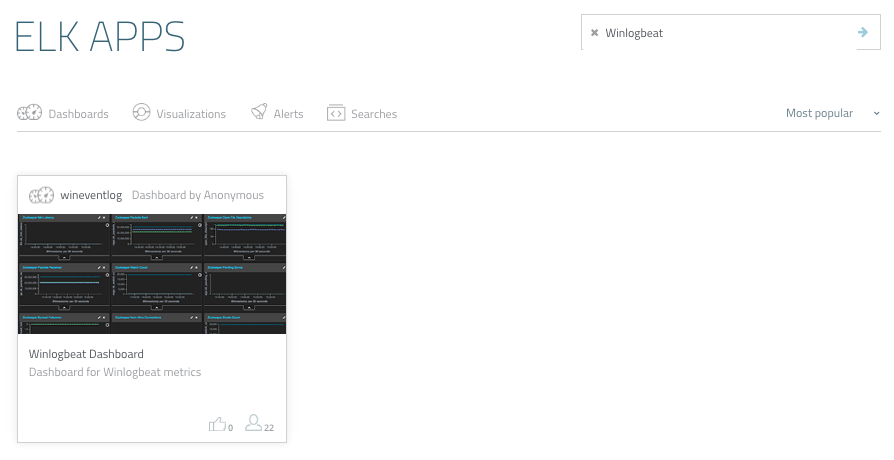
When you open the dashboard, you will see a series of visualizations: number of events over time, number of events, event sources, top event IDs, event levels, and Windows event log searches.
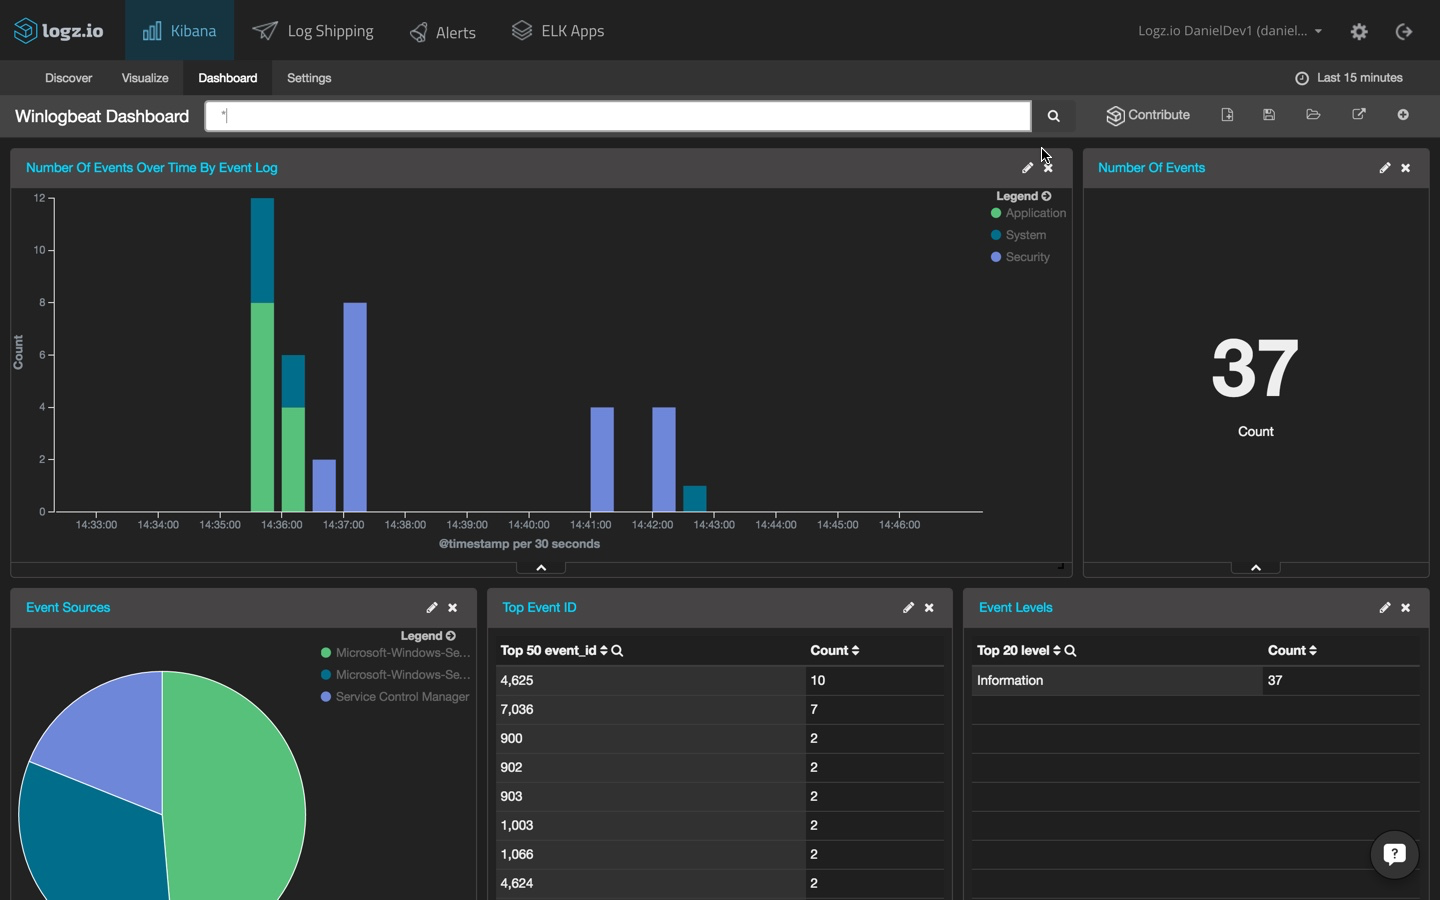
Of course, you can customize these visualizations any way that you like or create various other visualizations based on the indexed fields — this functionality is why Kibana is so powerful.
In Summary
ELK and Windows are being used together more and more for the simple reason that existing solutions are not as flexible as well as the obvious fact that ELK is open source. Windows environments output so much data that using the Windows event viewer is simply not a viable option anymore. The ability to query the data and build rich, beautiful visualizations is a huge benefit that ELK offers.

You Might Also Like

SIEM vs. Security Analytics

