
Creating Custom Kibana Visualizations: A How-To Guide
December 1, 2015

For updated tutorials and best practices, check out our additional Kibana resources.
Kibana, being the ‘K’ in ‘ELK’, is the amazing visualization powerhouse of the ELK Stack.
We use the software to create nice dashboards that display metrics including page visits, server JVM performance, messages from our client-side application, and technical SEO data. Kibana is great at creating these visualizations with a useful plugin infrastructure that allows users to extend Kibana’s capabilities to create many different custom visualizations.
More on the subject:
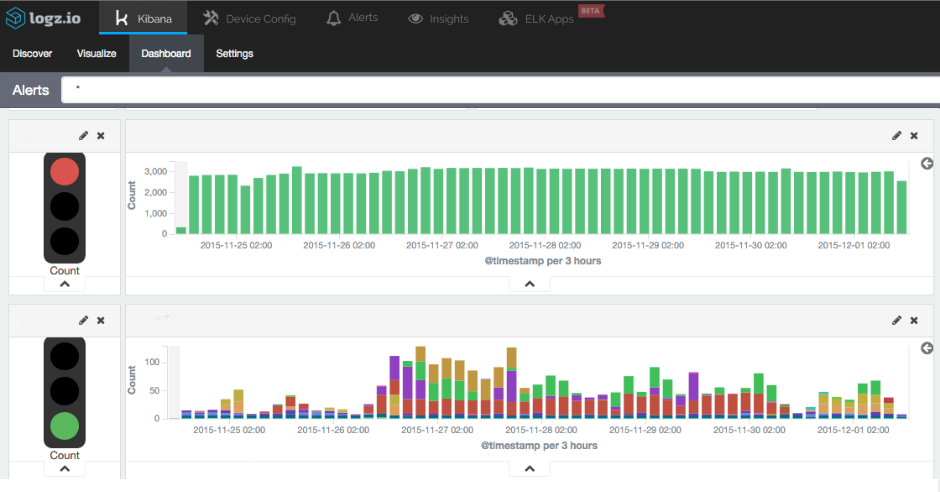
In this tutorial, I will demonstrate how we extended Kibana to add a “traffic light” visualization to the software’s features. This will be very similar to the “metric” visualization but designed to work as a traffic light. Green is for a metric that is “good”; red is for a metric that is “bad.” (The background: Our DevOps team had been looking for a simple and intuitive way to visualize “good versus bad,” so I decided to add a stoplight for our NOC team.)
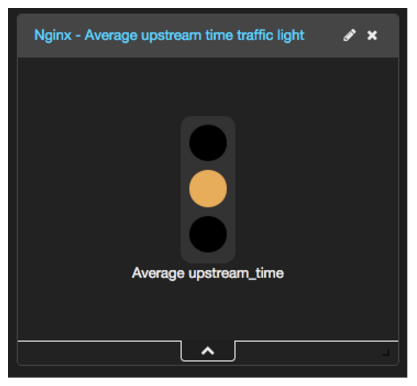
We have also added a visualization to our ELK Apps library that can leverage Nginx log data to show average response time as a traffic light visualization.
This example and more will reside in our public GitHub directory.
(Note: All code snippets here are for Kibana v.4.1.2. Doing the same for subsequent versions of Kibana is similar, but the project structure will have changed, so you might need to find the updated folders.
Preparation
To make the code easy to maintain, we are going to place (most of) it in a separate directory for our visualization. Go to Kibana’s ‘/plugins’ directory and add a directory named ‘traffic_light_vis’.
Registering our visualization
Kibana has created a module called a “registry” that is essentially a list of static arrays that hold various lists in Kibana for different settings such as which apps, plugins, and visualizations that Kibana has. For visualizations, Kibana holds a registry called ‘vis_types’ which defines which types of visualizations are available. (If you’re interested in how this works, you can see more detail at GitHub.)
So, for our visualization, we’re going to add an ‘index.js’ file to our new folder and our registration to the ‘vis_types’ list. The file should look like this:
define(function (require) {
 require('registry/vis_types').register(function (Private) {
   return Private(require('plugins/traffic_light_vis/traffic_light_vis'));
 });
});
This will look for our traffic light visualization in a file called ‘traffic_light_vis’, so let’s create that file now.
 Defining our visualization
We’re going to create another file in the ‘traffic_light_vis’ library named ‘traffic_light_vis.js’ to define the properties of our visualization.
For the definition of the visualization, Kibana expects to get back a ‘VisType’ object. This object represents the visualization, and it’s worth explaining that Kibana works with two main types of visualizations:
- Template visualizations. This is an object called ‘TemplateVisType’, which inherits directly from the ‘VisType’ object. Template visualizations are for visualizations that do not require special canvas rendering. They are good for visualizations such as metric visualizations or those for a data table. You define them with an Angular-based template file, and angular binds the data queried from Elasticsearch to your template.
Our traffic light visualization will be drawn with basic HTML and CSS, so we’ll use this type of visualization for now. - VisLib visualizations. An object called ‘VisLibVisType’ also directly inherits from ‘VisType’ and uses D3 to render more complex visualizations on an HTML canvas. These are used for all of the other visualizations that Kibana supports such as pie charts, line charts, and histograms.
Here are links to Kibana’s GitHub repository for more information on these objects:
The definition of our visualization should look like this:
define(function (require) {
 // we need to load the css ourselves
 require('css!plugins/traffic_light_vis/traffic_light_vis.css');

 // we also need to load the controller and used by the template
 require('plugins/traffic_light_vis/traffic_light_vis_controller');

 return function (Private) {
   var TemplateVisType = Private(require('plugins/vis_types/template/template_vis_type'));
   var Schemas = Private(require('plugins/vis_types/_schemas'));

   // return the visType object, which kibana will use to display and configure new
   // Vis object of this type.
   return new TemplateVisType({
     name: 'traffic_light',
     title: 'Traffic Light',
     description: ‘Great for one-glance status readings, the traffic light visualization expresses in green / yellow / red the position of a single value in relation to low and high thresholds.’,
     icon: 'fa-car',
     template: require('text!plugins/traffic_light_vis/traffic_light_vis.html'),
     params: {
       defaults: {
         fontSize: 60,
         width: 50,
         redThreshold: 20,
         greenThreshold: 80
       },
       editor: require('text!plugins/traffic_light_vis/traffic_light_vis_params.html')
     },
     schemas: new Schemas([
       {
         group: 'metrics',
         name: 'metric',
         title: 'Metric',
         min: 1,
         defaults: [
           { type: 'count', schema: 'metric' }
         ]
       }
     ])
   });
 };
});
As you can see, the TemplateVisType constructor receives a JSON of the parameters of our visualization:
- ‘name’ is for internal Kibana use
- ‘title’, ‘icon’, and ‘description’ are for the visualization-creation wizard
- ‘template’ is the HTML template that Kibana will use to render the visualization
- ‘params’ is the list of parameters that can be configured by the user for this visualization
- ‘schemas’ is a list of metric types that we’re allowing the user to choose for this visualization
Styling our visualization
In the definition of our visualization, we linked to a non-existent template file. We can create this file now. We called it ‘traffic_light_vis.html’, and it should look like this:
<div ng-controller="TrafficLightVisController" class="traffic-light-vis">
   <div class="metric-container" ng-repeat="metric in metrics">
       <div class="traffic-light-container" ng-style="{'width': vis.params.width+'px', 'height': (2.68 * vis.params.width)+'px' }">
           <div class="traffic-light">
               <div class="light red" ng-class="{'on': metric.value <= vis.params.redThreshold }"></div>
               <div class="light yellow" ng-class="{'on': metric.value > vis.params.redThreshold && metric.value < vis.params.greenThreshold }"></div>
               <div class="light green" ng-class="{'on': metric.value >= vis.params.greenThreshold }"></div>
           </div>
       </div>
       <div>{{metric.label}}</div>
   </div>
</div>
You can see that the metrics we receive are in the array ‘metrics’. (This comes from our visualization controller, which we will describe below.)
All of the defined parameters that this visualization can configure are injected into our template under the ‘vis.params’ object. You can see the CSS definitions in this GitHub repository.
The visualization editor
The ‘params’ object that we defined in our visualization object consists of parameters that we would like users to be able to configure. In the params section, we also referenced an HTML file under the ‘editor’ value that we will explain in detail here
When you are editing a visualization, you will see an HTML template on the left side of the screen. The parameters are shown in your template as ‘vis.params’, and whatever you bind here to the model will be saved in your Kibana visualization object.
The template file in our parameters editor looks like this:
<div class="form-group">
 <label>Traffic light width - {{ vis.params.width }}px</label>
 <input type="range" ng-model="vis.params.width" class="form-control" min="30" max="120"/>
</div>
<div class="form-group">
 <label>Red threshold</label>
 <input type="number" ng-model="vis.params.redThreshold" class="form-control"/>
</div>
<div class="form-group">
 <label>Greed threshold</label>
 <input type="number" ng-model="vis.params.greenThreshold" class="form-control"/>
</div>
The controller
The controller that we referenced earlier in the definition of our visualization definition is responsible for passing the response from the Elasticsearch query to our template for rendering.
In our case, I copied the controller logic from the metric visualization and removed the field formatting (since we want to deal with a clear number). It should look like this:
define(function (require) {

 var module = require('modules').get('kibana/traffic_light_vis', ['kibana']);

 module.controller('TrafficLightVisController', function ($scope, Private) {
   var tabifyAggResponse = Private(require('components/agg_response/tabify/tabify'));

   var metrics = $scope.metrics = [];

   $scope.processTableGroups = function (tableGroups) {
     tableGroups.tables.forEach(function (table) {
       table.columns.forEach(function (column, i) {
         metrics.push({
           label: column.title,
           value: table.rows[0][i]
         });
       });
     });
   };

   $scope.$watch('esResponse', function (resp) {
     if (resp) {
       metrics.length = 0;
       $scope.processTableGroups(tabifyAggResponse($scope.vis, resp));
     }
   });
 });
});
After following this process, you should have your custom Kibana visualization!

You Might Also Like

Manual vs. AI-Driven Alert Triage and RCA: Who Will Win?

