Overcoming the Biggest Challenge in Log Analysis Using Logz.io Cognitive Insights
August 31, 2016

In the realm of log analysis, the biggest challenge facing IT and DevOps teams is being able to find the needle in the haystack — to identify that single log message that indicates that something in your environment is broken and is about to crash your application.
Often enough, events that are clear indicators that a crisis is about to occur get lost simply because people don’t know what they’re looking for in the stream of Big Data that is being ingested into their log pipelines. The issues could be something as simple as a maxed-out Linux memory usage error or a simple syntax error in some application code. Troubleshooting after the fact is also a challenge for the very same reason.
But what if there are people out there with similar setups who have already encountered these events, troubleshooted them in their environments, and shared their solutions for the community to use? Wouldn’t it be helpful for people to be able to use this knowledge in their own environments to be able to identify issues before they affect their businesses?
The answer, of course, is yes — and this is where Logz.io’s new Cognitive Insights feature comes into the picture.
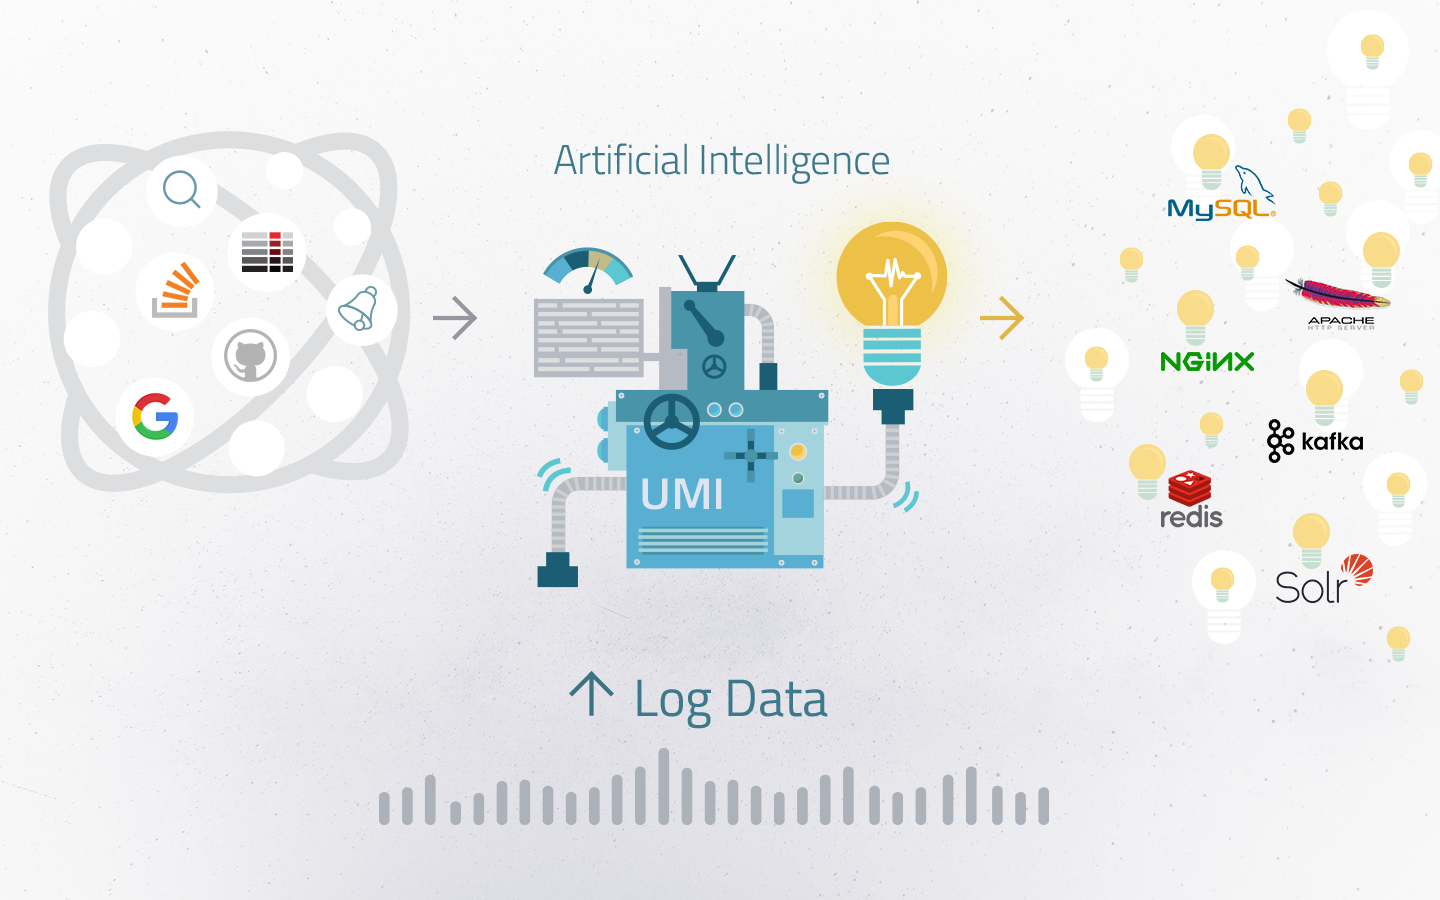
Cognitive Insights adds an element of machine understanding and crowdsourcing to the powerful storage and analysis capabilities of the ELK Stack. Built on top of UMI™ — an artificial intelligence engine created and released recently by Logz.io — this feature exposes these “missed” events by correlating your log data with different data sources such as social threads, discussion forums, and open source repositories (learn more about Cognitive Insights and UMI and read our blog post that announced the feature).
This guide will provide a brief demonstration of how to use Cognitive Insights to easily identify issues on time — before they affect the business.
An example environment
This example will use a simple Java application that is based on an Apache web server and MySQL database. In this case, the Logz.io ELK Stack will ingest application logs, Apache logs, database logs, and server performance metrics using the Logz.io performance agent.
Identifying the event
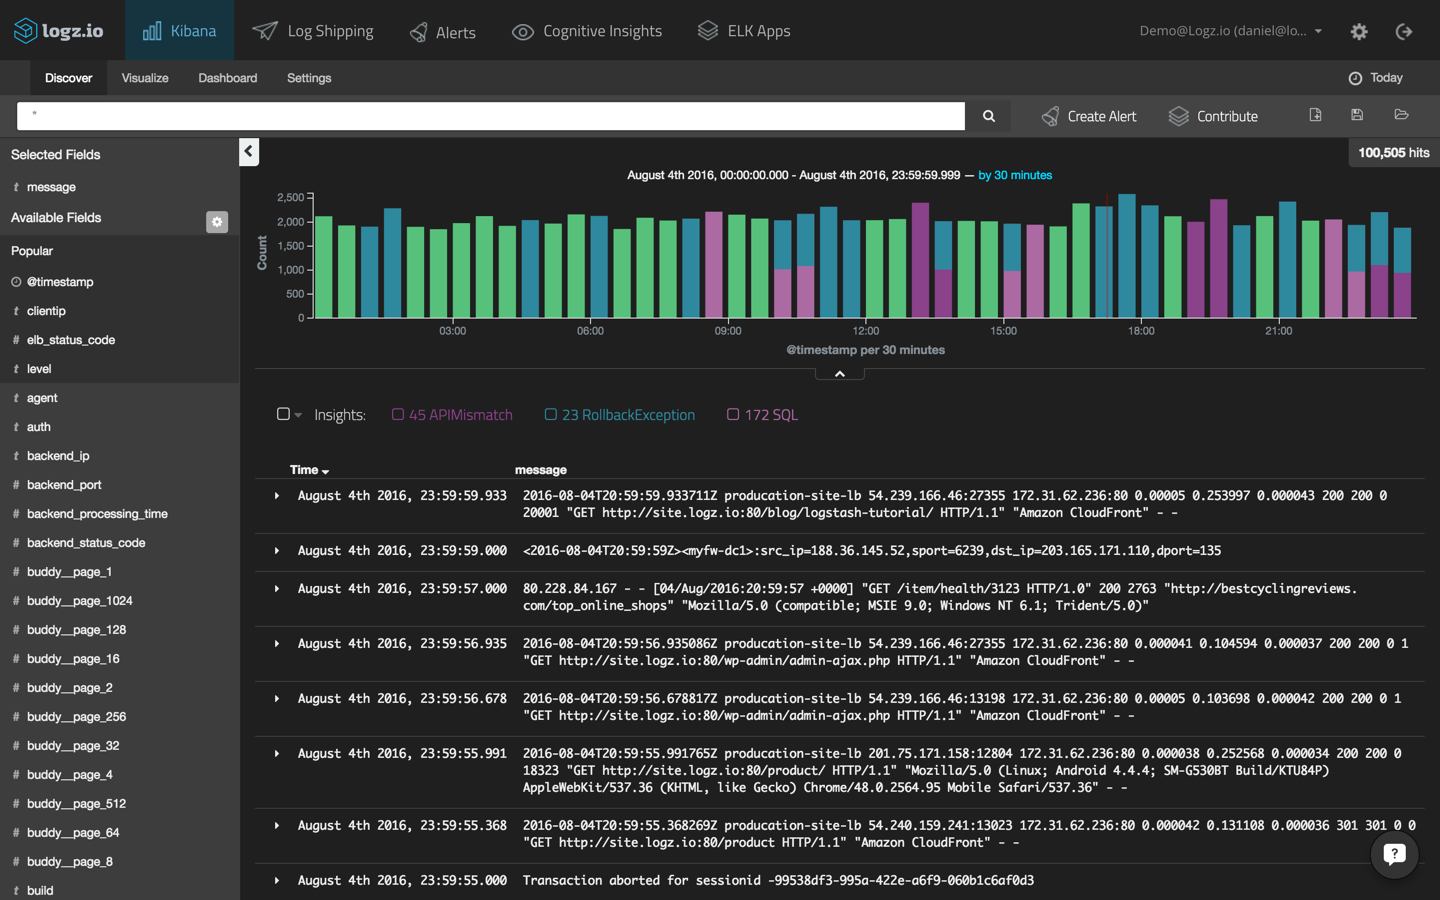
The journey starts, as always, in Kibana. When you open the Kibana Discover tab in the Logz.io UI, something quickly stands out — some of the log buckets are colored differently than with the usual Kibana green. Furthermore, three different event types are displayed above the list of log messages: “APIMismatch,” “RollbackException,” and “SQL”:
These are the insights identified by the UMI engine. You can see that there are 172 SQL events, so start with this insight by simply selecting the adjacent check-box.
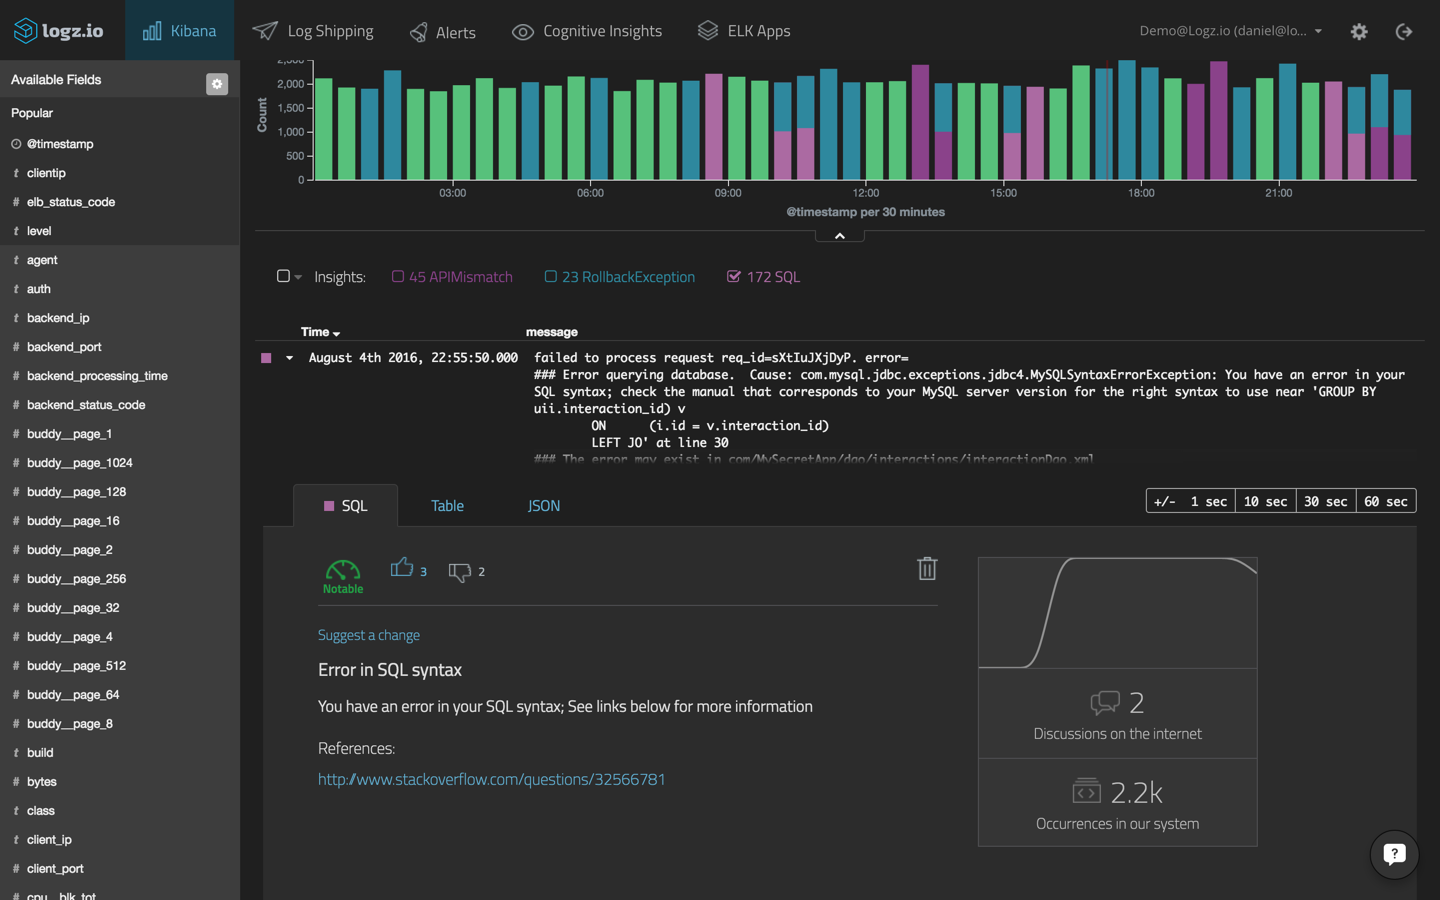
A list of all the SQL events identified is displayed. Drilling down further, select one the SQL events from the list that is displayed:
Issue resolution
Before you continue, it’s important to try to understand what has actually happened here.
The UMI engine has correlated the SQL log messages with existing resources on the Web and has found that other people have interacted with this same specific data in their environments, implying that an event is taking place that may need examination.
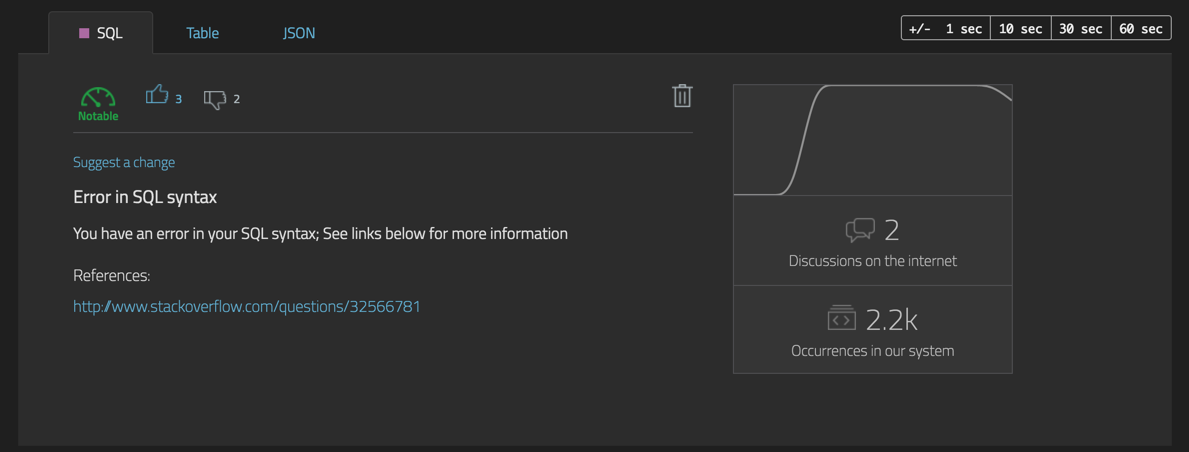
The information displayed in the Insight box helps you to understand more about the context in which the event was logged, and it lists the resources necessary to take the next step.
“Error in SQL syntax” is the title of the event, and the short description shows that there is a simple SQL syntax error. The graph on the right shows the total number of occurrences of this event in the system as well as the number of discussions on the Web involving this very same event.
A reference is listed as well, leading to a resource on the Web — in this case StackOverflow — that contains information on how to resolve the issue.
Scrolling down in the log message itself, you can see that there is an SQL syntax issue on line 30:
Caused by: com.mysql.jdbc.exceptions.jdbc4.MySQLSyntaxErrorException: You have an error in your SQL syntax; check the manual that corresponds to your MySQL server version for the right syntax to use near 'GROUP BY uii.interaction_id) v
        ON      (i.id = v.interaction_id)
        LEFT JO' at line 30
Back in the Insight tab, click the link to the resource that UMI has identified as correlating with the log data.
You can decide whether this insight is relevant or not. If not, you can dismiss it. Either way, your vote will be factored in UMI’s machine learning calculations for when this issue arises in other IT environments in the future.
Managing our insights
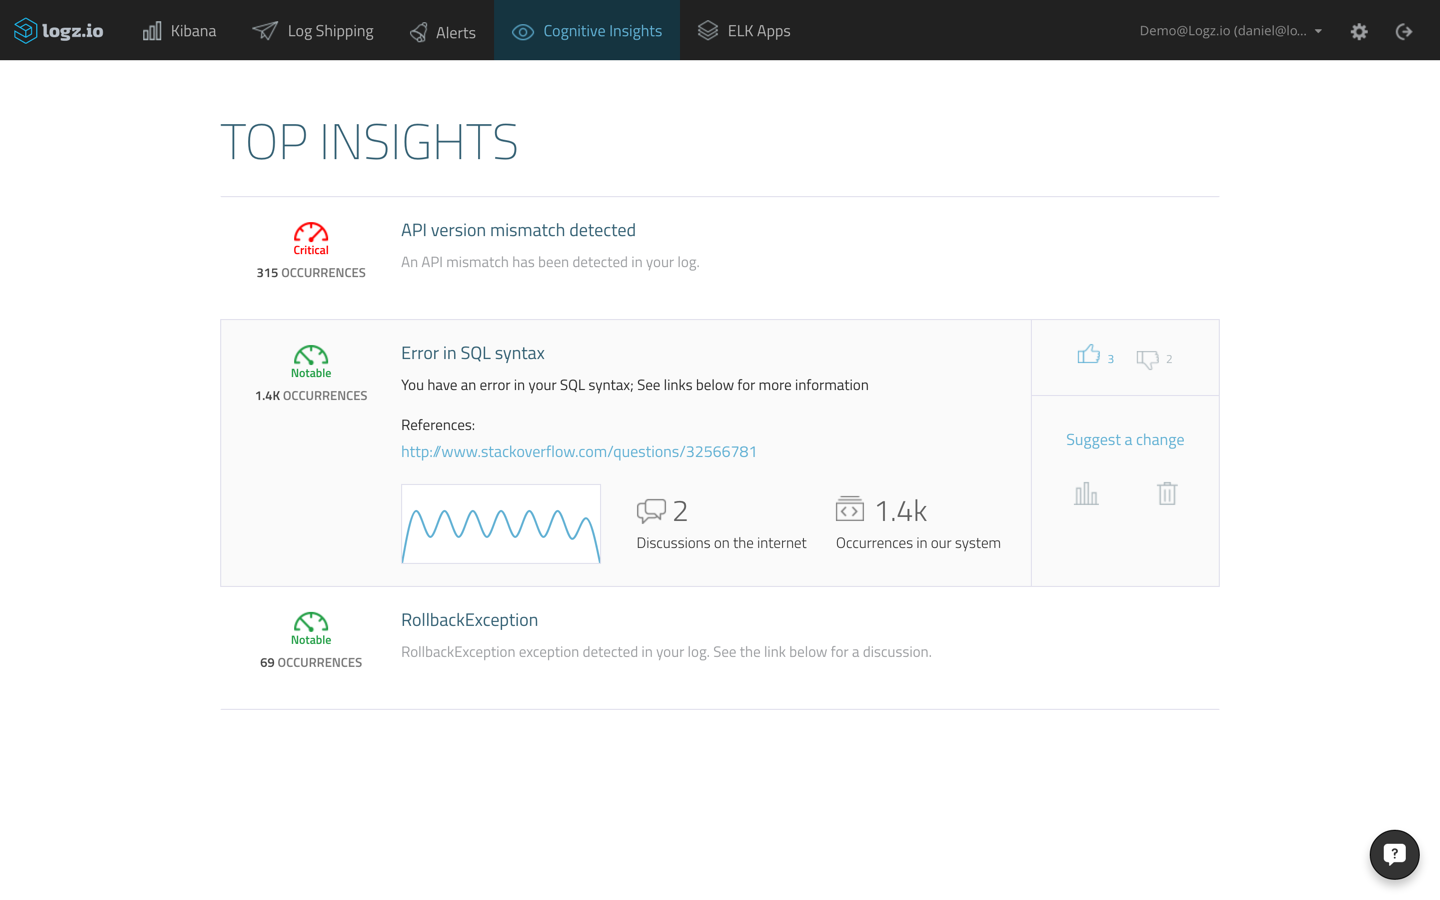
In larger environments involving real-life scenarios, you will start to see that list of insights growing. A list of the most frequent events is on the Insights page within the Logz.io UI:
Here, you can open a selected insight in Kibana and read all of the available information.
This is also the place to submit feedback (click “Suggest a change”). So, if there is an issue with an insight’s details (such as a link to the wrong resource), you can tell UMI. The engine is evolving all the time, and getting input from users is the best way to optimize the underlying algorithms.
A summary
It’s as simple as that. Using Cognitive Insights, you will no longer be driving blindfolded — events with the potential of causing real damage to your system will surface up in your Kibana dashboard together with actionable data, and all this by harnessing the knowledge of the community!
More on the subject:
It is much more than a simple error alerting mechanism — using machine learning and crowdsourcing, UMI reveals those notices and warnings that would go unnoticed in normal circumstances.
The UMI engine is currently producing a growing pool of hundreds of thousands of known, important, and relevant insights that can be used to troubleshoot any underlying issue quickly before it affects business operations.
Learn more about CI and UMI or request a free demo to test drive the entire platform for yourself.
